1806 S Pitt St · Greenville, NC
Flood risk 1/10 · Minimal
- FEMA flood zone
- X (unshaded)
- Chance of flooding over 30 yrs
- 0.0%
- Est. flood insurance / yr
- $507 – $1,088
Fire risk 1/10 · Minimal
- Est. fire insurance / yr
- $906 – $1,684
Heat risk 8/10 · Major
- Hot days now (above 106°F)
- 7 days/yr
- Hot days in 30 yrs
- 17 days/yr
Wind risk 8/10 · Major
- Chance of severe wind over 30 yrs
- 80.0%
Air-quality risk 3/10 · Minor
- Unhealthy air days now
- 3 days/yr
- Unhealthy air days in 30 yrs
- 3 days/yr
Risk factors via First Street. Map © Google.
Why this score? — see what drove the D grade
The composite is a weighted blend of 9 inputs, each scored 0–100. Each bar is that input's sub-score; the figure is the points it added to the 100-point composite (weight × sub-score).
- Cash flow +18.0/30.0
- DSCR +5.6/10.0
- Rent growth +3.9/5.0
- Livability +3.9/5.0
- 1% rule +3.6/10.0
- Schools +3.6/10.0
- Condition / age +2.5/5.0
- ARV discount +0.0/15.0
- Appreciation +0.0/10.0
$144,900
🖨 Deal sheet 📄 Offer letter ✓ Due diligence
Listing remarks
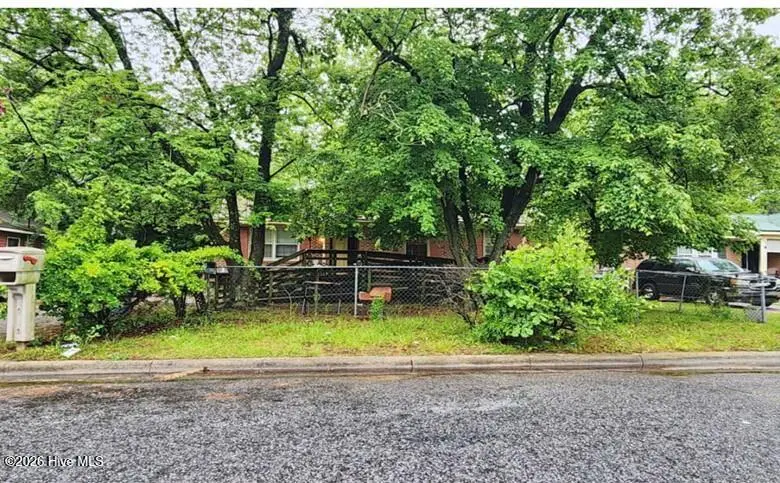
NO ACCESS OR VIEWINGS of this property - no interior photos. Please DO NOT DISTURB the occupant. Built in 1982, this one level brick home offers approximately 1086 finished square feet, three bedrooms and one full bath. This home sits on an approximate 6098 sqft lot. ''As is'' cash only sale with no contingencies or inspections. Buyer will be responsible for obtaining possession of the property upon closing.
Key facts
- 6,098 sq ft lot
- Built 1982
- Listed 29 days
Property features AI
Exterior
- Parking: On-site parking
- Utilities: Public water; Public sewer; Cable available
- Home design: Single-family residence; One story; Entry level: 1
- Construction: Brick construction (see remarks); Built with crawl space foundation
- Exterior features: Deck; Shingle roof; Has a view; City street and state road frontage
Interior
- Bathrooms: 1 full bathroom
- Heating & cooling: Central air; Baseboard heating; Electric heating
- Interior features: Appliances: None; 6 total rooms; Crawl space basement; Central air cooling; Baseboard and electric heating
Neighborhood map
What this means for you Summary
Snapshot
- This is a 3-bed/1.0-bath single-family listed at $145k.
Deal economics
- At list price, monthly cash flow is $124 ($1k/yr) — positive.
- The deal already cash-flows at list — no discount required.
- To meet the 1% rule (rent ≥ 1% of price), the offer needs to be $125k (14.1% below list).
- Recommended offer: $125k (14.1% below list) — sets the bar for 1% rule.
- Cap rate 7.3% vs local median 3.8% in Greenville — top-decile yield for the area; either an underpriced asset or a hidden risk that comps aren't pricing in. Stress-test before assuming the spread holds.
Location & tenants
- Location reads 77/100 on livability (#30 in NC, #2,977 nationally) — a middle-class / working-renter tenant base. Strengths: commute A+, cost of living A+, health & safety A+; Watch: crime F, employment F.
- Pitt County Schools (rural): math 41% / reading 44% proficiency, ranked #100 of 178 in NC (top 56%) — families likely to look elsewhere, expect single-tenant / working-renter base with shorter leases.
- Zoned schools: Elmhurst Elementary (math 27% / reading 37%, grade F, #908 of 1,410 statewide, top 67%, 460 students, 58% FRL); E B Aycock Middle (math 27% / reading 30%, grade F, #355 of 475 statewide, top 76%, 661 students, 99% FRL); Junius H Rose High (math 52% / reading 61%, grade C, #261 of 535 statewide, top 49%, 1,525 students, 50% FRL).
- Market conditions: Rents rising fast (+5.4%/yr); 350 active listings in the ZIP; 25 comparable units currently listed for rent nearby; rentals at typical pace (median 21d on market — plan ~3-4 weeks tenant-placement turnaround); 1,300 units permitted in Pitt County in 2024 (204 in 5+ unit buildings).
- This rent runs 31% of the median local income ($49k/yr) — at the standard rent-burdened threshold; future hikes will face affordability resistance.
Forward outlook
- Local home prices are declining (-3.0%/yr); year-one equity from $1k of loan paydown is wiped out by about $4k of value loss. Plan a longer hold.
- Pitt County population projected at +22% by 2050 — long-run rental-demand tailwind backs the buy-and-hold thesis.
Negotiation context
- It's been on market 30 days — a 2% lower offer ($143k) is reasonable based on typical stale-listing flexibility.
Risks & watch-outs
- Climate carrying-cost: severe wind risk, 80% chance of damaging wind over 30y; extreme-heat days projected 7→17/yr by 2055 (HVAC capex compounding) — expect insurance premiums to compound above CPI over the hold.
Questions for the listing agent
- Is there a deadline driving the sale (1031 exchange, divorce, estate, relocation)? That informs how much negotiation room exists.
- Crime grade is F in this area — have there been break-ins, vandalism, or insurance claims at this property in the last 3 years? What carrier currently insures it and at what premium?
- The area grade is low — what's the realistic commute time and amenity access for the typical tenant pool here? Any planned neighborhood developments (good or bad) we should know about?
- What's the average days-on-market for RENTAL listings here right now (not sales)? A rising rental-DOM trend means longer vacancies and softer asking-rent achievability than the comps imply.
- What's the recent tenant-quality profile in this submarket — average credit score on applications, eviction rate, late-payment / NSF rate, and stable-employment percentage? A property-management company in the area should have these aggregated.
- How much new for-sale + rental construction is in the pipeline within 1–3 miles? Heavy new supply typically softens prices + rents 12–24 months out; constrained supply supports both.
Investment metrics
- 1% rule
- 0.86% ✗
- Cap rate
- 7.32%
- Cash-on-cash
- 3.67%
- DSCR
- 1.16
- GRM
- 9.7
CMA / ARV
- ARV (on-the-fly)
- $120,546
- Comps found
- 12
Show comp detail 12 sales within ~0.75 mi
| Address | Dist | Beds/Ba | Sqft | Sold | Price | $/sf | Match |
|---|---|---|---|---|---|---|---|
| 1906 S Greene St | 0.11mi | 3/1.0 | 1,001 (-8%) | 6mo | $153,000 | $153 | 77 |
| 2108 Pendleton St | 0.66mi | 3/2.0 | 1,080 (-1%) | 3mo | $225,000 | $208 | 62 |
| 204 Commerce St | 0.59mi | 3/2.0 | 1,155 (+6%) | 3mo | $200,500 | $174 | 56 |
| 503 Pittman Dr | 0.69mi | 3/1.0 | 1,150 (+6%) | 4mo | $137,500 | $120 | 55 |
| 1703 S Greene St | 0.14mi | 2/1.0 (-1) | 930 (-14%) | 12mo | $45,000 | $48 | 55 |
| 200 S Sylvan Dr | 0.69mi | 3/1.5 | 1,022 (-6%) | 2mo | $125,000 | $122 | 54 |
| 613 Howell St | 0.25mi | 2/1.0 (-1) | 970 (-11%) | 14mo | $99,000 | $102 | 54 |
| 309 N Sylvan Dr | 0.63mi | 3/1.0 | 1,132 (+4%) | 12mo | $75,000 | $66 | 53 |
| 108 W 12th St | 0.60mi | 3/1.0 | 992 (-9%) | 10mo | $75,000 | $76 | 50 |
| 116 W 12th St | 0.60mi | 3/1.0 | 972 (-10%) | 10mo | $105,000 | $108 | 46 |
| 208 N Sylvan Dr | 0.70mi | 2/1.0 (-1) | 970 (-11%) | 11mo | $56,000 | $58 | 36 |
| 305 N Sylvan Dr | 0.66mi | 2/1.0 (-1) | 962 (-11%) | 12mo | $107,000 | $111 | 35 |
Match score weights: distance 35% · size 25% · config 20% · recency 20%. Top-matched comps best support the ARV.
Projected returns pro-forma
-3.0% appreciation · 5.44% rent growth · sell at horizon
- IRR
- -8.2%
- Equity multiple
- 0.69×
- Total profit
- $-12,524
- Equity at exit
- $21,605
- IRR
- 3.9%
- Equity multiple
- 1.31×
- Total profit
- $12,488
- Equity at exit
- $12,528
Cash invested: $40,572 (down + closing). Projections, not guarantees.
Landlord ↔ Tenant lean methodology
- Overall (STATE)
- 85 Strongly Landlord-Friendly
- State North Carolina
- 85 Strongly Landlord-Friendly · R+3
- County
- — inherits STATE
- City
- — inherits STATE
ZIP-level market 27834
- Rents YoY
- 5.4%
- Active inventory
- 350
- Price-to-rent
- 9.7×
Monthly cashflow live
- Estimated rent
- $1,245 high interval (Pro) →
- Mortgage (P&I)
- −$760
- Tax from tax record
- −$39 /mo · $473/yr
- Insurance
- −$60
- HOA
- −$0
- Vacancy / Maint / Mgmt
- −$261
- Net cashflow
- $124
Break-even live
UW: 25.0% down · 7.5% · 30yr · 1.5% tax · 5.0% vac · 8.0% maint · 8.0% mgmt
Financing live
Cash to close
- Down payment
- $36,225
- Closing costs
- $4,347
- Reserves months
- —
- Total cash needed
- —
Loan-product check · same deal, 3 products live
Conventional
25% down · 7.5% · 30yr
- Down + closing
- —
- Monthly P&I
- —
- Monthly cashflow
- —
- DSCR
- —
- Eligible?
- —
Personal DTI + credit; lowest rate.
DSCR
20% down · 8.5% · 30yr
- Down + closing
- —
- Monthly P&I
- —
- Monthly cashflow
- —
- DSCR
- —
- Eligible?
- —
No personal income docs; deal must DSCR.
Hard money
10% down · 12.0% · 12mo
- Down + closing
- —
- Monthly P&I
- —
- Monthly cashflow
- —
- DSCR
- —
- Eligible?
- —
Short-term bridge; refi at stabilization.
Rent comps 25 comps
| Address | Beds | Baths | Sqft | Rent | $/sqft | DOM | Units | Dist |
|---|---|---|---|---|---|---|---|---|
| 600 Howell St Apt E Greenville, NC | 2.0 | 1.0 | 1050 | $815 | $0.78 | 21d | 1 | 0.26mi |
| 2207 Wandsworth Dr Greenville, NC | 1.0–2.0 | 1.0 | 650 | $900 | $1.38 | 13d | 5 | 0.26mi |
| 1710 Garland St Greenville, NC | 2.0 | 1.0 | 884 | $1,195 | $1.35 | 21d | 1 | 0.26mi |
| 111 Lakeview Ter Greenville, NC | 2.0–3.0 | 1.0–2.0 | 750 | $1,200 | $1.60 | 13d | 7 | 0.53mi |
| 1304 Myrtle St Greenville, NC | 3.0 | 1.0 | 978 | $1,375 | $1.41 | 21d | 1 | 0.83mi |
| 1902 Myrtle St Unit 1902-A Greenville, NC | 2.0 | 1.0 | 848 | $850 | $1.00 | 21d | 1 | 0.84mi |
| 300 Higgs St Unit 300-B Greenville, NC | 2.0 | 1.0 | 756 | $900 | $1.19 | 21d | 1 | 0.84mi |
| 504 Davenport St Unit A Greenville, NC | 2.0 | 1.0 | 900 | $895 | $0.99 | 13d | 1 | 0.96mi |
| 400 Arbor St Greenville, NC | 2.0 | 1.0 | 860 | $1,850 | $2.15 | 21d | 1 | 0.96mi |
| 550 Pitt-Greene Connector Greenville, NC | 4.0 | 1.0–4.0 | 1012 | $1,288 | $1.27 | 13d | 25 | 1.02mi |
| 1604 W Arlington Blvd Greenville, NC | 1.0–2.0 | 1.0 | 624 | $1,125 | $1.80 | 13d | 11 | 1.11mi |
| 2613 Whitaker Dr Greenville, NC | 2.0 | 1.0 | 853 | $1,004 | $1.18 | 21d | 1 | 1.20mi |
| 1612 Lincoln Dr Greenville, NC | 3.0 | 1.0 | 972 | $900 | $0.93 | 13d | 1 | 1.29mi |
| 709 Johnston St Unit Y Greenville, NC | 2.0 | 1.0 | 900 | $950 | $1.06 | 21d | 1 | 1.34mi |
| 1151 Cross Creek Cir Unit D Greenville, NC | 3.0 | 2.5 | 1338 | $1,550 | $1.16 | 13d | 1 | 1.37mi |
| 14a Merry Ln Greenville, NC | 1.0–3.0 | 1.0–2.5 | 1150 | $1,530 | $1.33 | 13d | 14 | 1.37mi |
| 1510 Bridle Ct Greenville, NC | 1.0–3.0 | 1.0–2.0 | 798 | $1,250 | $1.57 | 21d | 1 | 1.38mi |
| 1151 Cross Creek Cir Greenville, NC | 3.0 | 2.5 | 1338 | $1,600 | $1.20 | 21d | 1 | 1.41mi |
| 1150 Cross Creek Cir Greenville, NC | 2.0 | 2.0 | 1100 | $1,200 | $1.09 | 21d | 1 | 1.42mi |
| 301 Maple St Greenville, NC | 3.0 | 2.0 | 1230 | $1,800 | $1.46 | 21d | 1 | 1.47mi |
| 206 Hudson St Greenville, NC | 2.0 | 1.0 | 1150 | $900 | $0.78 | 21d | 1 | 1.47mi |
| 2421 Charles Blvd Greenville, NC | 2.0 | 1.5 | 990 | $935 | $0.94 | 21d | 1 | 1.47mi |
| 1035 Spring Forest Rd Greenville, NC | 3.0 | 2.0–2.5 | 1453 | $1,450 | $1.00 | 21d | 2 | 1.48mi |
| 1001 Park Ave Greenville, NC | 3.0 | 1.0 | 1296 | $1,150 | $0.89 | 21d | 1 | 1.49mi |
| 904 Gabriel Dr Greenville, NC | 1.0–2.0 | 1.0–2.0 | 966 | $1,875 | $1.94 | 21d | 17 | 1.50mi |
Listing history 17 events
-
2026-06-19pricedays on market $144,900 Active 30 DOM
-
2026-06-18days on market $157,200 Active 29 DOM
-
2026-06-17days on market $157,200 Active 28 DOM
-
2026-06-16days on market $157,200 Active 27 DOM
-
2026-06-15days on market $157,200 Active 26 DOM
-
2026-06-13days on market $157,200 Active 23 DOM
-
2026-06-10days on market $157,200 Active 21 DOM
-
2026-06-09days on market $157,200 Active 20 DOM
-
2026-06-08days on market $157,200 Active 19 DOM
-
2026-06-07days on market $157,200 Active 18 DOM
-
2026-06-05days on market $157,200 Active 15 DOM
-
2026-06-03days on market $157,200 Active 14 DOM
-
2026-06-02days on market $157,200 Active 13 DOM
-
2026-06-01days on market $157,200 Active 12 DOM
-
2026-05-31days on market $157,200 Active 11 DOM
-
2026-05-30days on market $157,200 Active 10 DOM
-
2026-05-20$157,200 Active
ⓘ Source: listings_history table (triggers on properties + properties_extension) + one-shot
backfill from property_details.listing_events for pre-trigger history.
Tax reassessment forecast NC · Resets to sale price
- Current annual tax
- $473 · $39/mo
- Projected year-2 tax
- $1,188 · $99/mo
- Expected delta
- +$715/yr (+$60/mo · 151.2%)
ⓘ Screening estimate from a state-policy table — verify with the county assessor before closing.
Climate risk First Street
- Flood 1/10 Low FEMA zone X (unshaded) · 0% chance over 30 yrs
- Wildfire 1/10 Low
- Heat 8/10 Severe 7 d/yr ≥106°F today · 17 d/yr by 30 yrs out
- Wind 8/10 Severe 80% chance of damaging wind over 30 yrs
- Air quality 3/10 Moderate 3 unhealthy d/yr today · 3 by 30 yrs out
Nearby sold comps map
Loading sold comps map…
Walkable amenities ~0.75 mi
Loading nearby amenities…
Taxation est. · year 1
- Rental income
- $14,941
- − Mortgage interest
- −$8,117
- − Property taxes
- −$473
- − Insurance
- −$724
- − Repairs & maintenance
- −$1,195
- − Management
- −$1,195
- − Depreciation
- −$4,215
- Taxable loss
- −$979
- Est. tax savings @ 24.0%
- +$235
- After-tax cash flow
- $1,722/yr
For passive investors: Depreciation is non-cash, so a rental often shows a tax loss while cash-flowing — sheltering income. Rental losses are passive: they offset passive income freely, and up to $25,000/yr can offset ordinary (W-2) income if you actively participate and your MAGI is under $100k (phasing out to $0 by $150k); unused losses carry forward. On sale, claimed depreciation is recaptured at up to 25%, and gains may owe capital-gains tax (a 1031 exchange can defer both). Figures are a year-1 estimate at your 24.0% rate — not tax advice; consult a CPA.
Schools (NCES district)
- District
- Pitt County Schools
- NCES district ID
- 3700012
- Math proficiency
- 41% ▬ 0.00%
- Reading proficiency
- 44% ▲ 2.00%
- Median HH income
- $40,631
- Composite
- 35.67/100
- National rank
- #4877
- State rank
- #100 of 178 in NC
Livability — Greenville
- Score
- 77/100
- State rank
- #30
- US rank
- #2977
Category grades
Schools grade is shown separately in the Schools card above.
Census & demographics
- Census place
- Greenville, NC
- County
- Pitt County · 142,592 people
- City population
- 115,121
- Metro
- Greenville, NC
- Population (ZIP)
- 56,347
- Household income
- $48,935
- Rent vs Own
- Severe rent burden
- 3319.0
Population outlook (Pitt County) Hauer SSP2
- Today (2025)
- 194,585 people
- By 2030
- 203,756 · +4.7%
- By 2040
- 220,807 · +13.5%
- By 2050
- 236,614 · +21.6%
- By 2075
- 275,940 · +41.8%
- By 2100
- 300,058 · +54.2%
Race, ethnicity, and origin ACS 2023
- Neighborhood character
- Diverse neighborhood (Simpson 0.59)
- Race & ethnicity
- Black 54% White 33% Hispanic / Latino 8% Two or more races 3% Asian 2%
- Hispanic origin (detail)
- Mexican 7%
- Common ancestry
- Lithuanian 1% Slovak 1% Romanian 1%
- Foreign-born
- 7% · Canada, China
- Languages at home
- 91% English-only · Spanish 6% Other Asian/Pacific 1%
Political lean MEDSL · Pitt
- 2024 margin
- Lean D (+6.0) · D 52.5% · R 46.5% · Other 1.1%
- 2008→2024 swing
- -2.8pp toward R · 2008: 8.8pp · 2024: 6.0pp
- All cycles
- 2024: D+6.0 2020: D+9.4 2016: D+7.4 2012: D+6.7 2008: D+8.8
Not yet ingested
- Civics
- —
Market trends
- HPI YoY
- ▼ -187.99%
- Current HPI
- 190.6869
- Rent YoY
- ▲ 5.44%
- Metro
- Greenville, NC
- State GDP YoY
- ▲ 3.28%
- F500 in state
- 26
Industry mix (Fortune 500 HQ in NC)
| Industry | F500 HQs | Revenue |
|---|---|---|
| Financial Services | 2 | $213B |
|
||
| Retail | 2 | $95B |
|
||
| Industrial Conglomerate | 1 | $38B |
|
||
| Metals / Steel | 1 | $35B |
|
||
| Utilities | 1 | $30B |
|
||
| Industrial Machinery | 1 | $19B |
|
||
Price history
1 event — show timeline
- 2026-05-20 Listed $157,200 Hive MLS
Property tax history
+4.1%/yrLatest (2025): $473 · +2.6% YoY. Source: county tax records.
Cash-flow waterfall
monthlySold comps — $/sqft
last 12 mo · ≤1 miLoading sold comps…