4805 Cushman Rd NE #15 · Olympia, WA
Flood risk 1/10 · Minimal
- FEMA flood zone
- X (unshaded)
- Chance of flooding over 30 yrs
- 0.0%
- Est. flood insurance / yr
- $507 – $1,088
Fire risk 2/10 · Minimal
- Est. fire insurance / yr
- $604 – $1,122
Heat risk 3/10 · Minor
- Hot days now (above 89°F)
- 7 days/yr
- Hot days in 30 yrs
- 14 days/yr
Wind risk 1/10 · Minimal
- Chance of severe wind over 30 yrs
- —
Air-quality risk 6/10 · Moderate
- Unhealthy air days now
- 6 days/yr
- Unhealthy air days in 30 yrs
- 7 days/yr
Risk factors via First Street. Map © Google.
Why this score? — see what drove the C- grade
The composite is a weighted blend of 9 inputs, each scored 0–100. Each bar is that input's sub-score; the figure is the points it added to the 100-point composite (weight × sub-score).
- Cash flow +20.3/30.0
- ARV discount +7.5/15.0
- DSCR +6.4/10.0
- Schools +6.2/10.0
- Livability +4.2/5.0
- 1% rule +4.1/10.0
- Rent growth +3.4/5.0
- Condition / age +2.5/5.0
- Appreciation +0.0/10.0
$190,000
🖨 Deal sheet 📄 Offer letter ✓ Due diligence
Listing remarks
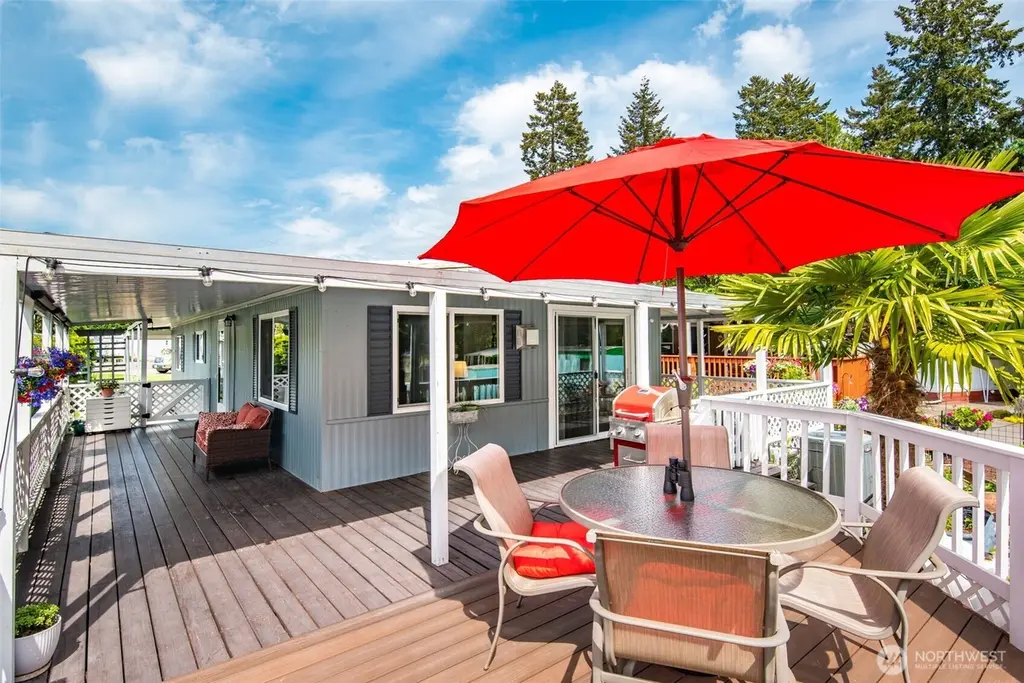
Experience the PNW coastal lifestyle from this beautifully updated home in the 55+ Seashore Villa waterfront community, where the expansive deck becomes your private retreat for enjoying Puget Sound views, morning coffee, colorful sunsets & the beauty of the surrounding shoreline & towering evergreens. Home features fresh int/ext paint, laminate flooring, double-paned vinyl windows & abundant natural light. Beautifully updated kitchen w/ SS appliances, solid surface counters, shaker-style cabinetry & propane range—perfect for entertaining. The open living & dining areas feel warm & inviting w/ a cozy propane stove, while the heat pump provides effic
Key facts
- Ss appliances
- Updated kitchen
- Puget sound views
Tags
Property features AI
Finance
- Other: Senior exemption applies
- Financial info: Land lease: $997; Listing terms: Cash or Conventional
- HOA & community: Located in Seashore Villa (senior community); Park amenities include BBQs, clubhouse, common area, community waterfront/private beach, pool, recreational area, RV parking, trails, high-speed internet available
Exterior
- Parking: Carport
- Utilities: Community water; Community septic; Power provided by PSE; Electric and propane energy sources; Cable: Comcast; Internet: Xfinity
- Home design: Manufactured double-wide home (Model 52/20); One story; Updated/remodeled condition; Faces west; Has view; Mobile home remains on site; Metal skirt
- Construction: Construction materials: metal/vinyl, wood, other
- Exterior features: Metal/vinyl and wood exterior; Awnings; Landscaped; Patio/porch/deck; Walk-in closet (home interior feature listed with exterior group); Paved lot
Interior
- Kitchen: Dishwasher; Microwave; Refrigerator; Stove/Range
- Bedrooms: 2 bedrooms
- Flooring: Laminate; Vinyl plank; Carpet
- Bathrooms: 1 full bath; 1 three-quarter bath; 1 bathtub; 2 showers
- Heating & cooling: Forced air heating; Heat pump for heating and cooling
- Interior features: Fireplace (1) with details noted in remarks; Water heater (electric, located in exterior closet)
- Laundry & utility: Washer; Dryer
Neighborhood map
What this means for you Summary
Snapshot
- This is a 2-bed/2.0-bath manufactured listed at $190k.
Deal economics
- At list price, monthly cash flow is $242 ($3k/yr) — positive.
- The deal already cash-flows at list — no discount required.
- To meet the 1% rule (rent ≥ 1% of price), the offer needs to be $173k (8.9% below list).
- Recommended offer: $173k (8.9% below list) — sets the bar for 1% rule.
- Cap rate 7.8% vs local median 2.4% in Olympia — top-decile yield for the area; either an underpriced asset or a hidden risk that comps aren't pricing in. Stress-test before assuming the spread holds.
Location & tenants
- Location reads 83/100 on livability (#58 in WA, #1,036 nationally) — a professional / high-income tenant draw. Strengths: amenities A+, commute A+, health & safety A+; Watch: crime F, cost of living D-.
- Olympia School District (urban): math 66% / reading 75% proficiency, ranked #17 of 291 in WA (top 6%) — strong family-tenant draw, lease renewals of 3-5y typical.
- Market conditions: Rents rising (+3.7%/yr); 150 active listings in the ZIP; solid renter incomes; 1,222 units permitted in Thurston County in 2024 (508 in 5+ unit buildings).
Forward outlook
- Local home prices are declining (-3.0%/yr); year-one equity from $1k of loan paydown is wiped out by about $6k of value loss. Plan a longer hold.
- Thurston County population projected at +27% by 2050 — long-run rental-demand tailwind backs the buy-and-hold thesis.
Negotiation context
- It's been on market 30 days — a 2% lower offer ($187k) is reasonable based on typical stale-listing flexibility.
- 6 sale attempts since 20y ago with the ask held roughly flat each time — persistent listings suggest the price (not the market) is what's stuck; bring a comps-based counter.
Questions for the listing agent
- Built in 1972 — when were the roof, HVAC, electrical panel, plumbing, and water heater last replaced?
- Is there a deadline driving the sale (1031 exchange, divorce, estate, relocation)? That informs how much negotiation room exists.
- Schools are A-rated — typically a magnet for longer-tenancy family renters. What's the average tenant stay here, and is there a school-zone premium baked into asking?
- Crime grade is F in this area — have there been break-ins, vandalism, or insurance claims at this property in the last 3 years? What carrier currently insures it and at what premium?
- What's the average days-on-market for RENTAL listings here right now (not sales)? A rising rental-DOM trend means longer vacancies and softer asking-rent achievability than the comps imply.
- What's the recent tenant-quality profile in this submarket — average credit score on applications, eviction rate, late-payment / NSF rate, and stable-employment percentage? A property-management company in the area should have these aggregated.
- How much new for-sale + rental construction is in the pipeline within 1–3 miles? Heavy new supply typically softens prices + rents 12–24 months out; constrained supply supports both.
Investment metrics
- 1% rule
- 0.91% ✗
- Cap rate
- 7.82%
- Cash-on-cash
- 5.46%
- DSCR
- 1.24
- GRM
- 9.2
CMA / ARV
- ARV (on-the-fly)
- $93,024
- Comps found
- 1
Show comp detail 1 sale within ~0.75 mi
| Address | Dist | Beds/Ba | Sqft | Sold | Price | $/sf | Match |
|---|---|---|---|---|---|---|---|
| 4806 Cushman Rd NE #106 | 0.14mi | 2/1.0 | 972 (+7%) | 2mo | $99,000 | $102 | 77 |
Match score weights: distance 35% · size 25% · config 20% · recency 20%. Top-matched comps best support the ARV.
Projected returns pro-forma
-3.0% appreciation · 3.66% rent growth · sell at horizon
- IRR
- -7.2%
- Equity multiple
- 0.73×
- Total profit
- $-14,312
- Equity at exit
- $28,330
- IRR
- 3.0%
- Equity multiple
- 1.22×
- Total profit
- $11,825
- Equity at exit
- $16,428
Cash invested: $53,200 (down + closing). Projections, not guarantees.
Landlord ↔ Tenant lean methodology
- Overall (STATE)
- 28 Tenant-Leaning
- State Washington
- 28 Tenant-Leaning · D+8
- County
- — inherits STATE
- City
- — inherits STATE
ZIP-level market 98506
- Rents YoY
- 3.7%
- Active inventory
- 150
- Price-to-rent
- 9.2×
Monthly cashflow live
- Estimated rent
- $1,730 medium interval (Pro) →
- Mortgage (P&I)
- −$996
- Tax from tax record
- −$49 /mo · $592/yr
- Insurance
- −$79
- HOA
- −$0
- Vacancy / Maint / Mgmt
- −$363
- Net cashflow
- $242
Break-even live
UW: 25.0% down · 7.5% · 30yr · 1.5% tax · 5.0% vac · 8.0% maint · 8.0% mgmt
Financing live
Cash to close
- Down payment
- $47,500
- Closing costs
- $5,700
- Reserves months
- —
- Total cash needed
- —
Loan-product check · same deal, 3 products live
Conventional
25% down · 7.5% · 30yr
- Down + closing
- —
- Monthly P&I
- —
- Monthly cashflow
- —
- DSCR
- —
- Eligible?
- —
Personal DTI + credit; lowest rate.
DSCR
20% down · 8.5% · 30yr
- Down + closing
- —
- Monthly P&I
- —
- Monthly cashflow
- —
- DSCR
- —
- Eligible?
- —
No personal income docs; deal must DSCR.
Hard money
10% down · 12.0% · 12mo
- Down + closing
- —
- Monthly P&I
- —
- Monthly cashflow
- —
- DSCR
- —
- Eligible?
- —
Short-term bridge; refi at stabilization.
Listing history 29 events
-
2026-06-18days on market $190,000 Active 30 DOM
-
2026-06-17days on market $190,000 Active 29 DOM
-
2026-06-16days on market $190,000 Active 28 DOM
-
2026-06-15days on market $190,000 Active 27 DOM
-
2026-06-14days on market $190,000 Active 25 DOM
-
2026-06-13days on market $190,000 Active 24 DOM
-
2026-06-10days on market $190,000 Active 22 DOM
-
2026-06-09days on market $190,000 Active 21 DOM
-
2026-06-08days on market $190,000 Active 20 DOM
-
2026-06-07days on market $190,000 Active 19 DOM
-
2026-06-05days on market $190,000 Active 16 DOM
-
2026-06-02days on market $190,000 Active 14 DOM
-
2026-06-01days on market $190,000 Active 13 DOM
-
2026-05-31days on market $190,000 Active 12 DOM
-
2026-05-30days on market $190,000 Active 11 DOM
-
2026-05-19$190,000 Active
-
2022-04-18soldstatus $180,000 Closed
-
2022-04-11status Pending
-
2022-04-05status Active
-
2022-04-02status Pending
-
2022-03-30$139,900 Active
-
2013-12-13historical
-
2013-12-13soldstatus $12,500 Sold
-
2013-11-15status Pending Inspection
-
2013-10-21$13,500 Active
-
2007-07-13soldstatus $44,000
-
2007-02-07$46,500
-
2006-05-15soldstatus $41,500
-
2006-03-10$41,500
ⓘ Source: listings_history table (triggers on properties + properties_extension) + one-shot
backfill from property_details.listing_events for pre-trigger history.
Tax reassessment forecast WA · Resets to sale price
- Current annual tax
- $592 · $49/mo
- Projected year-2 tax
- $1,862 · $155/mo
- Expected delta
- +$1,270/yr (+$106/mo · 214.7%)
ⓘ Screening estimate from a state-policy table — verify with the county assessor before closing.
Climate risk First Street
- Flood 1/10 Low FEMA zone X (unshaded) · 0% chance over 30 yrs
- Wildfire 2/10 Low
- Heat 3/10 Moderate 7 d/yr ≥89°F today · 14 d/yr by 30 yrs out
- Wind 1/10 Low
- Air quality 6/10 Major 6 unhealthy d/yr today · 7 by 30 yrs out
Nearby sold comps map
Loading sold comps map…
Walkable amenities ~0.75 mi
Loading nearby amenities…
Taxation est. · year 1
- Rental income
- $20,761
- − Mortgage interest
- −$10,643
- − Property taxes
- −$592
- − Insurance
- −$950
- − Repairs & maintenance
- −$1,661
- − Management
- −$1,661
- − Depreciation
- −$5,527
- Taxable loss
- −$272
- Est. tax savings @ 24.0%
- +$65
- After-tax cash flow
- $2,969/yr
For passive investors: Depreciation is non-cash, so a rental often shows a tax loss while cash-flowing — sheltering income. Rental losses are passive: they offset passive income freely, and up to $25,000/yr can offset ordinary (W-2) income if you actively participate and your MAGI is under $100k (phasing out to $0 by $150k); unused losses carry forward. On sale, claimed depreciation is recaptured at up to 25%, and gains may owe capital-gains tax (a 1031 exchange can defer both). Figures are a year-1 estimate at your 24.0% rate — not tax advice; consult a CPA.
Schools (NCES district)
- District
- Olympia School District
- NCES district ID
- 5306180
- Math proficiency
- 66% ▼ -2.00%
- Reading proficiency
- 75% ▼ -2.00%
- Median HH income
- $63,852
- Composite
- 62.27/100
- National rank
- #1438
- State rank
- #17 of 291 in WA
Livability — Olympia
- Score
- 83/100
- State rank
- #58
- US rank
- #1036
Category grades
Schools grade is shown separately in the Schools card above.
Census & demographics
- County
- Thurston County · 269,345 people
- City population
- 98,428
- Metro
- Olympia-Lacey-Tumwater, WA
- Population (ZIP)
- 18,497
- Household income
- $91,596
- Rent vs Own
- Severe rent burden
- 924.0
Population outlook (Thurston County) Hauer SSP2
- Today (2025)
- 308,239 people
- By 2030
- 326,483 · +5.9%
- By 2040
- 359,890 · +16.8%
- By 2050
- 391,800 · +27.1%
- By 2075
- 468,024 · +51.8%
- By 2100
- 519,890 · +68.7%
Race, ethnicity, and origin ACS 2023
- Neighborhood character
- Predominantly White (81%)
- Race & ethnicity
- White 81% Two or more races 9% Hispanic / Latino 5% Asian 5% Black 1%
- Hispanic origin (detail)
- Mexican 3%
- Common ancestry
- Portuguese 5% Italian 4% Romanian 4%
- Foreign-born
- 8% · Canada, Vietnam, China
- Languages at home
- 89% English-only · Spanish 2% German/W. Germanic 1% Vietnamese 1%
Political lean MEDSL · Thurston
- 2024 margin
- Strong D (+20.4) · D 58.5% · R 38.1% · Other 3.5%
- 2008→2024 swing
- -1.3pp toward R · 2008: 21.7pp · 2024: 20.4pp
- All cycles
- 2024: D+20.4 2020: D+18.6 2016: D+15.4 2012: D+19.0 2008: D+21.7
Not yet ingested
- Civics
- —
Market trends
- HPI YoY
- ▼ -437.08%
- Current HPI
- 363.2295
- Rent YoY
- ▲ 3.66%
- Metro
- Olympia-Lacey-Tumwater, WA
- State GDP YoY
- ▲ 4.65%
- F500 in state
- 22
Industry mix (Fortune 500 HQ in WA)
| Industry | F500 HQs | Revenue |
|---|---|---|
| Retail | 2 | $269B |
|
||
| Technology / Retail | 1 | $638B |
|
||
| Technology | 1 | $245B |
|
||
| Telecommunications | 1 | $38B |
|
||
| Food / Beverage | 1 | $36B |
|
||
| Automotive / Trucks | 1 | $34B |
|
||
Price history
+357.8% since first listed14 events — show timeline
- 2026-05-19 Listed $190,000 NWMLS as Distributed by MLS Grid
- 2022-04-18 Sold (MLS) $180,000 NWMLS as Distributed by MLS Grid
- 2022-04-11 Pending — NWMLS as Distributed by MLS Grid
- 2022-04-05 Relisted — NWMLS as Distributed by MLS Grid
- 2022-04-02 Pending — NWMLS as Distributed by MLS Grid
- 2022-03-30 Listed $139,900 NWMLS as Distributed by MLS Grid
- 2013-12-13 Delisted — NWMLS as Distributed by MLS Grid
- 2013-12-13 Sold (MLS) $12,500 NWMLS as Distributed by MLS Grid
- 2013-11-15 Pending — NWMLS as Distributed by MLS Grid
- 2013-10-21 Listed $13,500 NWMLS as Distributed by MLS Grid
- 2007-07-13 Sold (MLS) $44,000 NWMLS as Distributed by MLS Grid
- 2007-02-07 Listed $46,500 NWMLS as Distributed by MLS Grid
- 2006-05-15 Sold (MLS) $41,500 NWMLS as Distributed by MLS Grid
- 2006-03-10 Listed $41,500 NWMLS as Distributed by MLS Grid
Property tax history
+1.8%/yrLatest (2024): $592 · +2.8% YoY. Source: county tax records.
Cash-flow waterfall
monthlySold comps — $/sqft
last 12 mo · ≤1 miLoading sold comps…