 Multi-family
10920-10928 Malati St · Moon Lake, FL
Flood risk 1/10 · Minimal
- FEMA flood zone
- X (unshaded)
- Chance of flooding over 30 yrs
- 0.0%
- Est. flood insurance / yr
- $507 – $1,088
Fire risk 5/10 · Moderate
- Est. fire insurance / yr
- $947 – $1,759
Heat risk 10/10 · Severe
- Hot days now (above 108°F)
- 6 days/yr
- Hot days in 30 yrs
- 23 days/yr
Wind risk 10/10 · Severe
- Chance of severe wind over 30 yrs
- 99.0%
Air-quality risk 2/10 · Minimal
- Unhealthy air days now
- 1 days/yr
- Unhealthy air days in 30 yrs
- 3 days/yr
Risk factors via First Street. Map © Google.
Why this score? — see what drove the B- grade
The composite is a weighted blend of 9 inputs, each scored 0–100. Each bar is that input's sub-score; the figure is the points it added to the 100-point composite (weight × sub-score).
- Cash flow +30.0/30.0
- 1% rule +10.0/10.0
- DSCR +10.0/10.0
- ARV discount +7.5/15.0
- Schools +4.3/10.0
- Livability +2.8/5.0
- Condition / age +2.5/5.0
- Rent growth +2.0/5.0
- Appreciation +0.0/10.0
$304,900
🖨 Deal sheet 📄 Offer letter ✓ Due diligence
Multi-family units
County records classify this as Multi-Family (2-4 Unit). Listing-text estimate: 1 unit. estimate disagrees with records
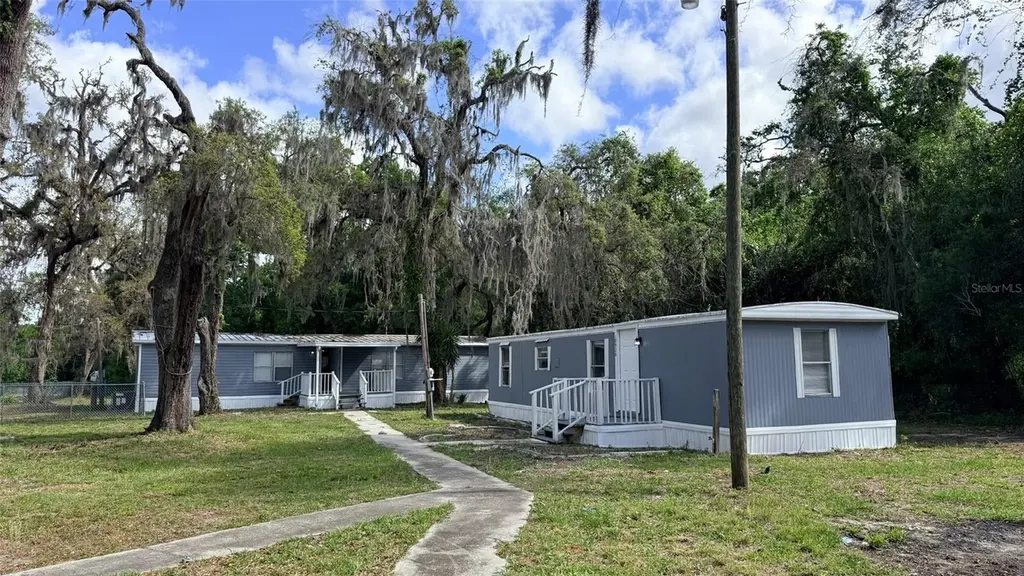
Listing remarks
AMAZING cashflow opportunity!! Two manufactured homes in one oversized lot, with a spacious double-wide 3/2 and a renovated single-wide 2/1, offering incredible flexibility for multi-generational living, rental income, guest use, or investment. Both homes have been fully renovated with new appliances, renovated kitchens and bathrooms, updated flooring, fresh finishes, modern cabinetry, and stone countertops. The double-wide includes a new central HVAC system, while the single-wide features new split A/C units. The large fenced lot provides plenty of space for RVs, boats, trailers, work vehicles, entertaining, or expansion, all with no HOA restrictions or fees!! Even better, the property off
Key facts
- Renovated kitchens
- Renovated bathrooms
- New appliances
Tags
Property features AI
Finance
- HOA & community: No association
Exterior
- Utilities: Well water; Septic tank; Electricity connected; Water connected
- Home design: Manufactured double-wide home; Single-story; Faces west
- Construction: Metal frame construction; Metal roof; Crawlspace foundation; Built as a manufactured home
- Exterior features: Other exterior features
Interior
- Kitchen: Dishwasher; Microwave; Range; Refrigerator
- Bedrooms: 5 bedrooms
- Bathrooms: 3 full bathrooms
- Heating & cooling: Central heating (electric); Central air conditioning
- Interior features: Kitchen open to family room; Stone countertops; Thermostat
- Laundry & utility: Washer hookup; Electric dryer hookup
Neighborhood map
What this means for you Summary
Snapshot
- This is a 5-bed/3.0-bath multifamily listed at $305k.
Deal economics
- At list price, monthly cash flow is $5k ($57k/yr) — positive.
- The deal already cash-flows at list — no discount required.
- Meets the 1% rule at list price ($9k rent vs $305k).
- Recommended offer: $296k (3.0% below list) — sets the bar for market timing.
- Cap rate 24.8% vs local median 4.4% in Moon Lake — top-decile yield for the area; either an underpriced asset or a hidden risk that comps aren't pricing in. Stress-test before assuming the spread holds.
Location & tenants
- Location reads 56/100 on livability (#871 in FL) — a working-class tenant base; expect higher turnover. Strengths: cost of living A+, housing A+; Watch: schools F, amenities F, commute F.
- Pasco (suburban): math 50% / reading 52% proficiency, ranked #32 of 73 in FL (top 44%) — acceptable for families but not a draw, mixed tenant base, ~2y average lease.
- Market conditions: Rents soft (-1.9%/yr); 353 active listings in the ZIP; 1 comparable units currently listed for rent nearby; 6,765 units permitted in Pasco County in 2024 (1,250 in 5+ unit buildings).
- At $8,628/mo this rent would consume 140% of the median local household income ($74k/yr) (locally 179% of renters already pay >50% of income on rent) — very limited rent-growth headroom before tenants either downsize or default.
Forward outlook
- Local home prices are declining (-3.0%/yr); year-one equity from $2k of loan paydown is wiped out by about $9k of value loss. Plan a longer hold.
- Pasco County population projected at +29% by 2050 — long-run rental-demand tailwind backs the buy-and-hold thesis.
- At projected returns (-3.0% appreciation + 0.0% rent growth), your $85k cash investment doubles in ~2 years — after that, you're playing with house money.
Negotiation context
- It's been on market 60 days — a 3% lower offer ($296k) is reasonable based on typical stale-listing flexibility.
- 3 sale attempts since 20y ago with the ask held roughly flat each time — persistent listings suggest the price (not the market) is what's stuck; bring a comps-based counter.
Risks & watch-outs
- Climate carrying-cost: severe wind risk, 99% chance of damaging wind over 30y; moderate wildfire risk; extreme-heat days projected 6→23/yr by 2055 (HVAC capex compounding) — expect insurance premiums to compound above CPI over the hold.
Questions for the listing agent
- It's been on market 60 days. Have you received any prior offers? Is the seller open to a 3% concession, seller financing, or rate buy-down credit?
- Is there a deadline driving the sale (1031 exchange, divorce, estate, relocation)? That informs how much negotiation room exists.
- Schools are F-rated, which usually means shorter tenancies and higher turnover. Who's the typical renter profile here, and what's been the actual vacancy rate?
- What's the average days-on-market for RENTAL listings here right now (not sales)? A rising rental-DOM trend means longer vacancies and softer asking-rent achievability than the comps imply.
- What's the recent tenant-quality profile in this submarket — average credit score on applications, eviction rate, late-payment / NSF rate, and stable-employment percentage? A property-management company in the area should have these aggregated.
- How much new apartment / multifamily construction is in the pipeline within 1–3 miles? Heavy new supply (>2% of stock underway) typically softens rents 12–24 months out; light construction supports rent growth.
Investment metrics
- 1% rule
- 2.83% ✓
- Cap rate
- 24.83%
- Cash-on-cash
- 66.19%
- DSCR
- 3.95
- GRM
- 2.9
CMA / ARV
No comps found within radius.
Projected returns pro-forma
-3.0% appreciation · 0.0% rent growth · sell at horizon
- IRR
- 62.0%
- Equity multiple
- 3.64×
- Total profit
- $225,358
- Equity at exit
- $45,462
- IRR
- 65.6%
- Equity multiple
- 6.68×
- Total profit
- $485,244
- Equity at exit
- $26,362
Cash invested: $85,372 (down + closing). Projections, not guarantees.
Landlord ↔ Tenant lean methodology
- Overall (STATE)
- 87 Strongly Landlord-Friendly
- State Florida
- 87 Strongly Landlord-Friendly · R+3
- County
- — inherits STATE
- City
- — inherits STATE
ZIP-level market 34654
- Home prices YoY
- -12.7%
- Rents YoY
- -1.9%
- Active inventory
- 353
- Price-to-rent
- 14.7×
Monthly cashflow live
- Estimated rent
- $8,628 medium interval (Pro) →
- Mortgage (P&I)
- −$1,599
- Tax est. 1.5%
- −$381 /mo · $4,574/yr
- Insurance
- −$127
- HOA
- −$0
- Vacancy / Maint / Mgmt
- −$1,812
- Net cashflow
- $4,709
Break-even live
5-unit breakdown (identical units grouped — click to expand)
| Units | Beds | Baths | Est. rent |
|---|---|---|---|
| 5× units | 3 | 2 | $8,630 |
| #1 | 3 | 2 | $1,726 |
| #2 | 3 | 2 | $1,726 |
| #3 | 3 | 2 | $1,726 |
| #4 | 3 | 2 | $1,726 |
| #5 | 3 | 2 | $1,726 |
| Total (5 units) | $8,628 | ||
UW: 25.0% down · 7.5% · 30yr · 1.5% tax · 5.0% vac · 8.0% maint · 8.0% mgmt
Financing live
Cash to close
- Down payment
- $76,225
- Closing costs
- $9,147
- Reserves months
- —
- Total cash needed
- —
Loan-product check · same deal, 3 products live
Conventional
25% down · 7.5% · 30yr
- Down + closing
- —
- Monthly P&I
- —
- Monthly cashflow
- —
- DSCR
- —
- Eligible?
- —
Personal DTI + credit; lowest rate.
DSCR
20% down · 8.5% · 30yr
- Down + closing
- —
- Monthly P&I
- —
- Monthly cashflow
- —
- DSCR
- —
- Eligible?
- —
No personal income docs; deal must DSCR.
Hard money
10% down · 12.0% · 12mo
- Down + closing
- —
- Monthly P&I
- —
- Monthly cashflow
- —
- DSCR
- —
- Eligible?
- —
Short-term bridge; refi at stabilization.
Rent comps 1 comps
| Address | Beds | Baths | Sqft | Rent | $/sqft | DOM | Units | Dist |
|---|---|---|---|---|---|---|---|---|
| 12130 Infinity Dr New Port Richey, FL | 4.0 | 2.0 | 1968 | $2,000 | $1.02 | 2d | 1 | 1.38mi |
Listing history 18 events
-
2026-06-18days on market $304,900 Active 60 DOM
-
2026-06-17days on market $304,900 Active 59 DOM
-
2026-06-16days on market $304,900 Active 58 DOM
-
2026-06-15days on market $304,900 Active 57 DOM
-
2026-06-13days on market $304,900 Active 55 DOM
-
2026-06-09days on market $304,900 Active 51 DOM
-
2026-06-08days on market $304,900 Active 50 DOM
-
2026-06-07days on market $304,900 Active 49 DOM
-
2026-06-04days on market $304,900 Active 46 DOM
-
2026-06-03days on market $304,900 Active 45 DOM
-
2026-06-02days on market $304,900 Active 44 DOM
-
2026-06-01days on market $304,900 Active 43 DOM
-
2026-05-31days on market $304,900 Active 42 DOM
-
2026-05-12price $304,900
-
2026-04-30price $305,000
-
2026-04-19$310,000 Active
-
2006-06-08$184,900
-
2006-04-03$184,900
ⓘ Source: listings_history table (triggers on properties + properties_extension) + one-shot
backfill from property_details.listing_events for pre-trigger history.
Climate risk First Street
- Flood 1/10 Low FEMA zone X (unshaded) · 0% chance over 30 yrs
- Wildfire 5/10 Major
- Heat 10/10 Extreme 6 d/yr ≥108°F today · 23 d/yr by 30 yrs out
- Wind 10/10 Extreme 99% chance of damaging wind over 30 yrs
- Air quality 2/10 Low 1 unhealthy d/yr today · 3 by 30 yrs out
Nearby sold comps map
Loading sold comps map…
Walkable amenities ~0.75 mi
Loading nearby amenities…
Taxation est. · year 1
- Rental income
- $103,536
- − Mortgage interest
- −$17,079
- − Property taxes
- −$4,574
- − Insurance
- −$1,524
- − Repairs & maintenance
- −$8,283
- − Management
- −$8,283
- − Depreciation
- −$8,870
- Taxable income
- $54,923
- Est. tax owed @ 24.0%
- −$13,182
- After-tax cash flow
- $43,327/yr
For passive investors: Depreciation is non-cash, so a rental often shows a tax loss while cash-flowing — sheltering income. Rental losses are passive: they offset passive income freely, and up to $25,000/yr can offset ordinary (W-2) income if you actively participate and your MAGI is under $100k (phasing out to $0 by $150k); unused losses carry forward. On sale, claimed depreciation is recaptured at up to 25%, and gains may owe capital-gains tax (a 1031 exchange can defer both). Figures are a year-1 estimate at your 24.0% rate — not tax advice; consult a CPA.
Schools (NCES district)
- District
- Pasco
- NCES district ID
- 1201530
- Math proficiency
- 50% ▼ -10.00%
- Reading proficiency
- 52% ▼ -5.00%
- Median HH income
- $45,039
- Composite
- 43.14/100
- National rank
- #3074
- State rank
- #32 of 73 in FL
Livability — Moon Lake
- Score
- 56/100
- State rank
- #871
- US rank
- #22850
Category grades
Schools grade is shown separately in the Schools card above.
Census & demographics
- Census place
- Moon Lake, FL
- County
- Pasco County · 524,098 people
- Metro
- Tampa-St. Petersburg-Clearwater, FL
- Population (ZIP)
- 24,355
- Household income
- $73,947
- Rent vs Own
- Severe rent burden
- 179.0
Population outlook (Pasco County) Hauer SSP2
- Today (2025)
- 570,045 people
- By 2030
- 605,844 · +6.3%
- By 2040
- 674,806 · +18.4%
- By 2050
- 736,022 · +29.1%
- By 2075
- 862,900 · +51.4%
- By 2100
- 906,364 · +59.0%
Race, ethnicity, and origin ACS 2023
- Neighborhood character
- Predominantly White (81%)
- Race & ethnicity
- White 81% Hispanic / Latino 10% Two or more races 7% Black 3% Asian 2%
- Hispanic origin (detail)
- Puerto Rican 6%
- Common ancestry
- Romanian 4% Slovak 2% Italian 2%
- Foreign-born
- 7% · Canada, China, Jamaica
- Languages at home
- 88% English-only · Spanish 5% Russian/Polish/Slavic 2% Other Indo-European 1%
Political lean MEDSL · Pasco
- 2024 margin
- Strong R (+25.2) · D 36.9% · R 62.1% · Other 1.0%
- 2008→2024 swing
- -21.6pp toward R · 2008: -3.6pp · 2024: -25.2pp
- All cycles
- 2024: R+25.2 2020: R+20.1 2016: R+21.6 2012: R+6.7 2008: R+3.6
Not yet ingested
- Civics
- —
Market trends
- HPI YoY
- ▼ -42.63%
- Current HPI
- 294.4358
- Rent YoY
- ▼ -1.85%
- Metro
- Tampa-St. Petersburg-Clearwater, FL
- State GDP YoY
- ▲ 3.28%
- F500 in state
- 36
Industry mix (Fortune 500 HQ in FL)
| Industry | F500 HQs | Revenue |
|---|---|---|
| Industrial Technology | 2 | $29B |
|
||
| Insurance | 2 | $17B |
|
||
| Retail | 1 | $60B |
|
||
| Technology Distribution | 1 | $58B |
|
||
| Homebuilding | 1 | $35B |
|
||
| Technology Manufacturing | 1 | $35B |
|
||
Price history
+64.9% since first listed5 events — show timeline
- 2026-05-12 Price Changed $304,900 Stellar MLS as Distributed by MLS Grid
- 2026-04-30 Price Changed $305,000 Stellar MLS as Distributed by MLS Grid
- 2026-04-19 Listed $310,000 Stellar MLS as Distributed by MLS Grid
- 2006-06-08 Listed $184,900 Stellar MLS as Distributed by MLS Grid
- 2006-04-03 Listed $184,900 Stellar MLS as Distributed by MLS Grid
Cash-flow waterfall
monthlySold comps — $/sqft
last 12 mo · ≤1 miLoading sold comps…