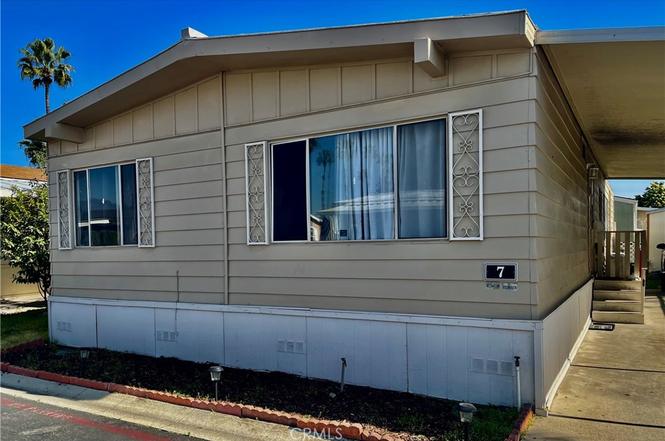
2139 4th St #7 · Ontario, CA
Flood risk 6/10 · Moderate
- FEMA flood zone
- X (shaded)
- Chance of flooding over 30 yrs
- 0.69%
- Est. flood insurance / yr
- $507 – $1,088
Fire risk 2/10 · Minimal
- Est. fire insurance / yr
- $659 – $1,223
Heat risk 7/10 · Major
- Hot days now (above 100°F)
- 6 days/yr
- Hot days in 30 yrs
- 18 days/yr
Wind risk 1/10 · Minimal
- Chance of severe wind over 30 yrs
- —
Air-quality risk 9/10 · Severe
- Unhealthy air days now
- 23 days/yr
- Unhealthy air days in 30 yrs
- 28 days/yr
Risk factors via First Street. Map © Google.
Why this score? — see what drove the B+ grade
The composite is a weighted blend of 9 inputs, each scored 0–100. Each bar is that input's sub-score; the figure is the points it added to the 100-point composite (weight × sub-score).
- Cash flow +30.0/30.0
- ARV discount +15.0/15.0
- 1% rule +10.0/10.0
- DSCR +10.0/10.0
- Schools +3.3/10.0
- Livability +3.2/5.0
- Condition / age +2.5/5.0
- Rent growth +2.4/5.0
- Appreciation +0.0/10.0
$139,999
🖨 Deal sheet (PDF) 📄 Offer letter ✓ Due diligence
Listing remarks MLS
Discover this 4-bedroom, 2-bathroom mobile home in the Lamplighter Mobile Home Park in Ontario. Featuring an open concept design in your main living spaces. Enjoy the convenience of a Nest thermostat for energy efficiency, while the spacious living and dining areas provide a warm and inviting atmosphere. The primary bedroom offers an en-suite bathroom complete with a separate tub and shower, dual sinks, and plenty of space for your comfort. Each of the additional 3 bedrooms boasts ample size to accommodate your furnishings or the kids toys. Step out the sliding glass door to a covered patio with stamped concrete, complemented by a side yard featuring low-maintenance artificial turf—perfect for outdoor activities. You’ll also love the variety of fruit trees, including apple, peach, guava, and avocado, providing fresh produce right from your yard. With a 2-car covered carport and a large shed for extra storage, this home provides functionality. Enjoy community amenities such as a clubhouse, pool and spa, playground, and RV parking lot.
Key facts
- Community pool
- Built 1973
- Listed 131 days
Property features AI
Finance
- Other: Manager approval required for sale; Located west of Vineyard on 4th St.
- HOA & community: Land lease (approx. $1,265 per month)
Exterior
- Parking: Carport
- Utilities: Public sewer; District/public water
- Home design: Single-story manufactured/mobile home; Mobile home remains; Mobile dimensions approximately 24 ft by 61 ft; Facing direction not specified; Entry level: 1
- Construction: Year built per assessor; Total of 1 story
- Exterior features: Community pool; Sidewalks; Located in Lamplighter park; Lot zoning roughly 0–1 unit per acre
Interior
- Bathrooms: 2 full bathrooms
- Heating & cooling: Central cooling
- Interior features: One level home; Entry on main level; Community spa; Community pool
- Laundry & utility: Inside laundry
Neighborhood map
What this means for you Summary
Snapshot
- This is a 3-bed/2.0-bath manufactured listed at $140k.
Deal economics
- At list price, monthly cash flow is $1k ($18k/yr) — positive.
- The deal already cash-flows at list — no discount required.
- Meets the 1% rule at list price ($3k rent vs $140k).
- Recommended offer: $123k (12.0% below list) — sets the bar for market timing.
- Cap rate 19.0% vs local median 2.7% in Ontario — top-decile yield for the area; either an underpriced asset or a hidden risk that comps aren't pricing in. Stress-test before assuming the spread holds.
Location & tenants
- Location reads 63/100 on livability (#435 in CA) — a middle-class / working-renter tenant base. Strengths: commute A-, housing B+; Watch: schools F, cost of living F, health & safety F.
- Cucamonga Elementary (suburban): math 28% / reading 42% proficiency, ranked #867 of 1,400 in CA (top 62%) — families likely to look elsewhere, expect single-tenant / working-renter base with shorter leases; 60% free/reduced lunch — lower-income household profile, screen leases tightly.
- Market conditions: Rents soft (-0.3%/yr); 77 active listings in the ZIP; 23 comparable units currently listed for rent nearby; rentals leasing fast (median 0d on market — plan ~1-2 weeks tenant-placement turnaround); solid renter incomes; 5,458 units permitted in San Bernardino County in 2024 (1,500 in 5+ unit buildings).
- At $3,094/mo this rent would consume 45% of the median local household income ($82k/yr) (locally 3075% of renters already pay >50% of income on rent) — very limited rent-growth headroom before tenants either downsize or default.
Forward outlook
- Local home prices are declining (-3.0%/yr); year-one equity from $968 of loan paydown is wiped out by about $4k of value loss. Plan a longer hold.
- San Bernardino County population projected at +15% by 2050 — modest demand growth; plan on rents tracking national, not racing it.
- At projected returns (-3.0% appreciation + 0.0% rent growth), your $39k cash investment doubles in ~3 years — after that, you're playing with house money.
Negotiation context
- It's been on market 132 days — a 12% lower offer ($123k) is reasonable based on typical stale-listing flexibility.
- 6 sale attempts since 17y ago; this cycle's ask has dropped $15k (10%) from the opening price — seller is motivated, your offer sets the floor, not the list.
Risks & watch-outs
- Climate carrying-cost: major flood risk; extreme-heat days projected 6→18/yr by 2055 (HVAC capex compounding) — expect insurance premiums to compound above CPI over the hold.
Questions for the listing agent
- It's been on market 132 days. Have you received any prior offers? Is the seller open to a 12% concession, seller financing, or rate buy-down credit?
- Built in 1973 — when were the roof, HVAC, electrical panel, plumbing, and water heater last replaced?
- Why hasn't it sold? Are there any deal-killer items the seller is aware of (foundation, flood, title, zoning, code violations)?
- Is there a deadline driving the sale (1031 exchange, divorce, estate, relocation)? That informs how much negotiation room exists.
- Schools are F-rated, which usually means shorter tenancies and higher turnover. Who's the typical renter profile here, and what's been the actual vacancy rate?
- What's the average days-on-market for RENTAL listings here right now (not sales)? A rising rental-DOM trend means longer vacancies and softer asking-rent achievability than the comps imply.
- What's the recent tenant-quality profile in this submarket — average credit score on applications, eviction rate, late-payment / NSF rate, and stable-employment percentage? A property-management company in the area should have these aggregated.
- How much new for-sale + rental construction is in the pipeline within 1–3 miles? Heavy new supply typically softens prices + rents 12–24 months out; constrained supply supports both.
Investment metrics
- 1% rule
- 2.21% ✓
- Cap rate
- 18.95%
- Cash-on-cash
- 45.21%
- DSCR
- 3.01
- GRM
- 3.8
CMA / ARV
- ARV (on-the-fly)
- $226,920
- Comps found
- 5
Show comp detail 5 sales within ~0.75 mi
| Address | Dist | Beds/Ba | Sqft | Sold | Price | $/sf | Match |
|---|---|---|---|---|---|---|---|
| 2139 E 4TH St #120 | 0.00mi | 3/2.0 | 1,590 (+9%) | 0mo | $147,000 | $92 | 85 |
| 2139 E 4th St #135 | 0.08mi | 3/2.0 | 1,560 (+7%) | 5mo | $268,323 | $172 | 81 |
| 2139 E 4th St #39 | 0.08mi | 3/2.0 | 1,320 (-10%) | 3mo | $185,000 | $140 | 78 |
| 2139 E 4th St #85 | 0.08mi | 3/2.0 | 1,512 (+3%) | 23mo | $234,995 | $155 | 72 |
| 2139 E 4th #90 | 0.08mi | 3/2.0 | 1,272 (-13%) | 6mo | $241,500 | $190 | 70 |
Match score weights: distance 35% · size 25% · config 20% · recency 20%. Top-matched comps best support the ARV.
Projected returns pro-forma
-3.0% appreciation · 0.0% rent growth · sell at horizon
- IRR
- 38.9%
- Equity multiple
- 2.59×
- Total profit
- $62,349
- Equity at exit
- $20,874
- IRR
- 43.8%
- Equity multiple
- 4.59×
- Total profit
- $140,552
- Equity at exit
- $12,105
Cash invested: $39,200 (down + closing). Projections, not guarantees.
Landlord ↔ Tenant lean methodology
- Overall (STATE)
- 18 Strongly Tenant-Friendly
- State California
- 18 Strongly Tenant-Friendly · D+13
- County
- — inherits STATE
- City
- — inherits STATE
ZIP-level market 91764
- Rents YoY
- -0.3%
- Active inventory
- 77
- Price-to-rent
- 3.8×
Monthly cashflow live
- Estimated rent
- $3,094 high interval (Pro) →
- Mortgage (P&I)
- −$734
- Tax est. 1.5%
- −$175 /mo · $2,100/yr
- Insurance
- −$58
- HOA
- −$0
- Vacancy / Maint / Mgmt
- −$650
- Net cashflow
- $1,477
Break-even live
Sensitivity live
| Price | -10% $1,574 | -5% $1,525 | +0% $1,477 | +5% $1,428 | +10% $1,380 |
|---|---|---|---|---|---|
| Rent | -10% $1,232 | -5% $1,355 | +0% $1,477 | +5% $1,599 | +10% $1,721 |
| Rate | -1.0pp $1,547 | -0.5pp $1,512 | base $1,477 | +0.5pp $1,440 | +1.0pp $1,404 |
UW: 25.0% down · 7.5% · 30yr · 1.5% tax · 5.0% vac · 8.0% maint · 8.0% mgmt
Financing live
Cash to close
- Down payment
- $35,000
- Closing costs
- $4,200
- Reserves months
- —
- Total cash needed
- —
Loan-product check · same deal, 3 products live
Conventional
25% down · 7.5% · 30yr
- Down + closing
- —
- Monthly P&I
- —
- Monthly cashflow
- —
- DSCR
- —
- Eligible?
- —
Personal DTI + credit; lowest rate.
DSCR
20% down · 8.5% · 30yr
- Down + closing
- —
- Monthly P&I
- —
- Monthly cashflow
- —
- DSCR
- —
- Eligible?
- —
No personal income docs; deal must DSCR.
Hard money
10% down · 12.0% · 12mo
- Down + closing
- —
- Monthly P&I
- —
- Monthly cashflow
- —
- DSCR
- —
- Eligible?
- —
Short-term bridge; refi at stabilization.
Rent comps 23 comps
| Address | Beds | Baths | Sqft | Rent | $/sqft | DOM | Units | Dist |
|---|---|---|---|---|---|---|---|---|
| 1925 E Harvard Privado Unit C Ontario, CA | 3.0 | 2.5 | 1540 | $3,000 | $1.95 | 0d | 1 | 0.37mi |
| 1221 N Vineyard Ave Ontario, CA | 1.0–2.0 | 1.0–2.0 | 867 | $2,345 | $2.70 | 0d | 5 | 0.45mi |
| 1879 E Jay St Unit B Ontario, CA | 3.0 | 1.5 | 1033 | $2,750 | $2.66 | 0d | 1 | 0.53mi |
| 1037 N Archibald Ave Ontario, CA | 2.0–3.0 | 2.5 | 1612 | $3,582 | $2.22 | 0d | 6 | 0.64mi |
| 2000 Inland Empire Blvd Ontario, CA | 3.0 | 1.0–2.0 | 808 | $3,799 | $4.70 | 0d | 34 | 0.68mi |
| 2615 E Date Palm Paseo Ontario, CA | 1.0–3.0 | 1.0–2.0 | 937 | $3,349 | $3.57 | 0d | 26 | 0.77mi |
| 755 N Via Dolcetto Ontario, CA | 2.0 | 2.5 | 1462 | $3,140 | $2.15 | 13d | 1 | 0.94mi |
| 1725 E G St Ontario, CA | 2.0–4.0 | 2.5–3.5 | 1100 | $2,690 | $2.45 | 0d | 5 | 0.95mi |
| 1675 E G St Ontario, CA | 1.0–3.0 | 1.0–2.0 | 842 | $2,500 | $2.97 | 0d | 10 | 0.97mi |
| 2830 E Via Fiano Ontario, CA | 4.0 | 2.5 | 1749 | $3,200 | $1.83 | 2d | 1 | 1.00mi |
| 2830 E Via Fiano Ontario, CA | 4.0 | 3.0 | 1750 | $3,200 | $1.83 | 16d | 1 | 1.00mi |
| 1548 N Lassen Ave Ontario, CA | 2.0 | 2.0 | 900 | $2,500 | $2.78 | 0d | 1 | 1.05mi |
| 1701 E D St Ontario, CA | 1.0–3.0 | 1.0–2.0 | 993 | $3,175 | $3.20 | 0d | 19 | 1.05mi |
| 2904 E Via Fiano Ontario, CA | 4.0 | 2.5 | 1749 | $3,250 | $1.86 | 23d | 1 | 1.07mi |
| 1005 N Center Ave Ontario, CA | 1.0–3.0 | 1.0–2.0 | 962 | $3,353 | $3.49 | 0d | 21 | 1.20mi |
| 811 N Turner Ave Unit 7 Ontario, CA | 2.0 | 2.5 | 1445 | $3,200 | $2.21 | 18d | 1 | 1.21mi |
| 8739 Pine Crest Pl Rancho Cucamonga, CA | 2.0 | 1.5 | 1179 | $2,700 | $2.29 | 0d | 1 | 1.24mi |
| 8731 Pine Crest Pl Rancho Cucamonga, CA | 2.0 | 1.5 | 1179 | $2,995 | $2.54 | 4d | 1 | 1.25mi |
| 751 N Corvette Dr Unit 4 Ontario, CA | 3.0 | 1.5 | 1200 | $2,950 | $2.46 | 0d | 1 | 1.28mi |
| 713 N Corvette Dr Unit 1 Ontario, CA | 3.0 | 1.5 | 1350 | $3,200 | $2.37 | 11d | 1 | 1.31mi |
| 713 N Corvette Dr Unit 3 Ontario, CA | 3.0 | 1.5 | 1250 | $2,900 | $2.32 | 4d | 1 | 1.31mi |
| 8445 Chaffee St Rancho Cucamonga, CA | 4.0 | 2.0 | 1438 | $3,300 | $2.29 | 16d | 1 | 1.37mi |
| 8555 Sandalwood Ct Rancho Cucamonga, CA | 3.0 | 2.0 | 1400 | $3,375 | $2.41 | 0d | 1 | 1.41mi |
Listing history 34 events
-
2026-06-21days on market $139,999 Active 132 DOM
-
2026-06-18days on market $139,999 Active 129 DOM
-
2026-06-17days on market $139,999 Active 128 DOM
-
2026-06-16days on market $139,999 Active 127 DOM
-
2026-06-15days on market $139,999 Active 126 DOM
-
2026-06-13days on market $139,999 Active 124 DOM
-
2026-06-13days on market $139,999 Active 123 DOM
-
2026-06-09days on market $139,999 Active 120 DOM
-
2026-06-08days on market $139,999 Active 119 DOM
-
2026-06-07days on market $139,999 Active 118 DOM
-
2026-06-04days on market $139,999 Active 115 DOM
-
2026-06-03days on market $139,999 Active 114 DOM
-
2026-06-02days on market $139,999 Active 113 DOM
-
2026-06-01days on market $139,999 Active 112 DOM
-
2026-05-31days on market $139,999 Active 111 DOM
-
2026-04-22price $139,999
-
2026-03-22price $145,000
-
2026-02-20price $149,999
-
2026-02-09$155,000 Active
-
2024-09-04soldstatus $149,500 Closed Sale 1061-char remark
Show marketing remark (1061 chars)
Discover this 4-bedroom, 2-bathroom mobile home in the Lamplighter Mobile Home Park in Ontario. Featuring an open concept design in your main living spaces. Enjoy the convenience of a Nest thermostat for energy efficiency, while the spacious living and dining areas provide a warm and inviting atmosphere. The primary bedroom offers an en-suite bathroom complete with a separate tub and shower, dual sinks, and plenty of space for your comfort. Each of the additional 3 bedrooms boasts ample size to accommodate your furnishings or the kids toys. Step out the sliding glass door to a covered patio with stamped concrete, complemented by a side yard featuring low-maintenance artificial turf—perfect for outdoor activities. You’ll also love the variety of fruit trees, including apple, peach, guava, and avocado, providing fresh produce right from your yard. With a 2-car covered carport and a large shed for extra storage, this home provides functionality. Enjoy community amenities such as a clubhouse, pool and spa, playground, and RV parking lot.
-
2024-07-31status Pending Sale 1061-char remark
Show marketing remark (1061 chars)
Discover this 4-bedroom, 2-bathroom mobile home in the Lamplighter Mobile Home Park in Ontario. Featuring an open concept design in your main living spaces. Enjoy the convenience of a Nest thermostat for energy efficiency, while the spacious living and dining areas provide a warm and inviting atmosphere. The primary bedroom offers an en-suite bathroom complete with a separate tub and shower, dual sinks, and plenty of space for your comfort. Each of the additional 3 bedrooms boasts ample size to accommodate your furnishings or the kids toys. Step out the sliding glass door to a covered patio with stamped concrete, complemented by a side yard featuring low-maintenance artificial turf—perfect for outdoor activities. You’ll also love the variety of fruit trees, including apple, peach, guava, and avocado, providing fresh produce right from your yard. With a 2-car covered carport and a large shed for extra storage, this home provides functionality. Enjoy community amenities such as a clubhouse, pool and spa, playground, and RV parking lot.
-
2024-07-17price $169,900 1061-char remark
Show marketing remark (1061 chars)
Discover this 4-bedroom, 2-bathroom mobile home in the Lamplighter Mobile Home Park in Ontario. Featuring an open concept design in your main living spaces. Enjoy the convenience of a Nest thermostat for energy efficiency, while the spacious living and dining areas provide a warm and inviting atmosphere. The primary bedroom offers an en-suite bathroom complete with a separate tub and shower, dual sinks, and plenty of space for your comfort. Each of the additional 3 bedrooms boasts ample size to accommodate your furnishings or the kids toys. Step out the sliding glass door to a covered patio with stamped concrete, complemented by a side yard featuring low-maintenance artificial turf—perfect for outdoor activities. You’ll also love the variety of fruit trees, including apple, peach, guava, and avocado, providing fresh produce right from your yard. With a 2-car covered carport and a large shed for extra storage, this home provides functionality. Enjoy community amenities such as a clubhouse, pool and spa, playground, and RV parking lot.
-
2024-07-12$180,000 Active 1061-char remark
Show marketing remark (1061 chars)
Discover this 4-bedroom, 2-bathroom mobile home in the Lamplighter Mobile Home Park in Ontario. Featuring an open concept design in your main living spaces. Enjoy the convenience of a Nest thermostat for energy efficiency, while the spacious living and dining areas provide a warm and inviting atmosphere. The primary bedroom offers an en-suite bathroom complete with a separate tub and shower, dual sinks, and plenty of space for your comfort. Each of the additional 3 bedrooms boasts ample size to accommodate your furnishings or the kids toys. Step out the sliding glass door to a covered patio with stamped concrete, complemented by a side yard featuring low-maintenance artificial turf—perfect for outdoor activities. You’ll also love the variety of fruit trees, including apple, peach, guava, and avocado, providing fresh produce right from your yard. With a 2-car covered carport and a large shed for extra storage, this home provides functionality. Enjoy community amenities such as a clubhouse, pool and spa, playground, and RV parking lot.
-
2023-11-22historical
-
2023-11-13status Active
-
2023-11-11status Pending Sale
-
2023-09-12price $170,000
-
2023-07-24$175,000 Active
-
2022-04-22soldstatus $155,000 Closed Sale
-
2022-03-09status Pending Sale
-
2022-01-20$150,000 Active
-
2009-07-18historical
-
2009-05-04price $39,500
-
2009-04-19$49,500
ⓘ Source: listings_history table (triggers on properties + properties_extension) + one-shot
backfill from property_details.listing_events for pre-trigger history.
Climate risk First Street
- Flood 6/10 Major FEMA zone X (shaded) · 69% chance over 30 yrs
- Wildfire 2/10 Low
- Heat 7/10 Severe 6 d/yr ≥100°F today · 18 d/yr by 30 yrs out
- Wind 1/10 Low
- Air quality 9/10 Extreme 23 unhealthy d/yr today · 28 by 30 yrs out
Nearby sold comps map
Loading sold comps map…
Walkable amenities ~0.75 mi
Loading nearby amenities…
Taxation est. · year 1
- Rental income
- $37,128
- − Mortgage interest
- −$7,842
- − Property taxes
- −$2,100
- − Insurance
- −$700
- − Repairs & maintenance
- −$2,970
- − Management
- −$2,970
- − Depreciation
- −$4,073
- Taxable income
- $16,473
- Est. tax owed @ 24.0%
- −$3,953
- After-tax cash flow
- $13,768/yr
For passive investors: Depreciation is non-cash, so a rental often shows a tax loss while cash-flowing — sheltering income. Rental losses are passive: they offset passive income freely, and up to $25,000/yr can offset ordinary (W-2) income if you actively participate and your MAGI is under $100k (phasing out to $0 by $150k); unused losses carry forward. On sale, claimed depreciation is recaptured at up to 25%, and gains may owe capital-gains tax (a 1031 exchange can defer both). Figures are a year-1 estimate at your 24.0% rate — not tax advice; consult a CPA.
Schools (NCES district)
- District
- Cucamonga Elementary
- NCES district ID
- 0616300
- Math proficiency
- 28% ▬ 0.00%
- Reading proficiency
- 42% ▲ 1.00%
- Median HH income
- $55,067
- Composite
- 33.44/100
- National rank
- #10539
- State rank
- #867 of 1400 in CA
Livability — Ontario
- Score
- 63/100
- State rank
- #435
- US rank
- #14949
Category grades
Schools grade is shown separately in the Schools card above.
Census & demographics
- Census place
- Ontario, CA
- County
- San Bernardino County · 2,030,291 people
- City population
- 183,440
- Metro
- Riverside-San Bernardino-Ontario, CA
- Population (ZIP)
- 56,270
- Household income
- $81,762
- Rent vs Own
- Severe rent burden
- 3075.0
Population outlook (San Bernardino County) Hauer SSP2
- Today (2025)
- 2,300,329 people
- By 2030
- 2,378,907 · +3.4%
- By 2040
- 2,523,137 · +9.7%
- By 2050
- 2,642,388 · +14.9%
- By 2075
- 2,880,769 · +25.2%
- By 2100
- 2,909,436 · +26.5%
Race, ethnicity, and origin ACS 2023
- Neighborhood character
- Predominantly Hispanic (70%)
- Race & ethnicity
- Hispanic / Latino 70% Two or more races 26% White 12% Black 8% Asian 6% Native American 2%
- Hispanic origin (detail)
- Mexican 60%
- Common ancestry
- Italian 1% Romanian 1% Serbian 1%
- Foreign-born
- 28% · Canada, China, Vietnam
- Languages at home
- 44% English-only · Spanish 50% Chinese 1% Tagalog/Filipino 1%
Political lean MEDSL · San Bernardino
- 2024 margin
- Toss-up / Even · D 47.5% · R 49.7% · Other 2.8%
- 2008→2024 swing
- -8.5pp toward R · 2008: 6.3pp · 2024: -2.1pp
- All cycles
- 2024: R+2.1 2020: D+10.7 2016: D+9.8 2012: D+5.4 2008: D+6.3
Not yet ingested
- Civics
- —
Market trends
- HPI YoY
- ▼ -571.87%
- Current HPI
- 456.8173
- Rent YoY
- ▼ -0.27%
- Metro
- Riverside-San Bernardino-Ontario, CA
- State GDP YoY
- ▲ 3.21%
- F500 in state
- 116
Industry mix (Fortune 500 HQ in CA)
| Industry | F500 HQs | Revenue |
|---|---|---|
| Technology | 27 | $1,492B |
|
||
| Financial Services | 3 | $174B |
|
||
| Retail | 3 | $44B |
|
||
| Insurance | 3 | $26B |
|
||
| Media / Entertainment | 2 | $115B |
|
||
| Pharmaceuticals / Biotech | 2 | $62B |
|
||
Price history
+182.8% since first listed19 events — show timeline
- 2026-04-22 Price Changed $139,999 CRMLS
- 2026-03-22 Price Changed $145,000 CRMLS
- 2026-02-20 Price Changed $149,999 CRMLS
- 2026-02-09 Listed $155,000 CRMLS
- 2024-09-04 Sold (MLS) $149,500 CRMLS
- 2024-07-31 Pending — CRMLS
- 2024-07-17 Price Changed $169,900 CRMLS
- 2024-07-12 Listed $180,000 CRMLS
- 2023-11-22 Listing Removed — CRMLS
- 2023-11-13 Relisted — CRMLS
- 2023-11-11 Pending — CRMLS
- 2023-09-12 Price Changed $170,000 CRMLS
- 2023-07-24 Listed $175,000 CRMLS
- 2022-04-22 Sold (MLS) $155,000 CRMLS
- 2022-03-09 Pending — CRMLS
- 2022-01-20 Listed $150,000 CRMLS
- 2009-07-18 Listing Removed — CRMLS
- 2009-05-04 Price Changed $39,500 CRMLS
- 2009-04-19 Listed $49,500 CRMLS
Property tax history
-0.4%/yrLatest (2012): $161 · -1.3% YoY. Source: county tax records.
Cash-flow waterfall
monthlySold comps — $/sqft
last 12 mo · ≤1 miLoading sold comps…