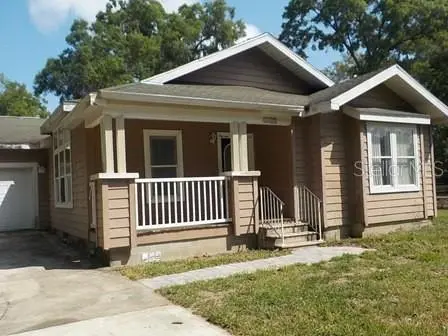
2625 SE 140th Pl · Belleview, FL
Flood risk 1/10 · Minimal
- FEMA flood zone
- X (unshaded)
- Chance of flooding over 30 yrs
- 0.0%
- Est. flood insurance / yr
- $507 – $1,088
Fire risk 5/10 · Moderate
- Est. fire insurance / yr
- $947 – $1,759
Heat risk 8/10 · Major
- Hot days now (above 108°F)
- 7 days/yr
- Hot days in 30 yrs
- 20 days/yr
Wind risk 9/10 · Severe
- Chance of severe wind over 30 yrs
- 99.0%
Air-quality risk 3/10 · Minor
- Unhealthy air days now
- 3 days/yr
- Unhealthy air days in 30 yrs
- 4 days/yr
Risk factors via First Street. Map © Google.
Why this score? — see what drove the B+ grade
The composite is a weighted blend of 9 inputs, each scored 0–100. Each bar is that input's sub-score; the figure is the points it added to the 100-point composite (weight × sub-score).
- Cash flow +30.0/30.0
- ARV discount +15.0/15.0
- DSCR +10.0/10.0
- 1% rule +9.7/10.0
- Schools +3.6/10.0
- Livability +3.5/5.0
- Rent growth +2.5/5.0
- Condition / age +2.5/5.0
- Appreciation +0.0/10.0
$128,250
🖨 Deal sheet (PDF) 📄 Offer letter ✓ Due diligence
Listing remarks MLS
Close to everything! Fenced yard for the fur babies. . then into the front door where you immedialtly notice the pretty windows in the living room, the spaceous kitchen where you will be able to cook up some delicious food. . to be served in the dining area. The laundry room is inside for convenience ! The main bedroom is Huge. . with a walk in closet and an a nice bath with a garden tub, a shower and his and her vanities. . Come see the possibilites! No assignables, no escalation clauses and buyer must view property( no blind offers)
Key facts
- Fenced yard
- Laundry room
- His and her vanities
Tags
Neighborhood map
What this means for you Summary
Snapshot
- This is a 3-bed/2.0-bath single-family listed at $128k.
Deal economics
- At list price, monthly cash flow is $488 ($6k/yr) — positive.
- The deal already cash-flows at list — no discount required.
- Meets the 1% rule at list price ($2k rent vs $128k).
- Recommended offer: $124k (3.0% below list) — sets the bar for market timing.
- Cap rate 10.9% vs local median 4.5% in Belleview — top-decile yield for the area; either an underpriced asset or a hidden risk that comps aren't pricing in. Stress-test before assuming the spread holds.
Location & tenants
- Location reads 69/100 on livability (#458 in FL) — a middle-class / working-renter tenant base. Strengths: cost of living A+, housing A+, health & safety A+; Watch: schools D, crime F, amenities F.
- Marion (rural): math 42% / reading 43% proficiency, ranked #61 of 73 in FL (top 84%) — families likely to look elsewhere, expect single-tenant / working-renter base with shorter leases; 61% free/reduced lunch — lower-income household profile, screen leases tightly.
- Market conditions: 705 active listings in the ZIP; 4 comparable units currently listed for rent nearby; rentals at typical pace (median 22d on market — plan ~3-4 weeks tenant-placement turnaround); 7,071 units permitted in Marion County in 2024 (534 in 5+ unit buildings).
- This rent runs 34% of the median local income ($67k/yr) — at the standard rent-burdened threshold; future hikes will face affordability resistance.
Forward outlook
- Local home prices are declining (-3.0%/yr); year-one equity from $886 of loan paydown is wiped out by about $4k of value loss. Plan a longer hold.
- Marion County population projected at +13% by 2050 — modest demand growth; plan on rents tracking national, not racing it.
- At projected returns (-3.0% appreciation + 3.0% rent growth), your $36k cash investment doubles in ~8 years — after that, you're playing with house money.
Negotiation context
- It's been on market 49 days — a 3% lower offer ($124k) is reasonable based on typical stale-listing flexibility.
Risks & watch-outs
- Watch-outs: property tax is 2.6% of price.
- Climate carrying-cost: severe wind risk, 99% chance of damaging wind over 30y; moderate wildfire risk; extreme-heat days projected 7→20/yr by 2055 (HVAC capex compounding) — expect insurance premiums to compound above CPI over the hold.
Questions for the listing agent
- It's been on market 49 days. Have you received any prior offers? Is the seller open to a 3% concession, seller financing, or rate buy-down credit?
- Property tax is high relative to price — has the assessment been appealed recently, and will the sale trigger a re-assessment?
- Is there a deadline driving the sale (1031 exchange, divorce, estate, relocation)? That informs how much negotiation room exists.
- Schools are D-rated, which usually means shorter tenancies and higher turnover. Who's the typical renter profile here, and what's been the actual vacancy rate?
- Crime grade is F in this area — have there been break-ins, vandalism, or insurance claims at this property in the last 3 years? What carrier currently insures it and at what premium?
- What's the average days-on-market for RENTAL listings here right now (not sales)? A rising rental-DOM trend means longer vacancies and softer asking-rent achievability than the comps imply.
- What's the recent tenant-quality profile in this submarket — average credit score on applications, eviction rate, late-payment / NSF rate, and stable-employment percentage? A property-management company in the area should have these aggregated.
- How much new for-sale + rental construction is in the pipeline within 1–3 miles? Heavy new supply typically softens prices + rents 12–24 months out; constrained supply supports both.
Investment metrics
- 1% rule
- 1.47% ✓
- Cap rate
- 10.86%
- Cash-on-cash
- 16.29%
- DSCR
- 1.72
- GRM
- 5.7
CMA / ARV
- ARV (median comp)
- $229,514
- List price
- $128,250
- Delta
- -44.12%
- Verdict
- UNDERPRICED
- Comps
- 20 within 1.0 mi
Show comp detail 4 sales within ~0.75 mi
| Address | Dist | Beds/Ba | Sqft | Sold | Price | $/sf | Match |
|---|---|---|---|---|---|---|---|
| 3039 SE 142nd Ln | 0.41mi | 3/2.0 | 1,399 (-11%) | 4mo | $245,000 | $175 | 59 |
| 2997 SE 140th Pl | 0.30mi | 4/2.0 (+1) | 1,752 (+12%) | 9mo | $295,000 | $168 | 54 |
| 3000 SE 146th Pl | 0.69mi | 3/2.0 | 1,476 (-6%) | 22mo | $249,900 | $169 | 40 |
| 14230 SE 34th Ct | 0.69mi | 4/2.0 (+1) | 1,747 (+11%) | 14mo | $285,900 | $164 | 33 |
Match score weights: distance 35% · size 25% · config 20% · recency 20%. Top-matched comps best support the ARV.
Projected returns pro-forma
-3.0% appreciation · 3.0% rent growth · sell at horizon
- IRR
- 7.4%
- Equity multiple
- 1.29×
- Total profit
- $10,373
- Equity at exit
- $19,122
- IRR
- 16.7%
- Equity multiple
- 2.38×
- Total profit
- $49,429
- Equity at exit
- $11,089
Cash invested: $35,910 (down + closing). Projections, not guarantees.
Landlord ↔ Tenant lean methodology
- Overall (STATE)
- 87 Strongly Landlord-Friendly
- State Florida
- 87 Strongly Landlord-Friendly · R+3
- County
- — inherits STATE
- City
- — inherits STATE
ZIP-level market 34491
- Home prices YoY
- -35.0%
- Active inventory
- 705
- Price-to-rent
- 5.7×
Monthly cashflow live
- Estimated rent
- $1,888 medium interval (Pro) →
- Mortgage (P&I)
- −$673
- Tax from tax record
- −$278 /mo · $3,331/yr
- Insurance
- −$53
- HOA
- −$0
- Vacancy / Maint / Mgmt
- −$396
- Net cashflow
- $488
Break-even live
Sensitivity live
| Price | -10% $560 | -5% $524 | +0% $488 | +5% $451 | +10% $415 |
|---|---|---|---|---|---|
| Rent | -10% $338 | -5% $413 | +0% $488 | +5% $562 | +10% $637 |
| Rate | -1.0pp $552 | -0.5pp $520 | base $488 | +0.5pp $454 | +1.0pp $421 |
UW: 25.0% down · 7.5% · 30yr · 1.5% tax · 5.0% vac · 8.0% maint · 8.0% mgmt
Financing live
Cash to close
- Down payment
- $32,062
- Closing costs
- $3,848
- Reserves months
- —
- Total cash needed
- —
Loan-product check · same deal, 3 products live
Conventional
25% down · 7.5% · 30yr
- Down + closing
- —
- Monthly P&I
- —
- Monthly cashflow
- —
- DSCR
- —
- Eligible?
- —
Personal DTI + credit; lowest rate.
DSCR
20% down · 8.5% · 30yr
- Down + closing
- —
- Monthly P&I
- —
- Monthly cashflow
- —
- DSCR
- —
- Eligible?
- —
No personal income docs; deal must DSCR.
Hard money
10% down · 12.0% · 12mo
- Down + closing
- —
- Monthly P&I
- —
- Monthly cashflow
- —
- DSCR
- —
- Eligible?
- —
Short-term bridge; refi at stabilization.
Rent comps 4 comps
| Address | Beds | Baths | Sqft | Rent | $/sqft | DOM | Units | Dist |
|---|---|---|---|---|---|---|---|---|
| 3384 SE 138th St Summerfield, FL | 3.0 | 2.0 | 1265 | $1,745 | $1.38 | 21d | 1 | 0.69mi |
| 3780 SE 141st Ln Summerfield, FL | 3.0 | 2.0 | 1066 | $1,595 | $1.50 | 21d | 1 | 1.01mi |
| 3780 SE 141st Ln Summerfield, FL | 3.0 | 2.0 | 1066 | $1,525 | $1.43 | 14d | 1 | 1.01mi |
| 3820 SE 136th Pl Summerfield, FL | 3.0 | 2.0 | 1265 | $1,745 | $1.38 | 21d | 1 | 1.13mi |
Listing history 9 events
-
2026-06-07statusdays on market $128,250 Pending 49 DOM
-
2026-06-03days on market $128,250 Active 47 DOM
-
2026-06-02days on market $128,250 Active 46 DOM
-
2026-06-01days on market $128,250 Active 45 DOM
-
2026-05-31days on market $128,250 Active 44 DOM
-
2026-05-30days on market $128,250 Active 43 DOM
-
2026-05-18price $128,250 542-char remark
Show marketing remark (542 chars)
Close to everything! Fenced yard for the fur babies. . then into the front door where you immedialtly notice the pretty windows in the living room, the spaceous kitchen where you will be able to cook up some delicious food. . to be served in the dining area. The laundry room is inside for convenience ! The main bedroom is Huge. . with a walk in closet and an a nice bath with a garden tub, a shower and his and her vanities. . Come see the possibilites! No assignables, no escalation clauses and buyer must view property( no blind offers)
-
2026-05-18price $128,500 542-char remark
Show marketing remark (542 chars)
Close to everything! Fenced yard for the fur babies. . then into the front door where you immedialtly notice the pretty windows in the living room, the spaceous kitchen where you will be able to cook up some delicious food. . to be served in the dining area. The laundry room is inside for convenience ! The main bedroom is Huge. . with a walk in closet and an a nice bath with a garden tub, a shower and his and her vanities. . Come see the possibilites! No assignables, no escalation clauses and buyer must view property( no blind offers)
-
2026-04-17$135,000 Active 542-char remark
Show marketing remark (542 chars)
Close to everything! Fenced yard for the fur babies. . then into the front door where you immedialtly notice the pretty windows in the living room, the spaceous kitchen where you will be able to cook up some delicious food. . to be served in the dining area. The laundry room is inside for convenience ! The main bedroom is Huge. . with a walk in closet and an a nice bath with a garden tub, a shower and his and her vanities. . Come see the possibilites! No assignables, no escalation clauses and buyer must view property( no blind offers)
ⓘ Source: listings_history table (triggers on properties + properties_extension) + one-shot
backfill from property_details.listing_events for pre-trigger history.
Tax reassessment forecast FL · Resets to sale price
- Current annual tax
- $3,331 · $278/mo
- Projected year-2 tax
- $3,331 · $278/mo
- Expected delta
- $0/yr ($0/mo · 0.0%)
ⓘ Screening estimate from a state-policy table — verify with the county assessor before closing.
Climate risk First Street
- Flood 1/10 Low FEMA zone X (unshaded) · 0% chance over 30 yrs
- Wildfire 5/10 Major
- Heat 8/10 Severe 7 d/yr ≥108°F today · 20 d/yr by 30 yrs out
- Wind 9/10 Extreme 99% chance of damaging wind over 30 yrs
- Air quality 3/10 Moderate 3 unhealthy d/yr today · 4 by 30 yrs out
Nearby sold comps map
Loading sold comps map…
Walkable amenities ~0.75 mi
Loading nearby amenities…
Taxation est. · year 1
- Rental income
- $22,650
- − Mortgage interest
- −$7,184
- − Property taxes
- −$3,331
- − Insurance
- −$641
- − Repairs & maintenance
- −$1,812
- − Management
- −$1,812
- − Depreciation
- −$3,731
- Taxable income
- $4,139
- Est. tax owed @ 24.0%
- −$993
- After-tax cash flow
- $4,858/yr
For passive investors: Depreciation is non-cash, so a rental often shows a tax loss while cash-flowing — sheltering income. Rental losses are passive: they offset passive income freely, and up to $25,000/yr can offset ordinary (W-2) income if you actively participate and your MAGI is under $100k (phasing out to $0 by $150k); unused losses carry forward. On sale, claimed depreciation is recaptured at up to 25%, and gains may owe capital-gains tax (a 1031 exchange can defer both). Figures are a year-1 estimate at your 24.0% rate — not tax advice; consult a CPA.
Schools (NCES district)
- District
- Marion
- NCES district ID
- 1201260
- Math proficiency
- 42% ▼ -7.00%
- Reading proficiency
- 43% ▼ -4.00%
- Median HH income
- $40,015
- Composite
- 35.61/100
- National rank
- #4890
- State rank
- #61 of 73 in FL
Livability — Belleview
- Score
- 69/100
- State rank
- #458
- US rank
- #8314
Category grades
Schools grade is shown separately in the Schools card above.
Census & demographics
- County
- Marion County · 315,796 people
- City population
- 19,167
- Metro
- Ocala, FL
- Population (ZIP)
- 33,318
- Household income
- $66,679
- Rent vs Own
- Severe rent burden
- 256.0
Population outlook (Marion County) Hauer SSP2
- Today (2025)
- 365,905 people
- By 2030
- 376,768 · +3.0%
- By 2040
- 396,555 · +8.4%
- By 2050
- 412,723 · +12.8%
- By 2075
- 446,090 · +21.9%
- By 2100
- 436,193 · +19.2%
Race, ethnicity, and origin ACS 2023
- Neighborhood character
- Predominantly White (77%)
- Race & ethnicity
- White 77% Hispanic / Latino 14% Two or more races 9% Black 4% Asian 2%
- Hispanic origin (detail)
- Mexican 3% Puerto Rican 6% Cuban 1%
- Common ancestry
- Lithuanian 3% Slovak 2% Romanian 2%
- Foreign-born
- 8% · Canada, Vietnam, Jamaica
- Languages at home
- 85% English-only · Spanish 11% Vietnamese 1% French/Haitian/Cajun 1%
Political lean MEDSL · Marion
- 2024 margin
- Solid R (+31.6) · D 33.8% · R 65.5%
- 2008→2024 swing
- -20.0pp toward R · 2008: -11.6pp · 2024: -31.6pp
- All cycles
- 2024: R+31.6 2020: R+25.9 2016: R+26.2 2012: R+16.2 2008: R+11.6
Not yet ingested
- Civics
- —
Market trends
- HPI YoY
- ▼ -107.67%
- Current HPI
- 200.0792
- Rent YoY
- —
- Metro
- Ocala, FL
- State GDP YoY
- ▲ 3.28%
- F500 in state
- 36
Industry mix (Fortune 500 HQ in FL)
| Industry | F500 HQs | Revenue |
|---|---|---|
| Industrial Technology | 2 | $29B |
|
||
| Insurance | 2 | $17B |
|
||
| Retail | 1 | $60B |
|
||
| Technology Distribution | 1 | $58B |
|
||
| Homebuilding | 1 | $35B |
|
||
| Technology Manufacturing | 1 | $35B |
|
||
Price history
-5.0% since first listed3 events — show timeline
- 2026-05-18 Price Changed $128,250 Stellar MLS as Distributed by MLS Grid
- 2026-05-18 Price Changed $128,500 Stellar MLS as Distributed by MLS Grid
- 2026-04-17 Listed $135,000 Stellar MLS as Distributed by MLS Grid
Property tax history
+13.9%/yrLatest (2025): $3,331 · +17.1% YoY. Source: county tax records.
Cash-flow waterfall
monthlySold comps — $/sqft
last 12 mo · ≤1 miLoading sold comps…