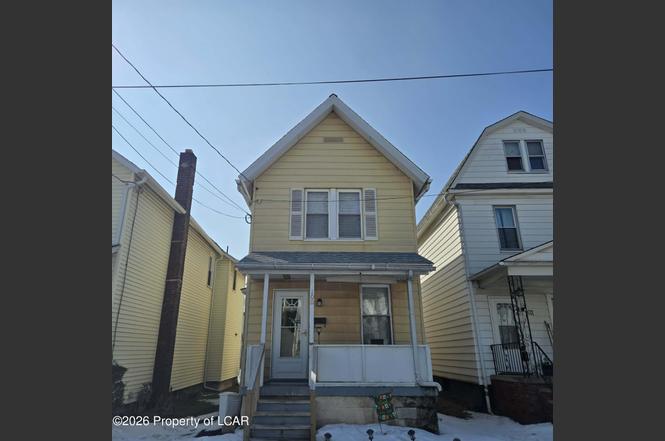
100 Poplar St · Kingston, PA
Flood risk 8/10 · Major
- FEMA flood zone
- X
- Chance of flooding over 30 yrs
- 0.78%
- Est. flood insurance / yr
- $507 – $1,088
Fire risk 3/10 · Minor
- Est. fire insurance / yr
- $511 – $949
Heat risk 4/10 · Minor
- Hot days now (above 97°F)
- 7 days/yr
- Hot days in 30 yrs
- 16 days/yr
Wind risk 3/10 · Minor
- Chance of severe wind over 30 yrs
- 5.0%
Air-quality risk 3/10 · Minor
- Unhealthy air days now
- 2 days/yr
- Unhealthy air days in 30 yrs
- 4 days/yr
Risk factors via First Street. Map © Google.
Why this score? — see what drove the C+ grade
The composite is a weighted blend of 9 inputs, each scored 0–100. Each bar is that input's sub-score; the figure is the points it added to the 100-point composite (weight × sub-score).
- Cash flow +22.7/30.0
- ARV discount +15.0/15.0
- DSCR +7.3/10.0
- 1% rule +5.9/10.0
- Livability +4.0/5.0
- Rent growth +3.7/5.0
- Schools +2.5/10.0
- Condition / age +2.5/5.0
- Appreciation +0.0/10.0
$124,900
🖨 Deal sheet 📄 Offer letter ✓ Due diligence
Listing remarks
Great starter home or investment property conveniently located in Kingston! New roof, new furnace, and new flooring on the first floor.
Key facts
- New furnace
- New flooring
- New roof
Tags
Neighborhood map
What this means for you Summary
Snapshot
- This is a 2-bed/2.0-bath single-family listed at $125k.
Deal economics
- At list price, monthly cash flow is $148 ($2k/yr) — positive.
- The deal already cash-flows at list — no discount required.
- Meets the 1% rule at list price ($1k rent vs $125k).
- Recommended offer: $121k (3.0% below list) — sets the bar for market timing.
- Cap rate 8.4% vs local median 5.0% in Kingston — top-decile yield for the area; either an underpriced asset or a hidden risk that comps aren't pricing in. Stress-test before assuming the spread holds.
Location & tenants
- Location reads 81/100 on livability (#162 in PA, #1,345 nationally) — a professional / high-income tenant draw. Strengths: cost of living A+, health & safety A+, housing A; Watch: employment D, commute F.
- Wyoming Valley West SD (suburban): math 18% / reading 42% proficiency, ranked #445 of 539 in PA (top 83%) — families likely to look elsewhere, expect single-tenant / working-renter base with shorter leases.
- Market conditions: Rents rising fast (+4.7%/yr); 132 active listings in the ZIP; 36 comparable units currently listed for rent nearby; rentals at typical pace (median 21d on market — plan ~3-4 weeks tenant-placement turnaround); 349 units permitted in Luzerne County in 2024 (16 in 5+ unit buildings).
Forward outlook
- Local home prices are declining (-3.0%/yr); year-one equity from $864 of loan paydown is wiped out by about $4k of value loss. Plan a longer hold.
- Luzerne County population projected at +4% by 2050 — modest demand growth; plan on rents tracking national, not racing it.
Negotiation context
- It's been on market 54 days — a 3% lower offer ($121k) is reasonable based on typical stale-listing flexibility.
- Current owner paid $47k; list at $125k implies a 166% gain — meaningful room to come down on a strong offer.
Risks & watch-outs
- Watch-outs: flood insurance adds $66/mo; built in 1935 — expect roof / HVAC / electrical / plumbing capex.
- Climate carrying-cost: severe flood risk — expect insurance premiums to compound above CPI over the hold.
Questions for the listing agent
- It's been on market 54 days. Have you received any prior offers? Is the seller open to a 3% concession, seller financing, or rate buy-down credit?
- Built in 1935 — when were the roof, HVAC, electrical panel, plumbing, and water heater last replaced?
- What's the actual annual flood-insurance premium (NFIP or private), and is the property in a SFHA with mandatory coverage?
- Is there a deadline driving the sale (1031 exchange, divorce, estate, relocation)? That informs how much negotiation room exists.
- What's the average days-on-market for RENTAL listings here right now (not sales)? A rising rental-DOM trend means longer vacancies and softer asking-rent achievability than the comps imply.
- What's the recent tenant-quality profile in this submarket — average credit score on applications, eviction rate, late-payment / NSF rate, and stable-employment percentage? A property-management company in the area should have these aggregated.
- How much new for-sale + rental construction is in the pipeline within 1–3 miles? Heavy new supply typically softens prices + rents 12–24 months out; constrained supply supports both.
Investment metrics
- 1% rule
- 1.09% ✓
- Cap rate
- 8.35%
- Cash-on-cash
- 7.35%
- DSCR
- 1.33
- GRM
- 7.7
CMA / ARV
- ARV (on-the-fly)
- $155,220
- Comps found
- 12
Show comp detail 12 sales within ~0.75 mi
| Address | Dist | Beds/Ba | Sqft | Sold | Price | $/sf | Match |
|---|---|---|---|---|---|---|---|
| 100 Poplar St | 0.00mi | 2/2.0 | 1,300 (+9%) | 0mo | $120,000 | $92 | 85 |
| 474 Chestnut Ave | 0.12mi | 3/1.0 (+1) | 1,152 (-4%) | 5mo | $164,500 | $143 | 75 |
| 142 Price St | 0.14mi | 2/1.0 | 1,115 (-7%) | 8mo | $145,000 | $130 | 72 |
| 105 Ann St | 0.61mi | 3/1.5 (+1) | 1,200 (+0%) | 2mo | $162,000 | $135 | 62 |
| 186 Meyers St | 0.66mi | 2/1.0 | 1,128 (-6%) | 2mo | $192,500 | $171 | 54 |
| 251 Union St | 0.38mi | 3/1.0 (+1) | 1,346 (+13%) | 0mo | $140,000 | $104 | 52 |
| 133 John St | 0.33mi | 3/1.5 (+1) | 1,335 (+12%) | 8mo | $161,500 | $121 | 51 |
| 230 Wright Ave | 0.72mi | 2/1.0 | 1,260 (+6%) | 6mo | $147,500 | $117 | 48 |
| 183 Church St | 0.69mi | 3/1.0 (+1) | 1,250 (+5%) | 5mo | $194,900 | $156 | 47 |
| 258 Factory St | 0.43mi | 3/1.0 (+1) | 1,344 (+13%) | 4mo | $147,000 | $109 | 46 |
| 98 Roosevelt St | 0.64mi | 2/1.0 | 1,043 (-13%) | 2mo | $220,000 | $211 | 44 |
| 385 Vaughn St | 0.64mi | 3/1.0 (+1) | 1,368 (+15%) | 0mo | $120,000 | $88 | 36 |
Match score weights: distance 35% · size 25% · config 20% · recency 20%. Top-matched comps best support the ARV.
Projected returns pro-forma
-3.0% appreciation · 4.65% rent growth · sell at horizon
- IRR
- -6.4%
- Equity multiple
- 0.76×
- Total profit
- $-8,468
- Equity at exit
- $18,623
- IRR
- 5.3%
- Equity multiple
- 1.42×
- Total profit
- $14,731
- Equity at exit
- $10,799
Cash invested: $34,972 (down + closing). Projections, not guarantees.
Landlord ↔ Tenant lean methodology
- Overall (STATE)
- 62 Landlord-Friendly
- State Pennsylvania
- 62 Landlord-Friendly · EVEN
- County
- — inherits STATE
- City
- — inherits STATE
ZIP-level market 18704
- Rents YoY
- 4.7%
- Active inventory
- 132
- Price-to-rent
- 7.7×
Monthly cashflow live
- Estimated rent
- $1,360 high interval (Pro) →
- Mortgage (P&I)
- −$655
- Tax from tax record
- −$153 /mo · $1,835/yr
- Insurance
- −$52
- Flood insurance flood zone
- −$66 /mo · $798/yr
- HOA
- −$0
- Vacancy / Maint / Mgmt
- −$286
- Net cashflow
- $148
Break-even live
UW: 25.0% down · 7.5% · 30yr · 1.5% tax · 5.0% vac · 8.0% maint · 8.0% mgmt
Financing live
Cash to close
- Down payment
- $31,225
- Closing costs
- $3,747
- Reserves months
- —
- Total cash needed
- —
Loan-product check · same deal, 3 products live
Conventional
25% down · 7.5% · 30yr
- Down + closing
- —
- Monthly P&I
- —
- Monthly cashflow
- —
- DSCR
- —
- Eligible?
- —
Personal DTI + credit; lowest rate.
DSCR
20% down · 8.5% · 30yr
- Down + closing
- —
- Monthly P&I
- —
- Monthly cashflow
- —
- DSCR
- —
- Eligible?
- —
No personal income docs; deal must DSCR.
Hard money
10% down · 12.0% · 12mo
- Down + closing
- —
- Monthly P&I
- —
- Monthly cashflow
- —
- DSCR
- —
- Eligible?
- —
Short-term bridge; refi at stabilization.
Rent comps 36 comps
| Address | Beds | Baths | Sqft | Rent | $/sqft | DOM | Units | Dist |
|---|---|---|---|---|---|---|---|---|
| 59 Price St Unit 2 Kingston, PA | 3.0 | 1.0 | 1000 | $1,100 | $1.10 | 43d | 1 | 0.12mi |
| 47 Price St Apt 2 Kingston, PA | 2.0 | 1.0 | 1200 | $1,200 | $1.00 | 43d | 1 | 0.14mi |
| 27 1/2 Penn St Kingston, PA | 3.0 | 1.0 | 1200 | $1,400 | $1.17 | 43d | 1 | 0.43mi |
| 27 Penn St Kingston, PA | 3.0 | 1.5 | 1225 | $1,550 | $1.27 | 21d | 1 | 0.46mi |
| 41 Pulaski St Kingston, PA | 3.0 | 1.5 | 1292 | $1,450 | $1.12 | 21d | 1 | 0.51mi |
| 206 Zerby Ave Edwardsville, PA | 2.0 | 1.0 | 741 | $1,200 | $1.62 | 13d | 1 | 0.53mi |
| 36 Pulaski St Kingston, PA | 3.0 | 2.0 | 1432 | $1,600 | $1.12 | 13d | 1 | 0.53mi |
| 98 E Walnut St Kingston, PA | 3.0 | 1.0 | 1280 | $1,500 | $1.17 | 21d | 1 | 0.54mi |
| 109 Penn St Unit 1 Kingston, PA | 3.0 | 1.0 | 1200 | $1,400 | $1.17 | 13d | 1 | 0.55mi |
| 109 Penn St Kingston, PA | 3.0 | 1.0 | 1200 | $1,400 | $1.17 | 43d | 1 | 0.55mi |
| 313 Rutter Ave Kingston, PA | 2.0 | 1.0 | 727 | $1,450 | $1.99 | 43d | 1 | 0.57mi |
| 104 Meyers St Kingston, PA | 3.0 | 1.0 | 1200 | $1,495 | $1.25 | 43d | 1 | 0.57mi |
| 151 E Walnut St Kingston, PA | 2.0 | 1.0 | 900 | $1,000 | $1.11 | 13d | 1 | 0.57mi |
| 157 E Walnut St Kingston, PA | 2.0 | 1.0 | 900 | $1,000 | $1.11 | 13d | 1 | 0.58mi |
| 266 Rutter Ave Unit 2 Kingston, PA | 2.0 | 1.0 | 875 | $1,270 | $1.45 | 43d | 1 | 0.62mi |
| 256 E Grove St Kingston, PA | 2.0 | 1.0 | 1000 | $1,250 | $1.25 | 13d | 1 | 0.66mi |
| 238 Rutter Ave Kingston, PA | 2.0 | 1.0 | 1200 | $1,050 | $0.88 | 43d | 1 | 0.66mi |
| 182 Roosevelt St Kingston, PA | 2.0 | 1.0 | 1152 | $1,625 | $1.41 | 13d | 1 | 0.70mi |
| 41 Main St Kingston, PA | 3.0 | 1.0 | 1350 | $1,400 | $1.04 | 21d | 1 | 0.70mi |
| 9-10 Meyers Ct Kingston, PA | 3.0 | 1.0 | 1250 | $1,500 | $1.20 | 21d | 1 | 0.72mi |
| 942 Wyoming Ave Unit A Forty Fort, PA | 2.0 | 1.5 | 1054 | $1,600 | $1.52 | 43d | 1 | 0.76mi |
| 11 Holiday Dr Kingston, PA | 1.0–3.0 | 1.0–2.5 | 1083 | $2,044 | $1.89 | 13d | 14 | 0.80mi |
| 20 N Loveland Ave Kingston, PA | 3.0 | 2.0 | 1400 | $1,775 | $1.27 | 13d | 1 | 0.85mi |
| 400 N Gates Ave Unit 1 Kingston, PA | 2.0 | 2.0 | 1198 | $1,300 | $1.09 | 43d | 1 | 0.85mi |
| 570 Main St Edwardsville, PA | 2.0 | 1.0 | 1100 | $1,180 | $1.07 | 43d | 1 | 0.86mi |
| 9 Snowden St Forty Fort, PA | 3.0 | 1.0 | 1500 | $1,250 | $0.83 | 21d | 1 | 0.90mi |
| 42 N Thomas Ave Kingston, PA | 1.0 | 1.0 | 950 | $1,150 | $1.21 | 44d | 1 | 0.94mi |
| 27 S Gates Ave Kingston, PA | 3.0 | 2.0 | 1200 | $1,750 | $1.46 | 21d | 1 | 1.07mi |
| 141 Short St Edwardsville, PA | 3.0 | 1.0 | 1040 | $1,100 | $1.06 | 43d | 1 | 1.08mi |
| 73 2nd Ave Kingston, PA | 2.0 | 1.0 | 1200 | $950 | $0.79 | 21d | 1 | 1.12mi |
| 1154 Murray St Kingston, PA | 2.0 | 1.5 | 1152 | $1,600 | $1.39 | 43d | 1 | 1.13mi |
| 115 1st Ave Unit 115 Kingston, PA | 3.0 | 1.0 | 1200 | $1,495 | $1.25 | 13d | 1 | 1.14mi |
| 300 Market St Ste 104 Kingston, PA | 2.0 | 2.0 | 873 | $1,950 | $2.23 | 13d | 1 | 1.15mi |
| 200 Gateway Dr Kingston, PA | 1.0–3.0 | 1.0–2.0 | 1130 | $2,428 | $2.15 | 13d | 1 | 1.22mi |
| 100 Parkway Blvd Kingston, PA | 2.0 | 1.0 | 650 | $1,400 | $2.15 | 13d | 1 | 1.23mi |
| 40 N Dawes Ave Kingston, PA | 3.0 | 1.5 | 1450 | $1,800 | $1.24 | 21d | 1 | 1.25mi |
Listing history 7 events
-
2026-04-12status Pending
-
2026-03-31price $124,900
-
2026-03-05price $129,900
-
2026-02-25price $134,900
-
2026-02-17$139,900 Active
-
2025-10-02price $139,900
-
2014-09-02soldstatus $47,000
ⓘ Source: listings_history table (triggers on properties + properties_extension) + one-shot
backfill from property_details.listing_events for pre-trigger history.
Tax reassessment forecast PA · Partial reset (capped growth)
- Current annual tax
- $1,835 · $153/mo
- Projected year-2 tax
- $1,904 · $159/mo
- Expected delta
- +$69/yr (+$6/mo · 3.8%)
ⓘ Screening estimate from a state-policy table — verify with the county assessor before closing.
Climate risk First Street
- Flood 8/10 Severe FEMA zone X · 78% chance over 30 yrs
- Wildfire 3/10 Moderate
- Heat 4/10 Moderate 7 d/yr ≥97°F today · 16 d/yr by 30 yrs out
- Wind 3/10 Moderate 5% chance of damaging wind over 30 yrs
- Air quality 3/10 Moderate 2 unhealthy d/yr today · 4 by 30 yrs out
Nearby sold comps map
Loading sold comps map…
Walkable amenities ~0.75 mi
Loading nearby amenities…
Taxation est. · year 1
- Rental income
- $16,318
- − Mortgage interest
- −$6,996
- − Property taxes
- −$1,835
- − Insurance
- −$1,422
- − Repairs & maintenance
- −$1,305
- − Management
- −$1,305
- − Depreciation
- −$3,633
- Taxable loss
- −$180
- Est. tax savings @ 24.0%
- +$43
- After-tax cash flow
- $1,817/yr
For passive investors: Depreciation is non-cash, so a rental often shows a tax loss while cash-flowing — sheltering income. Rental losses are passive: they offset passive income freely, and up to $25,000/yr can offset ordinary (W-2) income if you actively participate and your MAGI is under $100k (phasing out to $0 by $150k); unused losses carry forward. On sale, claimed depreciation is recaptured at up to 25%, and gains may owe capital-gains tax (a 1031 exchange can defer both). Figures are a year-1 estimate at your 24.0% rate — not tax advice; consult a CPA.
Schools (NCES district)
- District
- Wyoming Valley West SD
- NCES district ID
- 4225950
- Math proficiency
- 18% ▼ -11.00%
- Reading proficiency
- 42% ▼ -12.00%
- Median HH income
- $42,437
- Composite
- 25.38/100
- National rank
- #7470
- State rank
- #445 of 539 in PA
Livability — Kingston
- Score
- 81/100
- State rank
- #162
- US rank
- #1345
Category grades
Schools grade is shown separately in the Schools card above.
Census & demographics
- Census place
- Kingston, PA
- County
- Luzerne County · 118,885 people
- City population
- 31,149
- Metro
- Scranton--Wilkes-Barre, PA
- Population (ZIP)
- 31,149
- Household income
- $64,444
- Rent vs Own
- Severe rent burden
- 1454.0
Population outlook (Luzerne County) Hauer SSP2
- Today (2025)
- 319,505 people
- By 2030
- 319,943 · +0.1%
- By 2040
- 322,643 · +1.0%
- By 2050
- 330,817 · +3.5%
- By 2075
- 379,145 · +18.7%
- By 2100
- 431,908 · +35.2%
Race, ethnicity, and origin ACS 2023
- Neighborhood character
- Predominantly White (82%)
- Race & ethnicity
- White 82% Hispanic / Latino 8% Black 6% Two or more races 6%
- Hispanic origin (detail)
- Mexican 1% Puerto Rican 4% Dominican 1%
- Common ancestry
- Romanian 18% Scotch-Irish 4% Italian 2%
- Foreign-born
- 3% · Canada
- Languages at home
- 93% English-only · Spanish 4% Russian/Polish/Slavic 1%
Political lean MEDSL · Luzerne
- 2024 margin
- R (+19.2) · D 40.0% · R 59.2%
- 2008→2024 swing
- -27.6pp toward R · 2008: 8.4pp · 2024: -19.2pp
- All cycles
- 2024: R+19.2 2020: R+14.4 2016: R+19.6 2012: D+4.8 2008: D+8.4
Not yet ingested
- Civics
- —
Market trends
- HPI YoY
- ▼ -154.72%
- Current HPI
- 255.5375
- Rent YoY
- ▲ 4.65%
- Metro
- Scranton--Wilkes-Barre, PA
- State GDP YoY
- ▲ 1.68%
- F500 in state
- 34
Industry mix (Fortune 500 HQ in PA)
| Industry | F500 HQs | Revenue |
|---|---|---|
| Healthcare | 2 | $309B |
|
||
| Insurance | 2 | $27B |
|
||
| Telecommunications / Media | 1 | $124B |
|
||
| Industrial Distribution | 1 | $22B |
|
||
| Financial Services | 1 | $20B |
|
||
| Chemicals / Materials | 1 | $18B |
|
||
Price history
+165.7% since first listed7 events — show timeline
- 2026-04-12 Pending — LCAR
- 2026-03-31 Price Changed $124,900 LCAR
- 2026-03-05 Price Changed $129,900 LCAR
- 2026-02-25 Price Changed $134,900 LCAR
- 2026-02-17 Listed $139,900 LCAR
- 2025-10-02 Price Changed $139,900 LCAR
- 2014-09-02 Sold (Public Records) $47,000 Public Records
Property tax history
+1.8%/yrLatest (2026): $1,835 · +0.4% YoY. Source: county tax records.
Cash-flow waterfall
monthlySold comps — $/sqft
last 12 mo · ≤1 miLoading sold comps…