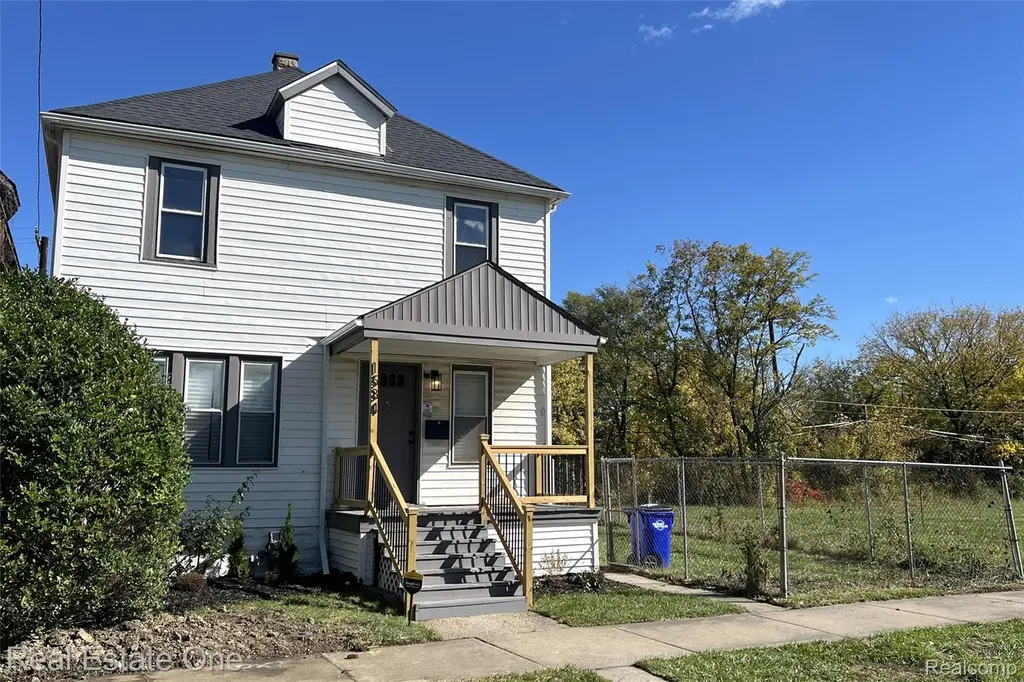
1534 Saint Clair St · Detroit, MI
Flood risk 1/10 · Minimal
- FEMA flood zone
- X (unshaded)
- Chance of flooding over 30 yrs
- 0.0%
- Est. flood insurance / yr
- $473 – $860
Fire risk 1/10 · Minimal
- Est. fire insurance / yr
- $784 – $1,456
Heat risk 3/10 · Minor
- Hot days now (above 96°F)
- 7 days/yr
- Hot days in 30 yrs
- 15 days/yr
Wind risk 2/10 · Minimal
- Chance of severe wind over 30 yrs
- —
Air-quality risk 3/10 · Minor
- Unhealthy air days now
- 2 days/yr
- Unhealthy air days in 30 yrs
- 5 days/yr
Risk factors via First Street. Map © Google.
Why this score? — see what drove the B- grade
The composite is a weighted blend of 9 inputs, each scored 0–100. Each bar is that input's sub-score; the figure is the points it added to the 100-point composite (weight × sub-score).
- Cash flow +28.0/30.0
- 1% rule +10.0/10.0
- DSCR +9.9/10.0
- ARV discount +7.5/15.0
- Livability +3.7/5.0
- Rent growth +2.5/5.0
- Condition / age +2.5/5.0
- Schools +1.3/10.0
- Appreciation +0.0/10.0
$99,900
🖨 Deal sheet 📄 Offer letter ✓ Due diligence
Listing remarks MLS
Wonderful Opportunity to own a completely renovated home in highly desirable East Village! Less then a mile away from many nearby businesses, including Collect Beer Bar, Marrow, Barkside, The Shepard Art Gallery, and Sinbad's Waterfront Restaurant. All of this just minutes from the Detroit River & Marina Disctrict! Less then 10 minutes from Belle Isle, Eastern Market and all the amenities of Downtown Detroit! Inside the home you'll find a beautifully restored kitchen with shaker cabinets and stainless steel appliances. Updated Luxury Plank throughout the first floor ties everything together. Upstairs you'll find 3 bedrooms and a completely updated bath with modern touches. The fenced yard outside also gives privacy. Don't miss this opportunity!
Key facts
- Fenced yard
- Restored kitchen
- Shaker cabinets
Tags
Property features AI
Finance
- Other: Home warranty included
Exterior
- Parking: No garage
- Utilities: Public water; Public sewer
- Home design: Single-family residence; Two levels; Ground-level entry with steps; Vinyl siding
- Construction: Built on block foundation; Asphalt roof; Vinyl siding
- Exterior features: Porch; Back yard fencing; Paved road access
Interior
- Kitchen: Gas cooktop; ENERGY STAR qualified dishwasher; ENERGY STAR qualified refrigerator; Microwave; Disposal; Stainless steel appliances; Refrigerator
- Bathrooms: 1 full bathroom
- Heating & cooling: Hot water heating (natural gas); No cooling
- Interior features: ENERGY STAR qualified dishwasher; ENERGY STAR qualified refrigerator; Stainless steel appliances; Disposal; Microwave; Gas cooktop; Gas water heater; Refrigerator
- Laundry & utility: Gas water heater
Neighborhood map
What this means for you Summary
Snapshot
- This is a 3-bed/1.0-bath single-family listed at $100k.
Deal economics
- At list price, monthly cash flow is $310 ($4k/yr) — positive.
- The deal already cash-flows at list — no discount required.
- Meets the 1% rule at list price ($1k rent vs $100k).
Location & tenants
- Location reads 73/100 on livability (#218 in MI) — a middle-class / working-renter tenant base. Strengths: amenities A+, commute A+, cost of living A+; Watch: schools F, crime F, employment F.
- Detroit Public Schools Community District (urban): math 10% / reading 24% proficiency, ranked #499 of 540 in MI (top 92%) — low school quality limits family demand, transient renter base, plan for 1-2y turnover; 90% free/reduced lunch — lower-income household profile, screen leases tightly.
- Market conditions: 298 active listings in the ZIP; 29 comparable units currently listed for rent nearby; rentals lingering (median 44d on market — plan ~5-8 weeks vacancy on turnover, expect pricing pressure); 55% of comp listings sitting > 30 days — soft ceiling on asking rent; lower-income renter base — watch delinquency; 2,639 units permitted in Wayne County in 2024 (1,216 in 5+ unit buildings).
- At $1,499/mo this rent would consume 54% of the median local household income ($34k/yr) (locally 1364% of renters already pay >50% of income on rent) — very limited rent-growth headroom before tenants either downsize or default.
Forward outlook
- Local home prices are declining (-3.0%/yr); year-one equity from $691 of loan paydown is wiped out by about $3k of value loss. Plan a longer hold.
- Wayne County population projected at -17% by 2050 — secular population decline; favor cash flow + early exit over multi-decade hold.
- At projected returns (-3.0% appreciation + 3.0% rent growth), your $28k cash investment doubles in ~9 years — after that, you're playing with house money.
Negotiation context
- Only 5 days on market — expect competitive offers; lowballing is unlikely to land.
- 6 sale attempts since 2y ago with the ask held roughly flat each time — persistent listings suggest the price (not the market) is what's stuck; bring a comps-based counter.
- Current owner paid $50k; list at $100k implies a 100% gain — meaningful room to come down on a strong offer.
Risks & watch-outs
- Watch-outs: property tax is 3.7% of price; built in 1912 — expect roof / HVAC / electrical / plumbing capex.
Questions for the listing agent
- Built in 1912 — when were the roof, HVAC, electrical panel, plumbing, and water heater last replaced?
- Property tax is high relative to price — has the assessment been appealed recently, and will the sale trigger a re-assessment?
- Is there a deadline driving the sale (1031 exchange, divorce, estate, relocation)? That informs how much negotiation room exists.
- Schools are F-rated, which usually means shorter tenancies and higher turnover. Who's the typical renter profile here, and what's been the actual vacancy rate?
- Crime grade is F in this area — have there been break-ins, vandalism, or insurance claims at this property in the last 3 years? What carrier currently insures it and at what premium?
- What's the average days-on-market for RENTAL listings here right now (not sales)? A rising rental-DOM trend means longer vacancies and softer asking-rent achievability than the comps imply.
- What's the recent tenant-quality profile in this submarket — average credit score on applications, eviction rate, late-payment / NSF rate, and stable-employment percentage? A property-management company in the area should have these aggregated.
- How much new for-sale + rental construction is in the pipeline within 1–3 miles? Heavy new supply typically softens prices + rents 12–24 months out; constrained supply supports both.
Investment metrics
- 1% rule
- 1.50% ✓
- Cap rate
- 10.02%
- Cash-on-cash
- 13.32%
- DSCR
- 1.59
- GRM
- 5.6
CMA / ARV
- ARV (on-the-fly)
- $57,792
- Comps found
- 11
Show comp detail 11 sales within ~0.75 mi
| Address | Dist | Beds/Ba | Sqft | Sold | Price | $/sf | Match |
|---|---|---|---|---|---|---|---|
| 1534 Saint Clair St | 0.00mi | 3/1.0 | 1,344 (0%) | 20mo | $38,000 | $28 | 83 |
| 1451 Bewick St | 0.18mi | 3/1.0 | 1,334 (-1%) | 21mo | $10,000 | $7 | 73 |
| 9385 Dorchester St | 0.53mi | 3/2.0 | 1,311 (-2%) | 6mo | $18,000 | $14 | 63 |
| 2539 Harding St | 0.30mi | 3/1.0 | 1,378 (+2%) | 24mo | $38,000 | $28 | 62 |
| 2254 Lillibridge St | 0.40mi | 3/1.0 | 1,184 (-12%) | 2mo | $105,000 | $89 | 60 |
| 1641 Lillibridge St | 0.30mi | 3/1.5 | 1,400 (+4%) | 23mo | $60,000 | $43 | 58 |
| 3466 Bewick St | 0.69mi | 3/2.0 | 1,308 (-3%) | 6mo | $119,900 | $92 | 54 |
| 3459 Saint Clair St | 0.68mi | 3/2.0 | 1,250 (-7%) | 7mo | $119,900 | $96 | 47 |
| 2595 Bewick St | 0.39mi | 3/1.0 | 1,500 (+12%) | 22mo | $9,000 | $6 | 44 |
| 1771 Hibbard St | 0.65mi | 2/1.5 (-1) | 1,200 (-11%) | 3mo | $80,000 | $67 | 42 |
| 1297 Belvidere St | 0.56mi | 3/1.5 | 1,479 (+10%) | 20mo | $125,000 | $85 | 38 |
Match score weights: distance 35% · size 25% · config 20% · recency 20%. Top-matched comps best support the ARV.
Projected returns pro-forma
-3.0% appreciation · 3.0% rent growth · sell at horizon
- IRR
- 3.4%
- Equity multiple
- 1.13×
- Total profit
- $3,722
- Equity at exit
- $14,895
- IRR
- 13.1%
- Equity multiple
- 2.05×
- Total profit
- $29,254
- Equity at exit
- $8,638
Cash invested: $27,972 (down + closing). Projections, not guarantees.
Landlord ↔ Tenant lean methodology
- Overall (STATE)
- 62 Landlord-Friendly
- State Michigan
- 62 Landlord-Friendly · EVEN
- County
- — inherits STATE
- City
- — inherits STATE
ZIP-level market 48214
- Active inventory
- 298
- Price-to-rent
- 5.6×
Monthly cashflow live
- Estimated rent
- $1,499 high interval (Pro) →
- Mortgage (P&I)
- −$524
- Tax from tax record
- −$308 /mo · $3,700/yr
- Insurance
- −$42
- HOA
- −$0
- Vacancy / Maint / Mgmt
- −$315
- Net cashflow
- $310
Break-even live
UW: 25.0% down · 7.5% · 30yr · 1.5% tax · 5.0% vac · 8.0% maint · 8.0% mgmt
Financing live
Cash to close
- Down payment
- $24,975
- Closing costs
- $2,997
- Reserves months
- —
- Total cash needed
- —
Loan-product check · same deal, 3 products live
Conventional
25% down · 7.5% · 30yr
- Down + closing
- —
- Monthly P&I
- —
- Monthly cashflow
- —
- DSCR
- —
- Eligible?
- —
Personal DTI + credit; lowest rate.
DSCR
20% down · 8.5% · 30yr
- Down + closing
- —
- Monthly P&I
- —
- Monthly cashflow
- —
- DSCR
- —
- Eligible?
- —
No personal income docs; deal must DSCR.
Hard money
10% down · 12.0% · 12mo
- Down + closing
- —
- Monthly P&I
- —
- Monthly cashflow
- —
- DSCR
- —
- Eligible?
- —
Short-term bridge; refi at stabilization.
Rent comps 29 comps
| Address | Beds | Baths | Sqft | Rent | $/sqft | DOM | Units | Dist |
|---|---|---|---|---|---|---|---|---|
| 2544 Cadillac Blvd Unit 2 Detroit, MI | 2.0 | 1.0 | 973 | $825 | $0.85 | 24d | 1 | 0.41mi |
| 450 Marquette Dr Detroit, MI | 2.0 | 1.0 | 972 | $1,200 | $1.23 | 20d | 1 | 0.50mi |
| 15111 E Vernor Hwy Unit 6 Detroit, MI | 2.0 | 1.0 | 900 | $1,200 | $1.33 | 24d | 1 | 0.50mi |
| 2282 Belvidere St Unit 102 Detroit, MI | 2.0 | 2.0 | 1000 | $1,250 | $1.25 | 44d | 1 | 0.57mi |
| 3032 Hurlbut St Unit 1 Detroit, MI | 2.0 | 1.0 | 950 | $900 | $0.95 | 3d | 1 | 0.60mi |
| 8925 E Jefferson Ave Detroit, MI | 1.0–2.0 | 1.0–2.0 | 1050 | $1,945 | $1.85 | 44d | 9 | 0.65mi |
| 8845 E Jefferson Ave Unit 207 Detroit, MI | 2.0 | 1.5 | 1500 | $1,695 | $1.13 | 44d | 1 | 0.70mi |
| 8845 E Jefferson Ave Unit 205 Detroit, MI | 2.0 | 1.5 | 960 | $1,425 | $1.48 | 44d | 1 | 0.70mi |
| 8845 E Jefferson Ave Unit 302 Detroit, MI | 2.0 | 2.0 | 885 | $1,460 | $1.65 | 44d | 1 | 0.70mi |
| 8845 E Jefferson Ave Unit 203 Detroit, MI | 2.0 | 1.5 | 1024 | $1,515 | $1.48 | 44d | 1 | 0.70mi |
| 8845 E Jefferson Ave Unit 206 Detroit, MI | 2.0 | 1.5 | 1230 | $1,660 | $1.35 | 44d | 1 | 0.70mi |
| 8845 E Jefferson Ave Unit 204 Detroit, MI | 2.0 | 1.5 | 1150 | $2,350 | $2.04 | 44d | 1 | 0.70mi |
| 8845 E Jefferson Apt 208 Detroit, MI | 2.0 | 1.5 | 992 | $1,635 | $1.65 | 44d | 1 | 0.70mi |
| 3495 Garland St Detroit, MI | 2.0 | 1.0 | 1100 | $900 | $0.82 | 44d | 1 | 0.73mi |
| 3501 Garland St Detroit, MI | 2.0 | 1.0 | 1000 | $900 | $0.90 | 24d | 1 | 0.74mi |
| 3475 Crane St Detroit, MI | 3.0 | 1.5 | 1000 | $1,338 | $1.34 | 44d | 1 | 0.99mi |
| 3937 Beniteau St Detroit, MI | 2.0 | 1.0 | 900 | $950 | $1.06 | 15d | 1 | 1.06mi |
| 3937 Beniteau St Unit 1 Detroit, MI | 2.0 | 1.0 | 1250 | $900 | $0.72 | 44d | 1 | 1.06mi |
| 4190 Hurlbut St Unit 2 Detroit, MI | 2.0 | 1.0 | 900 | $945 | $1.05 | 15d | 1 | 1.08mi |
| 8001 Kercheval Ave Detroit, MI | 1.0–2.0 | 1.0–2.0 | 984 | $2,270 | $2.31 | 2d | 3 | 1.14mi |
| 4055 Beniteau St Detroit, MI | 2.0 | 1.0 | 1000 | $900 | $0.90 | 17d | 1 | 1.17mi |
| 8100 E Jefferson Ave Detroit, MI | 3.0 | 1.0–3.0 | 1089 | $2,210 | $2.03 | 19d | 20 | 1.20mi |
| 4487 French Rd Detroit, MI | 4.0 | 2.0 | 1280 | $1,800 | $1.41 | 44d | 1 | 1.25mi |
| 7918 E Lafayette St #4 Detroit, MI | 3.0 | 1.0 | 1150 | $1,800 | $1.57 | 18d | 1 | 1.25mi |
| 8843 E Canfield St Detroit, MI | 4.0 | 2.0 | 1200 | $2,400 | $2.00 | 44d | 1 | 1.34mi |
| 4169 Burns St Detroit, MI | 4.0 | 2.5 | 1326 | $2,300 | $1.73 | 24d | 1 | 1.34mi |
| 1454 Townsend St #101 Detroit, MI | 2.0 | 2.0 | 1268 | $2,500 | $1.97 | 3d | 1 | 1.37mi |
| 7700 E Jefferson Ave Detroit, MI | 2.0 | 1.0 | 877 | $1,795 | $2.05 | 44d | 1 | 1.42mi |
| 7410 Kercheval Ave Unit 212 Detroit, MI | 2.0 | 2.0 | 1017 | $1,950 | $1.92 | 44d | 1 | 1.42mi |
Listing history 5 events
-
2026-06-13statusdays on market $99,900 Pending 5 DOM
-
2026-06-09days on market $99,900 Active 3 DOM
-
2026-06-08days on market $99,900 Active 2 DOM
-
2026-06-07remarks 677-char remark
-
2026-06-07$99,900 Active 1 DOM
ⓘ Source: listings_history table (triggers on properties + properties_extension) + one-shot
backfill from property_details.listing_events for pre-trigger history.
Tax reassessment forecast MI · Partial reset (capped growth)
- Current annual tax
- $3,700 · $308/mo
- Projected year-2 tax
- $3,700 · $308/mo
- Expected delta
- $0/yr ($0/mo · 0.0%)
ⓘ Screening estimate from a state-policy table — verify with the county assessor before closing.
Climate risk First Street
- Flood 1/10 Low FEMA zone X (unshaded) · 0% chance over 30 yrs
- Wildfire 1/10 Low
- Heat 3/10 Moderate 7 d/yr ≥96°F today · 15 d/yr by 30 yrs out
- Wind 2/10 Low
- Air quality 3/10 Moderate 2 unhealthy d/yr today · 5 by 30 yrs out
Nearby sold comps map
Loading sold comps map…
Walkable amenities ~0.75 mi
Loading nearby amenities…
Taxation est. · year 1
- Rental income
- $17,990
- − Mortgage interest
- −$5,596
- − Property taxes
- −$3,700
- − Insurance
- −$500
- − Repairs & maintenance
- −$1,439
- − Management
- −$1,439
- − Depreciation
- −$2,906
- Taxable income
- $2,410
- Est. tax owed @ 24.0%
- −$578
- After-tax cash flow
- $3,147/yr
For passive investors: Depreciation is non-cash, so a rental often shows a tax loss while cash-flowing — sheltering income. Rental losses are passive: they offset passive income freely, and up to $25,000/yr can offset ordinary (W-2) income if you actively participate and your MAGI is under $100k (phasing out to $0 by $150k); unused losses carry forward. On sale, claimed depreciation is recaptured at up to 25%, and gains may owe capital-gains tax (a 1031 exchange can defer both). Figures are a year-1 estimate at your 24.0% rate — not tax advice; consult a CPA.
Schools (NCES district)
- District
- Detroit Public Schools Community District
- NCES district ID
- 2601103
- Math proficiency
- 10% ▼ -2.00%
- Reading proficiency
- 24% ▲ 6.00%
- Median HH income
- $25,815
- Composite
- 13.06/100
- National rank
- #9564
- State rank
- #499 of 540 in MI
Livability — Detroit
- Score
- 73/100
- State rank
- #218
- US rank
- #5427
Category grades
Schools grade is shown separately in the Schools card above.
Census & demographics
- Census place
- Detroit, MI
- County
- Wayne County · 1,562,939 people
- City population
- 572,865
- Metro
- Detroit-Warren-Dearborn, MI
- Population (ZIP)
- 18,595
- Household income
- $33,544
- Rent vs Own
- Severe rent burden
- 1364.0
Population outlook (Wayne County) Hauer SSP2
- Today (2025)
- 1,675,273 people
- By 2030
- 1,620,300 · -3.3%
- By 2040
- 1,502,341 · -10.3%
- By 2050
- 1,384,039 · -17.4%
- By 2075
- 1,124,592 · -32.9%
- By 2100
- 881,193 · -47.4%
Race, ethnicity, and origin ACS 2023
- Neighborhood character
- Predominantly Black (79%)
- Race & ethnicity
- Black 79% White 16% Two or more races 4%
- Common ancestry
- Romanian 1% Iranian 1% Lithuanian 1%
- Foreign-born
- 3% · Canada, Jamaica
- Languages at home
- 98% English-only · Spanish 1%
Political lean MEDSL · Wayne
- 2024 margin
- Strong D (+29.0) · D 62.7% · R 33.7% · Other 3.6%
- 2008→2024 swing
- -20.5pp toward R · 2008: 49.5pp · 2024: 29.0pp
- All cycles
- 2024: D+29.0 2020: D+38.1 2016: D+37.3 2012: D+46.9 2008: D+49.5
Not yet ingested
- Civics
- —
Market trends
- HPI YoY
- ▼ -367.43%
- Current HPI
- 102.0969
- Rent YoY
- —
- Metro
- Detroit-Warren-Dearborn, MI
- State GDP YoY
- ▲ 1.37%
- F500 in state
- 28
Industry mix (Fortune 500 HQ in MI)
| Industry | F500 HQs | Revenue |
|---|---|---|
| Automotive Parts | 3 | $48B |
|
||
| Automotive | 2 | $372B |
|
||
| Chemicals | 1 | $45B |
|
||
| Automotive Retail | 1 | $29B |
|
||
| Healthcare / Medical Devices | 1 | $23B |
|
||
| Automotive Technology | 1 | $20B |
|
||
Price history
+99.8% since first listed20 events — show timeline
- 2026-06-06 Listed $99,900 REALCOMP
- 2026-06-06 Listed $99,900 MiRealSource-MiMLS
- 2026-04-23 Listing Removed — REALCOMP
- 2026-04-23 Listing Removed — MiRealSource-MiMLS
- 2026-01-28 Price Changed $110,000 MiRealSource-MiMLS
- 2026-01-28 Price Changed $110,000 REALCOMP
- 2025-11-08 Price Changed $125,000 MiRealSource-MiMLS
- 2025-11-07 Price Changed $125,000 REALCOMP
- 2025-11-02 Price Changed $139,900 MiRealSource-MiMLS
- 2025-11-01 Price Changed $139,900 REALCOMP
- 2025-10-24 Listed $150,000 MiRealSource-MiMLS
- 2025-10-24 Listed $150,000 REALCOMP
- 2025-10-22 Coming Soon — MiRealSource-MiMLS
- 2024-11-18 Sold (Public Records) $50,000 Public Records
- 2024-10-04 Sold (MLS) $38,000 MiRealSource-MiMLS
- 2024-10-04 Sold (MLS) $38,000 REALCOMP
- 2024-04-01 Pending — MiRealSource-MiMLS
- 2024-04-01 Pending — REALCOMP
- 2024-03-14 Listed $50,000 MiRealSource-MiMLS
- 2024-03-14 Listed $50,000 REALCOMP
Property tax history
+21.7%/yrLatest (2025): $3,700 · +589.6% YoY. Source: county tax records.
Cash-flow waterfall
monthlySold comps — $/sqft
last 12 mo · ≤1 miLoading sold comps…