610 Quail St · Smithfield, VA
Flood risk 1/10 · Minimal
- FEMA flood zone
- X (unshaded)
- Chance of flooding over 30 yrs
- 0.0%
- Est. flood insurance / yr
- $507 – $1,088
Fire risk 4/10 · Minor
- Est. fire insurance / yr
- $666 – $1,236
Heat risk 8/10 · Major
- Hot days now (above 106°F)
- 7 days/yr
- Hot days in 30 yrs
- 16 days/yr
Wind risk 8/10 · Major
- Chance of severe wind over 30 yrs
- 80.0%
Air-quality risk 1/10 · Minimal
- Unhealthy air days now
- 0 days/yr
- Unhealthy air days in 30 yrs
- 0 days/yr
Risk factors via First Street. Map © Google.
Why this score? — see what drove the B- grade
The composite is a weighted blend of 9 inputs, each scored 0–100. Each bar is that input's sub-score; the figure is the points it added to the 100-point composite (weight × sub-score).
- Cash flow +29.2/30.0
- DSCR +10.0/10.0
- ARV discount +8.6/15.0
- 1% rule +7.0/10.0
- Schools +5.9/10.0
- Livability +3.9/5.0
- Rent growth +2.5/5.0
- Condition / age +2.5/5.0
- Appreciation +0.0/10.0
$200,000
🖨 Deal sheet 📄 Offer letter ✓ Due diligence
Listing remarks
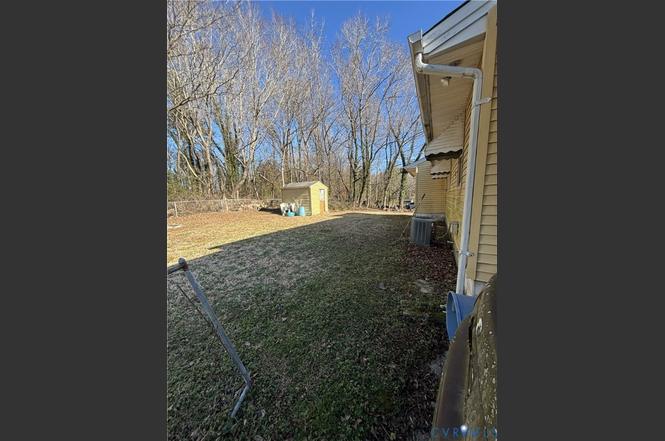
* INVESTOR SPECIAL * Come bring your new vision to Smithfield! Property sold as-is, where-is. No repairs made by seller. All outbuildings, garages, sheds, flues and chimneys convey as-is. Subject to short sale.
Key facts
- 5,845 sq ft lot
- Built 1950
- Listed 3 days
Neighborhood map
What this means for you Summary
Snapshot
- This is a 3-bed/1.0-bath single-family listed at $200k.
Deal economics
- At list price, monthly cash flow is $700 ($8k/yr) — positive.
- The deal already cash-flows at list — no discount required.
- Meets the 1% rule at list price ($2k rent vs $200k).
- Cap rate 10.5% vs local median 2.6% in Smithfield — top-decile yield for the area; either an underpriced asset or a hidden risk that comps aren't pricing in. Stress-test before assuming the spread holds.
Location & tenants
- Location reads 78/100 on livability (#82 in VA, #2,722 nationally) — a middle-class / working-renter tenant base. Strengths: employment A+, housing A+, health & safety A+; Watch: amenities F, commute F.
- Isle Of Wight County Public School District (rural): math 62% / reading 73% proficiency, ranked #28 of 131 in VA (top 21%) — acceptable for families but not a draw, mixed tenant base, ~2y average lease.
- Market conditions: 207 active listings in the ZIP; 2 comparable units currently listed for rent nearby; 257 units permitted in Isle of Wight County in 2024 (0 in 5+ unit buildings).
Forward outlook
- Local home prices are declining (-3.0%/yr); year-one equity from $1k of loan paydown is wiped out by about $6k of value loss. Plan a longer hold.
- Isle of Wight County population projected at +10% by 2050 — modest demand growth; plan on rents tracking national, not racing it.
- At projected returns (-3.0% appreciation + 3.0% rent growth), your $56k cash investment doubles in ~8 years — after that, you're playing with house money.
Negotiation context
- Only 3 days on market — expect competitive offers; lowballing is unlikely to land.
Risks & watch-outs
- Watch-outs: built in 1950 — expect roof / HVAC / electrical / plumbing capex.
- Climate carrying-cost: severe wind risk, 80% chance of damaging wind over 30y; extreme-heat days projected 7→16/yr by 2055 (HVAC capex compounding) — expect insurance premiums to compound above CPI over the hold.
Questions for the listing agent
- Built in 1950 — when were the roof, HVAC, electrical panel, plumbing, and water heater last replaced?
- Is there a deadline driving the sale (1031 exchange, divorce, estate, relocation)? That informs how much negotiation room exists.
- Schools are B-rated — typically a magnet for longer-tenancy family renters. What's the average tenant stay here, and is there a school-zone premium baked into asking?
- What's the average days-on-market for RENTAL listings here right now (not sales)? A rising rental-DOM trend means longer vacancies and softer asking-rent achievability than the comps imply.
- What's the recent tenant-quality profile in this submarket — average credit score on applications, eviction rate, late-payment / NSF rate, and stable-employment percentage? A property-management company in the area should have these aggregated.
- How much new for-sale + rental construction is in the pipeline within 1–3 miles? Heavy new supply typically softens prices + rents 12–24 months out; constrained supply supports both.
Investment metrics
- 1% rule
- 1.20% ✓
- Cap rate
- 10.49%
- Cash-on-cash
- 14.99%
- DSCR
- 1.67
- GRM
- 6.9
CMA / ARV
- ARV (on-the-fly)
- $204,960
- Comps found
- 4
Show comp detail 4 sales within ~0.75 mi
| Address | Dist | Beds/Ba | Sqft | Sold | Price | $/sf | Match |
|---|---|---|---|---|---|---|---|
| 611 Quail St | 0.02mi | 3/2.0 | 1,153 (+3%) | 6mo | $325,000 | $282 | 84 |
| 12276 Great Spring Rd | 0.31mi | 3/1.0 | 1,072 (-4%) | 11mo | $120,000 | $112 | 69 |
| 205 Hillcrest (and Parcel 21a-09-028 Dr | 0.05mi | 3/1.0 | 1,283 (+15%) | 11mo | $210,000 | $164 | 64 |
| 889 W Main St | 0.57mi | 3/1.0 | 1,092 (-2%) | 8mo | $200,000 | $183 | 62 |
Match score weights: distance 35% · size 25% · config 20% · recency 20%. Top-matched comps best support the ARV.
Projected returns pro-forma
-3.0% appreciation · 3.0% rent growth · sell at horizon
- IRR
- 5.6%
- Equity multiple
- 1.22×
- Total profit
- $12,076
- Equity at exit
- $29,821
- IRR
- 14.9%
- Equity multiple
- 2.21×
- Total profit
- $67,581
- Equity at exit
- $17,292
Cash invested: $56,000 (down + closing). Projections, not guarantees.
Landlord ↔ Tenant lean methodology
- Overall (STATE)
- 55 Moderately Landlord-Leaning
- State Virginia
- 55 Moderately Landlord-Leaning · D+2
- County
- — inherits STATE
- City
- — inherits STATE
ZIP-level market 23430
- Home prices YoY
- -17.2%
- Active inventory
- 207
- Price-to-rent
- 6.9×
Monthly cashflow live
- Estimated rent
- $2,401 medium interval (Pro) →
- Mortgage (P&I)
- −$1,049
- Tax from tax record
- −$65 /mo · $776/yr
- Insurance
- −$83
- HOA
- −$0
- Vacancy / Maint / Mgmt
- −$504
- Net cashflow
- $700
Break-even live
UW: 25.0% down · 7.5% · 30yr · 1.5% tax · 5.0% vac · 8.0% maint · 8.0% mgmt
Financing live
Cash to close
- Down payment
- $50,000
- Closing costs
- $6,000
- Reserves months
- —
- Total cash needed
- —
Loan-product check · same deal, 3 products live
Conventional
25% down · 7.5% · 30yr
- Down + closing
- —
- Monthly P&I
- —
- Monthly cashflow
- —
- DSCR
- —
- Eligible?
- —
Personal DTI + credit; lowest rate.
DSCR
20% down · 8.5% · 30yr
- Down + closing
- —
- Monthly P&I
- —
- Monthly cashflow
- —
- DSCR
- —
- Eligible?
- —
No personal income docs; deal must DSCR.
Hard money
10% down · 12.0% · 12mo
- Down + closing
- —
- Monthly P&I
- —
- Monthly cashflow
- —
- DSCR
- —
- Eligible?
- —
Short-term bridge; refi at stabilization.
Rent comps 2 comps
| Address | Beds | Baths | Sqft | Rent | $/sqft | DOM | Units | Dist |
|---|---|---|---|---|---|---|---|---|
| 338 Main St Unit A Smithfield, VA | 2.0 | 1.0 | 1250 | $2,000 | $1.60 | 23d | 1 | 0.47mi |
| 108 S Mason St Smithfield, VA | 3.0 | 2.0 | 1344 | $2,995 | $2.23 | 43d | 1 | 0.65mi |
Listing history 2 events
-
2026-02-23status Pending
-
2026-02-20$200,000 Active
ⓘ Source: listings_history table (triggers on properties + properties_extension) + one-shot
backfill from property_details.listing_events for pre-trigger history.
Tax reassessment forecast VA · Resets to sale price
- Current annual tax
- $776 · $65/mo
- Projected year-2 tax
- $1,640 · $137/mo
- Expected delta
- +$864/yr (+$72/mo · 111.4%)
ⓘ Screening estimate from a state-policy table — verify with the county assessor before closing.
Climate risk First Street
- Flood 1/10 Low FEMA zone X (unshaded) · 0% chance over 30 yrs
- Wildfire 4/10 Moderate
- Heat 8/10 Severe 7 d/yr ≥106°F today · 16 d/yr by 30 yrs out
- Wind 8/10 Severe 80% chance of damaging wind over 30 yrs
- Air quality 1/10 Low 0 unhealthy d/yr today · 0 by 30 yrs out
Nearby sold comps map
Loading sold comps map…
Walkable amenities ~0.75 mi
Loading nearby amenities…
Taxation est. · year 1
- Rental income
- $28,807
- − Mortgage interest
- −$11,203
- − Property taxes
- −$776
- − Insurance
- −$1,000
- − Repairs & maintenance
- −$2,305
- − Management
- −$2,305
- − Depreciation
- −$5,818
- Taxable income
- $5,401
- Est. tax owed @ 24.0%
- −$1,296
- After-tax cash flow
- $7,100/yr
For passive investors: Depreciation is non-cash, so a rental often shows a tax loss while cash-flowing — sheltering income. Rental losses are passive: they offset passive income freely, and up to $25,000/yr can offset ordinary (W-2) income if you actively participate and your MAGI is under $100k (phasing out to $0 by $150k); unused losses carry forward. On sale, claimed depreciation is recaptured at up to 25%, and gains may owe capital-gains tax (a 1031 exchange can defer both). Figures are a year-1 estimate at your 24.0% rate — not tax advice; consult a CPA.
Schools (NCES district)
- District
- Isle Of Wight County Public School District
- NCES district ID
- 5102010
- Math proficiency
- 62% ▼ -21.00%
- Reading proficiency
- 73% ▼ -7.00%
- Median HH income
- $64,756
- Composite
- 58.67/100
- National rank
- #982
- State rank
- #28 of 131 in VA
Livability — Smithfield
- Score
- 78/100
- State rank
- #82
- US rank
- #2722
Category grades
Schools grade is shown separately in the Schools card above.
Census & demographics
- Census place
- Smithfield, VA
- Population (ZIP)
- 19,057
Population outlook (Isle of Wight County) Hauer SSP2
- Today (2025)
- 39,005 people
- By 2030
- 40,089 · +2.8%
- By 2040
- 41,703 · +6.9%
- By 2050
- 42,745 · +9.6%
- By 2075
- 47,222 · +21.1%
- By 2100
- 47,810 · +22.6%
Race, ethnicity, and origin ACS 2023
- Neighborhood character
- Predominantly White (70%)
- Race & ethnicity
- White 70% Black 23% Two or more races 4% Hispanic / Latino 3%
- Common ancestry
- Italian 4% Slovak 3% Romanian 2%
- Foreign-born
- 3% · Canada
- Languages at home
- 97% English-only · Spanish 2%
Political lean MEDSL · Isle of Wight
- 2024 margin
- R (+19.8) · D 39.6% · R 59.4%
- 2008→2024 swing
- -6.4pp toward R · 2008: -13.4pp · 2024: -19.8pp
- All cycles
- 2024: R+19.8 2020: R+18.4 2016: R+21.0 2012: R+14.7 2008: R+13.4
Not yet ingested
- Civics
- —
Market trends
- HPI YoY
- ▼ -58.15%
- Current HPI
- 280.3343
- Rent YoY
- —
- Metro
- —
- State GDP YoY
- ▲ 2.40%
- F500 in state
- 50
Industry mix (Fortune 500 HQ in VA)
| Industry | F500 HQs | Revenue |
|---|---|---|
| Aerospace / Defense | 4 | $236B |
|
||
| Technology / Defense | 3 | $32B |
|
||
| Financial Services | 2 | $176B |
|
||
| Utilities | 2 | $27B |
|
||
| Insurance | 2 | $25B |
|
||
| Technology | 2 | $15B |
|
||
Price history
2 events — show timeline
- 2026-02-23 Pending — CVRMLS
- 2026-02-20 Listed $200,000 CVRMLS
Property tax history
+1.5%/yrLatest (2025): $776 · +1336.6% YoY. Source: county tax records.
Cash-flow waterfall
monthlySold comps — $/sqft
last 12 mo · ≤1 miLoading sold comps…