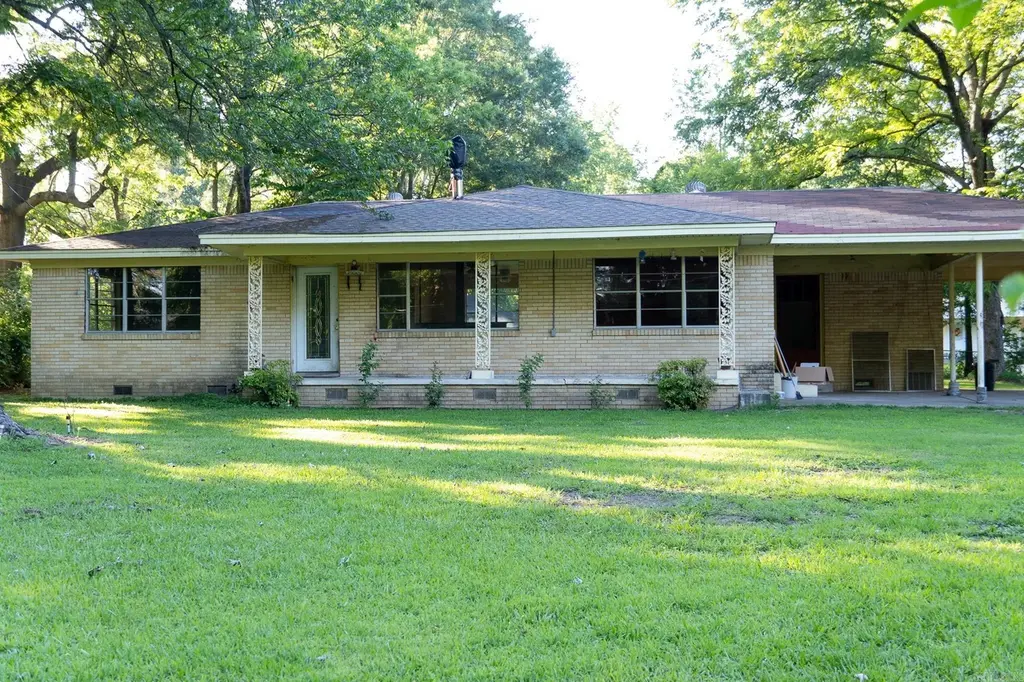
208 E 3rd St · Ward, AR
Flood risk 1/10 · Minimal
- FEMA flood zone
- X (unshaded)
- Chance of flooding over 30 yrs
- 0.0%
- Est. flood insurance / yr
- $507 – $1,088
Fire risk 4/10 · Minor
- Est. fire insurance / yr
- $1,499 – $2,785
Heat risk 6/10 · Moderate
- Hot days now (above 109°F)
- 7 days/yr
- Hot days in 30 yrs
- 19 days/yr
Wind risk 4/10 · Minor
- Chance of severe wind over 30 yrs
- 9.0%
Air-quality risk 2/10 · Minimal
- Unhealthy air days now
- 1 days/yr
- Unhealthy air days in 30 yrs
- 1 days/yr
Risk factors via First Street. Map © Google.
Why this score? — see what drove the B+ grade
The composite is a weighted blend of 9 inputs, each scored 0–100. Each bar is that input's sub-score; the figure is the points it added to the 100-point composite (weight × sub-score).
- Cash flow +27.4/30.0
- ARV discount +15.0/15.0
- DSCR +9.6/10.0
- Appreciation +7.7/10.0
- 1% rule +6.6/10.0
- Schools +4.0/10.0
- Livability +3.5/5.0
- Rent growth +2.5/5.0
- Condition / age +2.5/5.0
$125,000
🖨 Deal sheet 📄 Offer letter ✓ Due diligence
Listing remarks
Welcome to an outstanding investment opportunity in the heart of Ward. This home is a classic fixer-upper with serious upside potential for the savvy buyer. Situated on a generous lot in an established neighborhood, this property is ready for transformation and offers the perfect canvas for renovation, resale, or long-term rental income. With solid bones and a functional layout, the home invites vision and creativity to bring it back to life and maximize its value. The location adds to the appeal, with convenient access to local amenities and steady demand in the area. Whether you’re a seasoned investor or looking for your next project, opportunities like this are getting harder to fi
Key facts
- 1 acre lot
- Built 1961
- Listed 69 days
Property features AI
Exterior
- Parking: Carport
- Utilities: Public sewer; Public water; Electric co-op service; Natural gas
- Home design: Single-family property
- Construction: 3-tab shingle roof; Crawl space foundation with piers
- Exterior features: Brick exterior; Corner lot; Gravel road access; Located inside city limits
Interior
- Flooring: Wood
- Bathrooms: 1 full bathroom; 1 half bathroom
- Heating & cooling: Central air (electric); Central heat with wood-burning option
- Interior features: Wood floors; Wood-burning stove
- Laundry & utility: Laundry room
Neighborhood map
What this means for you Summary
Snapshot
- This is a 3-bed/1.5-bath single-family listed at $125k.
Deal economics
- At list price, monthly cash flow is $364 ($4k/yr) — positive.
- The deal already cash-flows at list — no discount required.
- Meets the 1% rule at list price ($1k rent vs $125k).
- Recommended offer: $118k (6.0% below list) — sets the bar for market timing.
- Cap rate 9.8% vs local median 4.9% in Ward — top-decile yield for the area; either an underpriced asset or a hidden risk that comps aren't pricing in. Stress-test before assuming the spread holds.
Location & tenants
- Location reads 69/100 on livability (#66 in AR) — a middle-class / working-renter tenant base. Strengths: cost of living A+, housing A+, crime B; Watch: amenities F, commute F.
- Cabot School District (suburban): math 48% / reading 43% proficiency, ranked #29 of 238 in AR (top 12%) — families likely to look elsewhere, expect single-tenant / working-renter base with shorter leases.
- Market conditions: 147 active listings in the ZIP; 10 comparable units currently listed for rent nearby; rentals at typical pace (median 24d on market — plan ~3-4 weeks tenant-placement turnaround); 185 units permitted in Lonoke County in 2024 (0 in 5+ unit buildings).
Forward outlook
- In year one you build about $8k of equity ($864 loan paydown + $7k appreciation (5.3% local appreciation)).
- Lonoke County population projected at +12% by 2050 — modest demand growth; plan on rents tracking national, not racing it.
- At projected returns (5.3% appreciation + 3.0% rent growth), your $35k cash investment doubles in ~3 years — after that, you're playing with house money.
- By year 5, paydown + projected appreciation supports a ~$33k cash-out refi (75% LTV) — recoverable capital for the next deal without selling this one.
Negotiation context
- It's been on market 69 days — a 6% lower offer ($118k) is reasonable based on typical stale-listing flexibility.
- 2 sale attempts since 2y ago with the ask held roughly flat each time — persistent listings suggest the price (not the market) is what's stuck; bring a comps-based counter.
- Current owner paid $50k; list at $125k implies a 150% gain — meaningful room to come down on a strong offer.
Risks & watch-outs
- Climate carrying-cost: extreme-heat days projected 7→19/yr by 2055 (HVAC capex compounding) — expect insurance premiums to compound above CPI over the hold.
Questions for the listing agent
- It's been on market 69 days. Have you received any prior offers? Is the seller open to a 6% concession, seller financing, or rate buy-down credit?
- Built in 1961 — when were the roof, HVAC, electrical panel, plumbing, and water heater last replaced?
- Why hasn't it sold? Are there any deal-killer items the seller is aware of (foundation, flood, title, zoning, code violations)?
- Is there a deadline driving the sale (1031 exchange, divorce, estate, relocation)? That informs how much negotiation room exists.
- What's the average days-on-market for RENTAL listings here right now (not sales)? A rising rental-DOM trend means longer vacancies and softer asking-rent achievability than the comps imply.
- What's the recent tenant-quality profile in this submarket — average credit score on applications, eviction rate, late-payment / NSF rate, and stable-employment percentage? A property-management company in the area should have these aggregated.
- How much new for-sale + rental construction is in the pipeline within 1–3 miles? Heavy new supply typically softens prices + rents 12–24 months out; constrained supply supports both.
Investment metrics
- 1% rule
- 1.16% ✓
- Cap rate
- 9.79%
- Cash-on-cash
- 12.48%
- DSCR
- 1.56
- GRM
- 7.2
CMA / ARV
- ARV (on-the-fly)
- $221,920
- Comps found
- 12
Show comp detail 12 sales within ~0.75 mi
| Address | Dist | Beds/Ba | Sqft | Sold | Price | $/sf | Match |
|---|---|---|---|---|---|---|---|
| 19 Shamsie Dr | 0.42mi | 3/2.0 | 1,468 (+0%) | 2mo | $205,000 | $140 | 76 |
| 25 Shamsie Dr | 0.46mi | 3/2.0 | 1,442 (-1%) | 5mo | $162,000 | $112 | 70 |
| 208 Moore St | 0.10mi | 3/1.0 | 1,256 (-14%) | 2mo | $130,000 | $104 | 69 |
| 20 Lilly Ann Ct | 0.60mi | 3/2.0 | 1,448 (-1%) | 6mo | $199,900 | $138 | 64 |
| 35 Wilson Loop | 0.52mi | 4/2.0 (+1) | 1,426 (-2%) | 2mo | $223,000 | $156 | 63 |
| 105 Wilson Loop Rd | 0.54mi | 3/2.0 | 1,377 (-6%) | 1mo | $215,000 | $156 | 63 |
| 13 Lilly Ann Ct | 0.60mi | 3/2.0 | 1,418 (-3%) | 4mo | $214,900 | $152 | 62 |
| 40 Spears Dr | 0.65mi | 3/2.0 | 1,405 (-4%) | 1mo | $199,900 | $142 | 61 |
| 10 Patti Cv | 0.72mi | 3/2.0 | 1,421 (-3%) | 6mo | $240,000 | $169 | 55 |
| 17 Shamsie Dr | 0.40mi | 3/2.0 | 1,257 (-14%) | 3mo | $188,500 | $150 | 54 |
| 90 Wilson Loop | 0.58mi | 3/2.0 | 1,277 (-12%) | 0mo | $197,000 | $154 | 50 |
| 37 Lilly Ann Cir | 0.65mi | 4/2.0 (+1) | 1,600 (+10%) | 3mo | $245,000 | $153 | 44 |
Match score weights: distance 35% · size 25% · config 20% · recency 20%. Top-matched comps best support the ARV.
Projected returns pro-forma
5.35% appreciation · 3.0% rent growth · sell at horizon
- IRR
- 24.4%
- Equity multiple
- 2.56×
- Total profit
- $54,505
- Equity at exit
- $73,543
- IRR
- 23.4%
- Equity multiple
- 5.10×
- Total profit
- $143,551
- Equity at exit
- $129,223
Cash invested: $35,000 (down + closing). Projections, not guarantees.
Landlord ↔ Tenant lean methodology
- Overall (STATE)
- 92 Strongly Landlord-Friendly
- State Arkansas
- 92 Strongly Landlord-Friendly · R+14
- County
- — inherits STATE
- City
- — inherits STATE
ZIP-level market 72176
- Home prices YoY
- 2.6%
- Active inventory
- 147
- Price-to-rent
- 7.2×
Monthly cashflow live
- Estimated rent
- $1,445 high interval (Pro) →
- Mortgage (P&I)
- −$656
- Tax from tax record
- −$70 /mo · $839/yr
- Insurance
- −$52
- HOA
- −$0
- Vacancy / Maint / Mgmt
- −$303
- Net cashflow
- $364
Break-even live
UW: 25.0% down · 7.5% · 30yr · 1.5% tax · 5.0% vac · 8.0% maint · 8.0% mgmt
Financing live
Cash to close
- Down payment
- $31,250
- Closing costs
- $3,750
- Reserves months
- —
- Total cash needed
- —
Loan-product check · same deal, 3 products live
Conventional
25% down · 7.5% · 30yr
- Down + closing
- —
- Monthly P&I
- —
- Monthly cashflow
- —
- DSCR
- —
- Eligible?
- —
Personal DTI + credit; lowest rate.
DSCR
20% down · 8.5% · 30yr
- Down + closing
- —
- Monthly P&I
- —
- Monthly cashflow
- —
- DSCR
- —
- Eligible?
- —
No personal income docs; deal must DSCR.
Hard money
10% down · 12.0% · 12mo
- Down + closing
- —
- Monthly P&I
- —
- Monthly cashflow
- —
- DSCR
- —
- Eligible?
- —
Short-term bridge; refi at stabilization.
Rent comps 10 comps
| Address | Beds | Baths | Sqft | Rent | $/sqft | DOM | Units | Dist |
|---|---|---|---|---|---|---|---|---|
| 404 Scott St Ward, AR | 3.0 | 2.0 | 1195 | $1,195 | $1.00 | 19d | 1 | 0.18mi |
| 14 Stephens St Ward, AR | 3.0 | 2.0 | 1128 | $1,395 | $1.24 | 43d | 1 | 0.48mi |
| 21 Kasidyann Ct Ward, AR | 4.0 | 2.0 | 1415 | $1,795 | $1.27 | 23d | 1 | 0.55mi |
| 561 Brewer St Ward, AR | 3.0 | 2.0 | 1050 | $1,450 | $1.38 | 44d | 1 | 0.58mi |
| 39 Bud Grimes Rd Ward, AR | 3.0 | 2.0 | 1308 | $1,550 | $1.19 | 19d | 1 | 0.60mi |
| 33 Langford St Ward, AR | 3.0 | 2.0 | 1175 | $1,300 | $1.11 | 23d | 1 | 0.66mi |
| 21 Weatherwood Ward, AR | 3.0 | 2.0 | 1156 | $1,300 | $1.12 | 23d | 1 | 1.03mi |
| 29 Green Apple Ward, AR | 3.0 | 2.0 | 1200 | $1,450 | $1.21 | 19d | 1 | 1.10mi |
| 23 Green Apple Ward, AR | 3.0 | 2.0 | 1212 | $1,450 | $1.20 | 23d | 1 | 1.11mi |
| 21 Windsor Park Dr Ward, AR | 3.0 | 2.0 | 1442 | $1,500 | $1.04 | 23d | 1 | 1.46mi |
Listing history 22 events
-
2026-06-18days on market $125,000 Active 69 DOM
-
2026-06-17days on market $125,000 Active 68 DOM
-
2026-06-16days on market $125,000 Active 67 DOM
-
2026-06-15days on market $125,000 Active 66 DOM
-
2026-06-14days on market $125,000 Active 64 DOM
-
2026-06-10days on market $125,000 Active 61 DOM
-
2026-06-09days on market $125,000 Active 60 DOM
-
2026-06-08days on market $125,000 Active 59 DOM
-
2026-06-07days on market $125,000 Active 58 DOM
-
2026-06-05days on market $125,000 Active 55 DOM
-
2026-06-03days on market $125,000 Active 54 DOM
-
2026-06-02days on market $125,000 Active 53 DOM
-
2026-06-01days on market $125,000 Active 52 DOM
-
2026-05-31days on market $125,000 Active 51 DOM
-
2026-05-31days on market $125,000 Active 50 DOM
-
2026-04-11$125,000 New Listing
-
2025-05-02historical
-
2024-11-28price $119,900
-
2024-10-03price $123,900
-
2024-08-13price $132,500
-
2024-06-15$135,000 New Listing
-
1994-06-02soldstatus $50,000
ⓘ Source: listings_history table (triggers on properties + properties_extension) + one-shot
backfill from property_details.listing_events for pre-trigger history.
Tax reassessment forecast AR · Resets to sale price
- Current annual tax
- $839 · $70/mo
- Projected year-2 tax
- $839 · $70/mo
- Expected delta
- $0/yr ($0/mo · 0.0%)
ⓘ Screening estimate from a state-policy table — verify with the county assessor before closing.
Climate risk First Street
- Flood 1/10 Low FEMA zone X (unshaded) · 0% chance over 30 yrs
- Wildfire 4/10 Moderate
- Heat 6/10 Major 7 d/yr ≥109°F today · 19 d/yr by 30 yrs out
- Wind 4/10 Moderate 9% chance of damaging wind over 30 yrs
- Air quality 2/10 Low 1 unhealthy d/yr today · 1 by 30 yrs out
Nearby sold comps map
Loading sold comps map…
Walkable amenities ~0.75 mi
Loading nearby amenities…
Taxation est. · year 1
- Rental income
- $17,338
- − Mortgage interest
- −$7,002
- − Property taxes
- −$839
- − Insurance
- −$625
- − Repairs & maintenance
- −$1,387
- − Management
- −$1,387
- − Depreciation
- −$3,636
- Taxable income
- $2,462
- Est. tax owed @ 24.0%
- −$591
- After-tax cash flow
- $3,776/yr
For passive investors: Depreciation is non-cash, so a rental often shows a tax loss while cash-flowing — sheltering income. Rental losses are passive: they offset passive income freely, and up to $25,000/yr can offset ordinary (W-2) income if you actively participate and your MAGI is under $100k (phasing out to $0 by $150k); unused losses carry forward. On sale, claimed depreciation is recaptured at up to 25%, and gains may owe capital-gains tax (a 1031 exchange can defer both). Figures are a year-1 estimate at your 24.0% rate — not tax advice; consult a CPA.
Schools (NCES district)
- District
- Cabot School District
- NCES district ID
- 0503750
- Math proficiency
- 48% ▼ -14.00%
- Reading proficiency
- 43% ▼ -10.00%
- Median HH income
- $55,993
- Composite
- 39.66/100
- National rank
- #3912
- State rank
- #29 of 238 in AR
Livability — Ward
- Score
- 69/100
- State rank
- #66
- US rank
- #8464
Category grades
Schools grade is shown separately in the Schools card above.
Census & demographics
- Census place
- Ward, AR
- County
- Lonoke County · 46,130 people
- City population
- 8,678
- Metro
- Little Rock-North Little Rock-Conway, AR
- Population (ZIP)
- 8,678
- Household income
- $68,840
- Rent vs Own
- Severe rent burden
- 90.0
Population outlook (Lonoke County) Hauer SSP2
- Today (2025)
- 78,072 people
- By 2030
- 80,673 · +3.3%
- By 2040
- 84,977 · +8.8%
- By 2050
- 87,778 · +12.4%
- By 2075
- 91,398 · +17.1%
- By 2100
- 87,858 · +12.5%
Race, ethnicity, and origin ACS 2023
- Neighborhood character
- Predominantly White (85%)
- Race & ethnicity
- White 85% Two or more races 7% Hispanic / Latino 6% Black 2% Asian 1%
- Hispanic origin (detail)
- Mexican 2%
- Common ancestry
- Russian 2% Iranian 1% Slovak 1%
- Foreign-born
- 2% · Canada
- Languages at home
- 95% English-only · Spanish 3% Tagalog/Filipino 1% German/W. Germanic 1%
Political lean MEDSL · Lonoke
- 2024 margin
- Solid R (+53.7) · D 22.2% · R 75.8% · Other 2.0%
- 2008→2024 swing
- -6.2pp toward R · 2008: -47.5pp · 2024: -53.7pp
- All cycles
- 2024: R+53.7 2020: R+52.8 2016: R+53.3 2012: R+50.9 2008: R+47.5
Not yet ingested
- Civics
- —
Market trends
- HPI YoY
- ▲ 5.35%
- Current HPI
- 208.9387
- Rent YoY
- —
- Metro
- Little Rock-North Little Rock-Conway, AR
- State GDP YoY
- ▲ 3.80%
- F500 in state
- 10
Industry mix (Fortune 500 HQ in AR)
| Industry | F500 HQs | Revenue |
|---|---|---|
| Retail | 1 | $681B |
|
||
| Food / Agriculture | 1 | $53B |
|
||
| Retail / Energy | 1 | $22B |
|
||
| Transportation / Logistics | 1 | $12B |
|
||
| Energy | 1 | $4B |
|
||
Price history
+150.0% since first listed7 events — show timeline
- 2026-04-11 Listed $125,000 CARMLS
- 2025-05-02 Listing Removed — CARMLS
- 2024-11-28 Price Changed $119,900 CARMLS
- 2024-10-03 Price Changed $123,900 CARMLS
- 2024-08-13 Price Changed $132,500 CARMLS
- 2024-06-15 Listed $135,000 CARMLS
- 1994-06-02 Sold (Public Records) $50,000 Public Records
Property tax history
+6.9%/yrLatest (2025): $839 · +147.6% YoY. Source: county tax records.
Cash-flow waterfall
monthlySold comps — $/sqft
last 12 mo · ≤1 miLoading sold comps…