 Multi-family
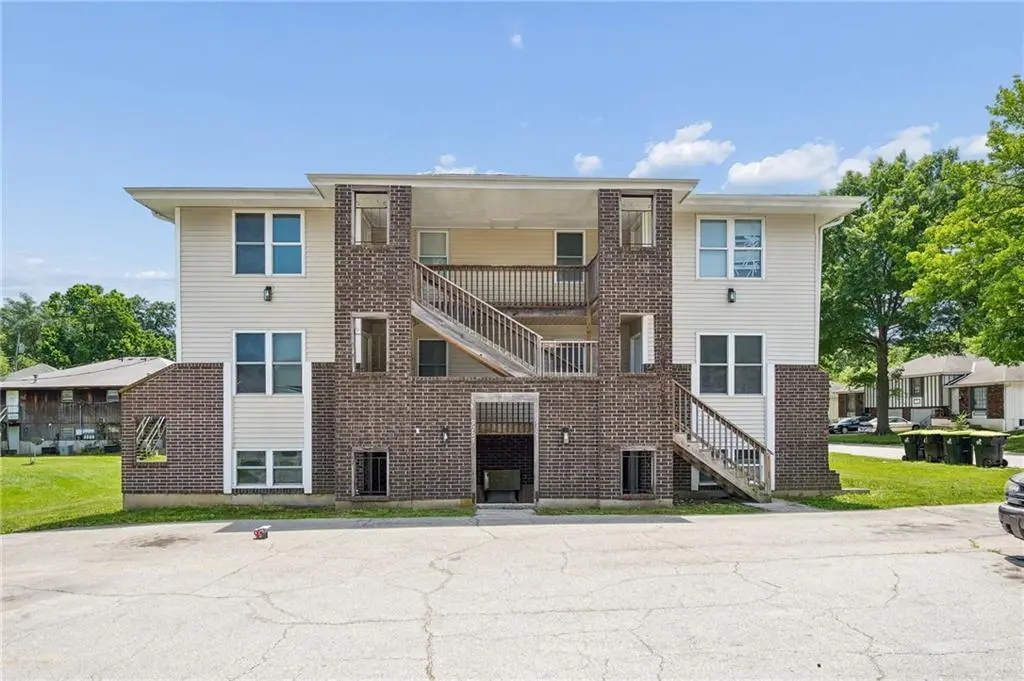
9201 E 54th St · Raytown, MO
Flood risk 5/10 · Moderate
- FEMA flood zone
- X (unshaded)
- Chance of flooding over 30 yrs
- 0.66%
- Est. flood insurance / yr
- $507 – $1,088
Fire risk 1/10 · Minimal
- Est. fire insurance / yr
- $1,054 – $1,958
Heat risk 4/10 · Minor
- Hot days now (above 106°F)
- 7 days/yr
- Hot days in 30 yrs
- 17 days/yr
Wind risk 2/10 · Minimal
- Chance of severe wind over 30 yrs
- —
Air-quality risk 3/10 · Minor
- Unhealthy air days now
- 3 days/yr
- Unhealthy air days in 30 yrs
- 5 days/yr
Risk factors via First Street. Map © Google.
Why this score? — see what drove the C- grade
The composite is a weighted blend of 9 inputs, each scored 0–100. Each bar is that input's sub-score; the figure is the points it added to the 100-point composite (weight × sub-score).
- Cash flow +22.7/30.0
- ARV discount +7.5/15.0
- DSCR +7.3/10.0
- 1% rule +5.4/10.0
- Livability +3.2/5.0
- Rent growth +2.8/5.0
- Condition / age +2.5/5.0
- Schools +1.8/10.0
- Appreciation +0.0/10.0
$675,000
🖨 Deal sheet (PDF) 📄 Offer letter ✓ Due diligence
Multi-family units
County records classify this as Multi-Family (5+ Unit). Listing-text estimate: 1 unit. estimate disagrees with records
5+ unit building — per-unit beds/baths from public records are typically unavailable; the breakdown below (if shown) is an estimate from the listing text.
Listing remarks MLS
9201 E. 54th Street is a 6-unit building located on the corner of a cul-de-sac in Raytown, Missouri. Built in 1985, the property dwells in a neighborhood of rental properties and provides tenants 8 off-street parking spaces at the front of the building. The property stands 2.5-stories with vinyl siding/windows with a pitched composition shingle roof on a large lot. The building is separately metered for gas, electric and water (tenants responsible for all utilities) and units have front & rear access (keycode entry). 5 of the 6 HVAC/furnace systems have been replaced at the building. The All units at the property are two-bedroom, one-bathroom units with an approximate unit size of 800 square-feet (+/-). The current owner of the property, Every Child’s Hope, operates as a private, non-profit equal housing provider. The goal being to provide increased opportunities for housing and support services for people who have limited resources (operating as tax-exempt property). All units feature central air/heat, washer/dryer in units, excellent closet/storage space, fully equipped eat-in kitchens and individual mechanical rooms. Basement unit’s floors are epoxy while the above-grade units are predominantly carpet and LVT. 9201 E. 54th has excellent commuter accessibility to highways/interstates and nearby shops/restaurants. The building backing to the property, 9200 E. 54th Terrace (MLS: 2460570) is also available for sale providing opportunity for new ownership to take advantages of the synergies of owning adjacent properties. The property will be delivered vacant at closing.
Key facts
- Washer and dryer
- New paint
- New appliances
Tags
Property features AI
Finance
- Financial info: Operating expenses include insurance, property management, and real estate tax
Exterior
- Parking: Assigned parking for 8 vehicles (total)
- Utilities: Public water; Public sewer; Central water heater
- Home design: Residential income property (apartment); Two-story building; Zoned APT
- Construction: Brick construction; Composition roof
- Exterior features: Property located on the north corner of a cul-de-sac; Not in a flood plain
Interior
- Kitchen: Dishwasher; Garbage disposal; Range/oven; Refrigerator
- Bedrooms: All units are 2-bedroom
- Heating & cooling: Natural gas heating; Electric cooling (has cooling)
- Interior features: Apartment building with multiple 2-bedroom units; Dishwasher; Garbage disposal; Hot water heater; Range/oven; Refrigerator
- Laundry & utility: Central water heater
Neighborhood map
What this means for you Summary
Snapshot
- This is a 12-bed/?-bath multifamily listed at $675k.
Deal economics
- At list price, monthly cash flow is $1k ($14k/yr) — positive.
- The deal already cash-flows at list — no discount required.
- Meets the 1% rule at list price ($7k rent vs $675k).
- Cap rate 8.4% vs local median 5.0% in Raytown — top-decile yield for the area; either an underpriced asset or a hidden risk that comps aren't pricing in. Stress-test before assuming the spread holds.
Location & tenants
- Location reads 65/100 on livability (#281 in MO) — a middle-class / working-renter tenant base. Strengths: cost of living A+, housing A+, health & safety B+; Watch: schools D-, crime F, amenities F.
- Raytown C-2 (suburban): math 12% / reading 28% proficiency, ranked #302 of 324 in MO (top 93%) — low school quality limits family demand, transient renter base, plan for 1-2y turnover.
- Market conditions: Rents rising (+1.3%/yr); 203 active listings in the ZIP; 4,002 units permitted in Jackson County in 2024 (2,271 in 5+ unit buildings).
- At $7,007/mo this rent would consume 124% of the median local household income ($68k/yr) (locally 1173% of renters already pay >50% of income on rent) — very limited rent-growth headroom before tenants either downsize or default.
Forward outlook
- Local home prices are declining (-3.0%/yr); year-one equity from $5k of loan paydown is wiped out by about $20k of value loss. Plan a longer hold.
- Jackson County population projected at +4% by 2050 — modest demand growth; plan on rents tracking national, not racing it.
Negotiation context
- Only 14 days on market — expect competitive offers; lowballing is unlikely to land.
- 6 sale attempts since 3y ago with the ask held roughly flat each time — persistent listings suggest the price (not the market) is what's stuck; bring a comps-based counter.
Risks & watch-outs
- Climate carrying-cost: moderate flood risk — expect insurance premiums to compound above CPI over the hold.
Questions for the listing agent
- Built in 1972 — when were the roof, HVAC, electrical panel, plumbing, and water heater last replaced?
- Is there a deadline driving the sale (1031 exchange, divorce, estate, relocation)? That informs how much negotiation room exists.
- Schools are D-rated, which usually means shorter tenancies and higher turnover. Who's the typical renter profile here, and what's been the actual vacancy rate?
- Crime grade is F in this area — have there been break-ins, vandalism, or insurance claims at this property in the last 3 years? What carrier currently insures it and at what premium?
- What's the average days-on-market for RENTAL listings here right now (not sales)? A rising rental-DOM trend means longer vacancies and softer asking-rent achievability than the comps imply.
- What's the recent tenant-quality profile in this submarket — average credit score on applications, eviction rate, late-payment / NSF rate, and stable-employment percentage? A property-management company in the area should have these aggregated.
- How much new apartment / multifamily construction is in the pipeline within 1–3 miles? Heavy new supply (>2% of stock underway) typically softens rents 12–24 months out; light construction supports rent growth.
Investment metrics
- 1% rule
- 1.04% ✓
- Cap rate
- 8.37%
- Cash-on-cash
- 7.41%
- DSCR
- 1.33
- GRM
- 8.0
CMA / ARV
No comps found within radius.
Projected returns pro-forma
-3.0% appreciation · 1.34% rent growth · sell at horizon
- IRR
- -6.8%
- Equity multiple
- 0.75×
- Total profit
- $-46,647
- Equity at exit
- $100,645
- IRR
- 0.7%
- Equity multiple
- 1.05×
- Total profit
- $9,079
- Equity at exit
- $58,362
Cash invested: $189,000 (down + closing). Projections, not guarantees.
Landlord ↔ Tenant lean methodology
- Overall (STATE)
- 81 Strongly Landlord-Friendly
- State Missouri
- 81 Strongly Landlord-Friendly · R+10
- County
- — inherits STATE
- City
- — inherits STATE
ZIP-level market 64133
- Rents YoY
- 1.3%
- Active inventory
- 203
- Price-to-rent
- 48.2×
Monthly cashflow live
- Estimated rent
- $7,007 high interval (Pro) →
- Mortgage (P&I)
- −$3,540
- Tax from tax record
- −$548 /mo · $6,571/yr
- Insurance
- −$281
- HOA
- −$0
- Vacancy / Maint / Mgmt
- −$1,471
- Net cashflow
- $1,167
Break-even live
Sensitivity live
| Price | -10% $1,549 | -5% $1,358 | +0% $1,167 | +5% $976 | +10% $785 |
|---|---|---|---|---|---|
| Rent | -10% $613 | -5% $890 | +0% $1,167 | +5% $1,444 | +10% $1,720 |
| Rate | -1.0pp $1,507 | -0.5pp $1,339 | base $1,167 | +0.5pp $992 | +1.0pp $814 |
6-unit breakdown (identical units grouped — click to expand)
| Units | Beds | Baths | Est. rent |
|---|---|---|---|
| 6× units | 2 | 1 | $7,008 |
| #1 | 2 | 1 | $1,168 |
| #2 | 2 | 1 | $1,168 |
| #3 | 2 | 1 | $1,168 |
| #4 | 2 | 1 | $1,168 |
| #5 | 2 | 1 | $1,168 |
| #6 | 2 | 1 | $1,168 |
| Total (6 units) | $7,007 | ||
UW: 25.0% down · 7.5% · 30yr · 1.5% tax · 5.0% vac · 8.0% maint · 8.0% mgmt
Financing live
Cash to close
- Down payment
- $168,750
- Closing costs
- $20,250
- Reserves months
- —
- Total cash needed
- —
Loan-product check · same deal, 3 products live
Conventional
25% down · 7.5% · 30yr
- Down + closing
- —
- Monthly P&I
- —
- Monthly cashflow
- —
- DSCR
- —
- Eligible?
- —
Personal DTI + credit; lowest rate.
DSCR
20% down · 8.5% · 30yr
- Down + closing
- —
- Monthly P&I
- —
- Monthly cashflow
- —
- DSCR
- —
- Eligible?
- —
No personal income docs; deal must DSCR.
Hard money
10% down · 12.0% · 12mo
- Down + closing
- —
- Monthly P&I
- —
- Monthly cashflow
- —
- DSCR
- —
- Eligible?
- —
Short-term bridge; refi at stabilization.
Listing history 9 events
-
2026-06-18days on market $675,000 Active 14 DOM
-
2026-06-17days on market $675,000 Active 13 DOM
-
2026-06-16days on market $675,000 Active 12 DOM
-
2026-06-15days on market $675,000 Active 11 DOM
-
2026-06-13days on market $675,000 Active 9 DOM
-
2026-06-13days on market $675,000 Active 8 DOM
-
2026-06-09days on market $675,000 Active 5 DOM
-
2026-06-08days on market $675,000 Active 4 DOM
-
2026-06-07$675,000 Active 3 DOM
ⓘ Source: listings_history table (triggers on properties + properties_extension) + one-shot
backfill from property_details.listing_events for pre-trigger history.
Tax reassessment forecast MO · Resets to sale price
- Current annual tax
- $6,571 · $548/mo
- Projected year-2 tax
- $6,571 · $548/mo
- Expected delta
- $0/yr ($0/mo · 0.0%)
ⓘ Screening estimate from a state-policy table — verify with the county assessor before closing.
Climate risk First Street
- Flood 5/10 Major FEMA zone X (unshaded) · 66% chance over 30 yrs
- Wildfire 1/10 Low
- Heat 4/10 Moderate 7 d/yr ≥106°F today · 17 d/yr by 30 yrs out
- Wind 2/10 Low
- Air quality 3/10 Moderate 3 unhealthy d/yr today · 5 by 30 yrs out
Nearby sold comps map
Loading sold comps map…
Walkable amenities ~0.75 mi
Loading nearby amenities…
Taxation est. · year 1
- Rental income
- $84,084
- − Mortgage interest
- −$37,810
- − Property taxes
- −$6,571
- − Insurance
- −$3,375
- − Repairs & maintenance
- −$6,727
- − Management
- −$6,727
- − Depreciation
- −$19,636
- Taxable income
- $3,238
- Est. tax owed @ 24.0%
- −$777
- After-tax cash flow
- $13,226/yr
For passive investors: Depreciation is non-cash, so a rental often shows a tax loss while cash-flowing — sheltering income. Rental losses are passive: they offset passive income freely, and up to $25,000/yr can offset ordinary (W-2) income if you actively participate and your MAGI is under $100k (phasing out to $0 by $150k); unused losses carry forward. On sale, claimed depreciation is recaptured at up to 25%, and gains may owe capital-gains tax (a 1031 exchange can defer both). Figures are a year-1 estimate at your 24.0% rate — not tax advice; consult a CPA.
Schools (NCES district)
- District
- Raytown C-2
- NCES district ID
- 2926070
- Math proficiency
- 12% ▼ -11.00%
- Reading proficiency
- 28% ▼ -9.00%
- Median HH income
- $47,215
- Composite
- 17.59/100
- National rank
- #9039
- State rank
- #302 of 324 in MO
Livability — Raytown
- Score
- 65/100
- State rank
- #281
- US rank
- #13079
Category grades
Schools grade is shown separately in the Schools card above.
Census & demographics
- Census place
- Raytown, MO
- County
- Jackson County · 687,798 people
- City population
- 60,054
- Metro
- Kansas City, MO-KS
- Population (ZIP)
- 36,249
- Household income
- $67,750
- Rent vs Own
- Severe rent burden
- 1173.0
Population outlook (Jackson County) Hauer SSP2
- Today (2025)
- 719,589 people
- By 2030
- 731,456 · +1.6%
- By 2040
- 746,689 · +3.8%
- By 2050
- 749,289 · +4.1%
- By 2075
- 736,227 · +2.3%
- By 2100
- 668,210 · -7.1%
Race, ethnicity, and origin ACS 2023
- Neighborhood character
- Diverse neighborhood (Simpson 0.64)
- Race & ethnicity
- White 46% Black 37% Hispanic / Latino 12% Two or more races 9%
- Hispanic origin (detail)
- Mexican 10%
- Common ancestry
- Italian 7% Slovak 1% Lithuanian 1%
- Foreign-born
- 5% · Canada
- Languages at home
- 90% English-only · Spanish 7% French/Haitian/Cajun 1%
Political lean MEDSL · Jackson
- 2024 margin
- D (+19.3) · D 58.9% · R 39.5% · Other 1.6%
- 2008→2024 swing
- -6.1pp toward R · 2008: 25.4pp · 2024: 19.3pp
- All cycles
- 2024: D+19.3 2020: D+22.0 2016: D+16.6 2012: D+19.0 2008: D+25.4
Not yet ingested
- Civics
- —
Market trends
- HPI YoY
- ▼ -155.40%
- Current HPI
- 263.6915
- Rent YoY
- ▲ 1.34%
- Metro
- Kansas City, MO-KS
- State GDP YoY
- ▲ 1.84%
- F500 in state
- 20
Industry mix (Fortune 500 HQ in MO)
| Industry | F500 HQs | Revenue |
|---|---|---|
| Healthcare | 1 | $163B |
|
||
| Insurance | 1 | $21B |
|
||
| Industrial Technology | 1 | $17B |
|
||
| Retail | 1 | $16B |
|
||
| Industrial Distribution | 1 | $10B |
|
||
| Utilities | 1 | $9B |
|
||
Price history
+65.0% since first listed14 events — show timeline
- 2026-06-05 Listed $675,000 Heartland MLS as Distributed by MLS Grid
- 2025-05-23 Rental Removed $919 SHOWMOJO
- 2025-05-06 Listed for Rent $919 SHOWMOJO
- 2025-05-06 Rental Removed $919 SHOWMOJO2
- 2025-05-01 Rental Removed $919 SHOWMOJO
- 2025-05-01 Listed for Rent $919 SHOWMOJO2
- 2025-03-27 Price Changed $919 SHOWMOJO
- 2025-01-24 Listed for Rent $995 SHOWMOJO
- 2024-03-04 Sold (MLS) — Heartland MLS as Distributed by MLS Grid
- 2024-01-12 Pending — Heartland MLS as Distributed by MLS Grid
- 2023-12-15 Relisted — Heartland MLS as Distributed by MLS Grid
- 2023-11-03 Pending — Heartland MLS as Distributed by MLS Grid
- 2023-10-24 Listed $409,000 Heartland MLS as Distributed by MLS Grid
- 1988-03-01 Sold (Public Records) — Public Records
Cash-flow waterfall
monthlySold comps — $/sqft
last 12 mo · ≤1 miLoading sold comps…