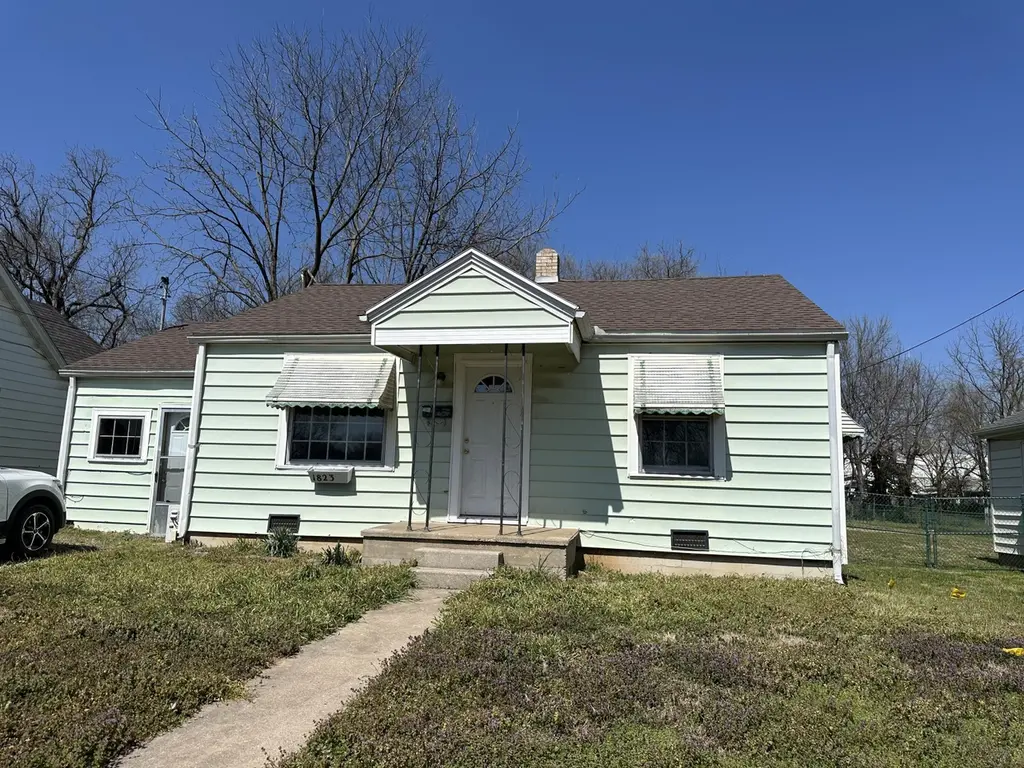
1823 W Olive St · Springfield, MO
Flood risk 1/10 · Minimal
- FEMA flood zone
- X (unshaded)
- Chance of flooding over 30 yrs
- 0.0%
- Est. flood insurance / yr
- $507 – $1,088
Fire risk 1/10 · Minimal
- Est. fire insurance / yr
- $1,054 – $1,958
Heat risk 5/10 · Moderate
- Hot days now (above 104°F)
- 7 days/yr
- Hot days in 30 yrs
- 19 days/yr
Wind risk 2/10 · Minimal
- Chance of severe wind over 30 yrs
- —
Air-quality risk 2/10 · Minimal
- Unhealthy air days now
- 1 days/yr
- Unhealthy air days in 30 yrs
- 2 days/yr
Risk factors via First Street. Map © Google.
Why this score? — see what drove the B- grade
The composite is a weighted blend of 9 inputs, each scored 0–100. Each bar is that input's sub-score; the figure is the points it added to the 100-point composite (weight × sub-score).
- Cash flow +24.8/30.0
- ARV discount +15.0/15.0
- DSCR +8.0/10.0
- 1% rule +5.4/10.0
- Livability +3.8/5.0
- Rent growth +3.7/5.0
- Schools +3.2/10.0
- Condition / age +2.5/5.0
- Appreciation +0.0/10.0
$98,000
🖨 Deal sheet (PDF) 📄 Offer letter ✓ Due diligence
Listing remarks MLS
PRICE IMPROVEMENT on this Charming move-in ready cottage offering 2 bedrooms and 1 bathroom in a convenient location close to everything! This well-maintained home features updated flooring in the kitchen, adding a fresh and modern touch. A new mini-split system provides efficient heating and cooling for year-round comfort. Enjoy peace of mind with a brand new roof just installed. Perfect for a first-time homebuyer, downsizer, or investment opportunity--this home is full of value and ready for its next owner! Bonus room has a seperate entrance. There is also a gas stove hook up in the kitchen. Motivated seller. Buyers and Buyers agents do your own research on square footage and schools.
Key facts
- Brand new roof
- Updated flooring
- 8,712 sq ft lot
Tags
Neighborhood map
What this means for you Summary
Snapshot
- This is a 2-bed/1.0-bath single-family listed at $98k.
Deal economics
- At list price, monthly cash flow is $208 ($2k/yr) — positive.
- The deal already cash-flows at list — no discount required.
- Meets the 1% rule at list price ($1k rent vs $98k).
- Recommended offer: $92k (6.0% below list) — sets the bar for market timing.
- Cap rate 8.8% vs local median 4.6% in Springfield — top-decile yield for the area; either an underpriced asset or a hidden risk that comps aren't pricing in. Stress-test before assuming the spread holds.
Location & tenants
- Location reads 75/100 on livability (#57 in MO, #4,121 nationally) — a middle-class / working-renter tenant base. Strengths: commute A+, cost of living A+, housing A+; Watch: crime F, employment F.
- Springfield R-XII (urban): math 32% / reading 46% proficiency, ranked #174 of 324 in MO (top 54%) — families likely to look elsewhere, expect single-tenant / working-renter base with shorter leases.
- Zoned schools: Westport Elem. (math 8% / reading 17%, grade F, #1,007 of 1,115 statewide, top 91%, 384 students, 88% FRL); Westport Middle School (math 12% / reading 29%, grade F, #344 of 391 statewide, top 88%, 433 students, 87% FRL) — zoned schools average 87% FRL vs 46% district-wide (41 pts higher); higher-poverty schools than district average — tighter screening recommended.
- Zoned-school proficiency averages 16% at this address vs 39% district-wide (-23 pts) — the specific schools serving this property underperform the Springfield R-XII average; the district grade overstates school quality for this exact location.
- Market conditions: Rents rising fast (+4.8%/yr); 520 active listings in the ZIP; 40 comparable units currently listed for rent nearby; rentals at typical pace (median 25d on market — plan ~3-4 weeks tenant-placement turnaround); 1,302 units permitted in Greene County in 2024 (250 in 5+ unit buildings).
Forward outlook
- Local home prices are declining (-3.0%/yr); year-one equity from $678 of loan paydown is wiped out by about $3k of value loss. Plan a longer hold.
- Greene County population projected at +25% by 2050 — long-run rental-demand tailwind backs the buy-and-hold thesis.
- At projected returns (-3.0% appreciation + 4.8% rent growth), your $27k cash investment doubles in ~10 years — after that, you're playing with house money.
Negotiation context
- It's been on market 88 days — a 6% lower offer ($92k) is reasonable based on typical stale-listing flexibility.
- 5 sale attempts; this cycle's ask has dropped $14k (12%) from the opening price — seller is motivated, your offer sets the floor, not the list.
Risks & watch-outs
- Watch-outs: built in 1947 — expect roof / HVAC / electrical / plumbing capex.
- Climate carrying-cost: extreme-heat days projected 7→19/yr by 2055 (HVAC capex compounding) — expect insurance premiums to compound above CPI over the hold.
Questions for the listing agent
- It's been on market 88 days. Have you received any prior offers? Is the seller open to a 6% concession, seller financing, or rate buy-down credit?
- Built in 1947 — when were the roof, HVAC, electrical panel, plumbing, and water heater last replaced?
- Why hasn't it sold? Are there any deal-killer items the seller is aware of (foundation, flood, title, zoning, code violations)?
- Is there a deadline driving the sale (1031 exchange, divorce, estate, relocation)? That informs how much negotiation room exists.
- Crime grade is F in this area — have there been break-ins, vandalism, or insurance claims at this property in the last 3 years? What carrier currently insures it and at what premium?
- What's the average days-on-market for RENTAL listings here right now (not sales)? A rising rental-DOM trend means longer vacancies and softer asking-rent achievability than the comps imply.
- What's the recent tenant-quality profile in this submarket — average credit score on applications, eviction rate, late-payment / NSF rate, and stable-employment percentage? A property-management company in the area should have these aggregated.
- How much new for-sale + rental construction is in the pipeline within 1–3 miles? Heavy new supply typically softens prices + rents 12–24 months out; constrained supply supports both.
Investment metrics
- 1% rule
- 1.04% ✓
- Cap rate
- 8.84%
- Cash-on-cash
- 9.09%
- DSCR
- 1.40
- GRM
- 8.0
CMA / ARV
- ARV (median comp)
- $127,263
- List price
- $98,000
- Delta
- -22.99%
- Verdict
- UNDERPRICED
- Comps
- 20 within 1.0 mi
Show comp detail 12 sales within ~0.75 mi
| Address | Dist | Beds/Ba | Sqft | Sold | Price | $/sf | Match |
|---|---|---|---|---|---|---|---|
| 521 N Park Ave | 0.37mi | 3/1.0 (+1) | 910 (+2%) | 1mo | $85,000 | $93 | 74 |
| 2200 W Phelps St | 0.33mi | 3/1.0 (+1) | 936 (+4%) | 0mo | $135,900 | $145 | 72 |
| 659 N Lafontaine Ave | 0.40mi | 3/1.0 (+1) | 876 (-2%) | 2mo | $164,900 | $188 | 72 |
| 541 S Warren Ave | 0.49mi | 2/1.5 | 903 (+1%) | 3mo | $155,000 | $172 | 71 |
| 827 N Marion Ave | 0.56mi | 2/1.0 | 871 (-3%) | 3mo | $115,000 | $132 | 67 |
| 717 N West Ave | 0.66mi | 2/1.0 | 909 (+2%) | 1mo | $125,000 | $138 | 66 |
| 2223 W Elm St | 0.39mi | 2/1.0 | 993 (+11%) | 1mo | $115,000 | $116 | 63 |
| 2041 W Elm St | 0.28mi | 2/1.0 | 1,028 (+15%) | 2mo | $125,000 | $122 | 60 |
| 2326 W Nichols St | 0.73mi | 2/1.0 | 945 (+6%) | 1mo | $150,000 | $159 | 56 |
| 2137 W Brower St | 0.54mi | 3/1.0 (+1) | 960 (+7%) | 3mo | $129,900 | $135 | 55 |
| 918 N Nettleton Ave | 0.68mi | 2/1.0 | 971 (+8%) | 1mo | $105,000 | $108 | 54 |
| 810 N West Ave | 0.72mi | 2/1.0 | 768 (-14%) | 3mo | $119,000 | $155 | 40 |
Match score weights: distance 35% · size 25% · config 20% · recency 20%. Top-matched comps best support the ARV.
Projected returns pro-forma
-3.0% appreciation · 4.82% rent growth · sell at horizon
- IRR
- -0.7%
- Equity multiple
- 0.97×
- Total profit
- $-780
- Equity at exit
- $14,612
- IRR
- 10.6%
- Equity multiple
- 1.89×
- Total profit
- $24,288
- Equity at exit
- $8,473
Cash invested: $27,440 (down + closing). Projections, not guarantees.
Landlord ↔ Tenant lean methodology
- Overall (STATE)
- 81 Strongly Landlord-Friendly
- State Missouri
- 81 Strongly Landlord-Friendly · R+10
- County
- — inherits STATE
- City
- — inherits STATE
ZIP-level market 65802
- Home prices YoY
- -31.9%
- Rents YoY
- 4.8%
- Active inventory
- 520
- Price-to-rent
- 8.0×
Monthly cashflow live
- Estimated rent
- $1,015 high interval (Pro) →
- Mortgage (P&I)
- −$514
- Tax from tax record
- −$39 /mo · $469/yr
- Insurance
- −$41
- HOA
- −$0
- Vacancy / Maint / Mgmt
- −$213
- Net cashflow
- $208
Break-even live
Sensitivity live
| Price | -10% $263 | -5% $236 | +0% $208 | +5% $180 | +10% $152 |
|---|---|---|---|---|---|
| Rent | -10% $128 | -5% $168 | +0% $208 | +5% $248 | +10% $288 |
| Rate | -1.0pp $257 | -0.5pp $233 | base $208 | +0.5pp $183 | +1.0pp $157 |
UW: 25.0% down · 7.5% · 30yr · 1.5% tax · 5.0% vac · 8.0% maint · 8.0% mgmt
Financing live
Cash to close
- Down payment
- $24,500
- Closing costs
- $2,940
- Reserves months
- —
- Total cash needed
- —
Loan-product check · same deal, 3 products live
Conventional
25% down · 7.5% · 30yr
- Down + closing
- —
- Monthly P&I
- —
- Monthly cashflow
- —
- DSCR
- —
- Eligible?
- —
Personal DTI + credit; lowest rate.
DSCR
20% down · 8.5% · 30yr
- Down + closing
- —
- Monthly P&I
- —
- Monthly cashflow
- —
- DSCR
- —
- Eligible?
- —
No personal income docs; deal must DSCR.
Hard money
10% down · 12.0% · 12mo
- Down + closing
- —
- Monthly P&I
- —
- Monthly cashflow
- —
- DSCR
- —
- Eligible?
- —
Short-term bridge; refi at stabilization.
Rent comps 40 comps
| Address | Beds | Baths | Sqft | Rent | $/sqft | DOM | Units | Dist |
|---|---|---|---|---|---|---|---|---|
| 1740 W Olive St Springfield, MO | 3.0 | 1.0 | 736 | $1,195 | $1.62 | 15d | 1 | 0.09mi |
| 1911 W Elm St Springfield, MO | 2.0 | 1.0 | 580 | $875 | $1.51 | 45d | 1 | 0.23mi |
| 522 N Park Ave Springfield, MO | 1.0 | 1.0 | 608 | $950 | $1.56 | 45d | 1 | 0.35mi |
| 1200 W Walnut St Springfield, MO | 2.0 | 2.0 | 1000 | $995 | $0.99 | 15d | 3 | 0.61mi |
| 2541 W Lincoln St Springfield, MO | 2.0 | 1.0 | 1034 | $975 | $0.94 | 45d | 1 | 0.65mi |
| 916 N Kansas Expy Springfield, MO | 1.0 | 1.0 | 573 | $595 | $1.04 | 45d | 1 | 0.65mi |
| 740 N West Ave Springfield, MO | 3.0 | 1.0 | 900 | $995 | $1.11 | 25d | 1 | 0.66mi |
| 627 S Fort Ave Springfield, MO | 2.0 | 1.0 | 880 | $895 | $1.02 | 25d | 1 | 0.67mi |
| 741 N West Ave Springfield, MO | 2.0 | 1.0 | 912 | $950 | $1.04 | 45d | 1 | 0.68mi |
| 2204 W Madison St Springfield, MO | 3.0 | 1.0 | 960 | $1,095 | $1.14 | 15d | 1 | 0.73mi |
| 2711 W Olive St Springfield, MO | 1.0 | 1.0 | 621 | $750 | $1.21 | 25d | 1 | 0.78mi |
| 520 S Scenic Ave Unit 101-A Springfield, MO | 1.0 | 1.0 | 550 | $650 | $1.18 | 45d | 1 | 0.78mi |
| 513 S Broadway Ave Springfield, MO | 2.0 | 1.0 | 800 | $855 | $1.07 | 45d | 1 | 0.80mi |
| 930 W Harrison St Springfield, MO | 3.0 | 2.0 | 1046 | $1,150 | $1.10 | 15d | 1 | 0.90mi |
| 1036 W Monroe Ter Springfield, MO | 2.0 | 1.0 | 812 | $795 | $0.98 | 25d | 1 | 0.90mi |
| 1406 W Calhoun St Unit B Springfield, MO | 2.0 | 1.0 | 885 | $865 | $0.98 | 25d | 1 | 0.94mi |
| 733 W College St Springfield, MO | 1.0 | 1.0 | 700 | $750 | $1.07 | 15d | 1 | 0.94mi |
| 865 S Douglas Ave Springfield, MO | 2.0 | 2.0 | 850 | $895 | $1.05 | 15d | 4 | 0.95mi |
| 2712 W Nichols St Springfield, MO | 2.0 | 1.0 | 619 | $795 | $1.28 | 45d | 1 | 0.98mi |
| 813 W Poplar St Unit 813 Springfield, MO | 2.0 | 1.0 | 560 | $795 | $1.42 | 15d | 1 | 1.00mi |
| 2854 W Walnut St Springfield, MO | 3.0 | 1.0 | 945 | $995 | $1.05 | 22d | 1 | 1.01mi |
| 1126 W Hamilton St Springfield, MO | 2.0 | 1.0 | 648 | $895 | $1.38 | 25d | 1 | 1.07mi |
| 1020 S Clifton Ave Springfield, MO | 2.0 | 2.0 | 1010 | $950 | $0.94 | 25d | 1 | 1.10mi |
| 815 N Grant Ave Unit A Springfield, MO | 2.0 | 1.0 | 801 | $625 | $0.78 | 45d | 1 | 1.11mi |
| 535 W Walnut St Springfield, MO | 2.0 | 2.0 | 1096 | $1,495 | $1.36 | 45d | 1 | 1.13mi |
| 922 N Glenn Ave Springfield, MO | 2.0 | 1.0 | 780 | $1,100 | $1.41 | 45d | 1 | 1.14mi |
| 1040 S Clifton Ave Springfield, MO | 2.0 | 2.0 | 1010 | $945 | $0.94 | 15d | 1 | 1.15mi |
| 647 W Central St Springfield, MO | 3.0 | 1.0 | 882 | $1,050 | $1.19 | 25d | 1 | 1.17mi |
| 235 N Market Ave Springfield, MO | 1.0–4.0 | 1.0–2.0 | 1350 | $1,267 | $0.94 | 25d | 5 | 1.18mi |
| 235 N Market Ave Springfield, MO | 1.0–4.0 | 1.0–2.0 | 1350 | $1,267 | $0.94 | 15d | 4 | 1.18mi |
| 211 S Market Ave Springfield, MO | 2.0–4.0 | 1.0–2.0 | 1442 | $1,425 | $0.99 | 22d | 5 | 1.18mi |
| 211 S Market Ave Springfield, MO | 2.0–4.0 | 1.0–2.0 | 1442 | $1,425 | $0.99 | 25d | 5 | 1.18mi |
| 3028 W Walnut St Springfield, MO | 2.0 | 1.0 | 975 | $850 | $0.87 | 22d | 1 | 1.20mi |
| 847 S Grant Ave Springfield, MO | 2.0 | 1.0 | 1080 | $815 | $0.75 | 45d | 1 | 1.23mi |
| 305 S Campbell Ave Unit 208 Springfield, MO | 1.0 | 1.0 | 649 | $975 | $1.50 | 15d | 1 | 1.24mi |
| 430 W Pershing St Springfield, MO | 2.0 | 2.0 | 765 | $1,195 | $1.56 | 15d | 1 | 1.27mi |
| 138 Park Central Sq Springfield, MO | 1.0–2.0 | 1.0–2.0 | 1083 | $2,489 | $2.30 | 15d | 8 | 1.33mi |
| 1735 W Bennett St Springfield, MO | 1.0 | 1.0 | 800 | $1,124 | $1.41 | 15d | 2 | 1.33mi |
| 209 W McDaniel St Unit 209-207 Springfield, MO | 1.0 | 1.0 | 700 | $950 | $1.36 | 45d | 1 | 1.35mi |
| 810 W Catalpa St Apt 316 Springfield, MO | 1.0 | 1.0 | 581 | $551 | $0.95 | 25d | 1 | 1.39mi |
Listing history 27 events
-
2026-06-22days on market $98,000 Active 88 DOM
-
2026-06-18days on market $98,000 Active 85 DOM
-
2026-06-17days on market $98,000 Active 84 DOM
-
2026-06-16days on market $98,000 Active 83 DOM
-
2026-06-15pricedays on market $98,000 Active 82 DOM
-
2026-06-14days on market $106,000 Active 80 DOM
-
2026-06-10days on market $106,000 Active 77 DOM
-
2026-06-09days on market $106,000 Active 76 DOM
-
2026-06-08days on market $106,000 Active 75 DOM
-
2026-06-07days on market $106,000 Active 74 DOM
-
2026-06-03days on market $106,000 Active 70 DOM
-
2026-06-02days on market $106,000 Active 69 DOM
-
2026-06-01days on market $106,000 Active 68 DOM
-
2026-05-31days on market $106,000 Active 67 DOM
-
2026-05-30remarks 699-char remark
-
2026-05-30days on market $106,000 Active 66 DOM
-
2026-05-08price $106,000 695-char remark
Show marketing remark (695 chars)
PRICE IMPROVEMENT on this Charming move-in ready cottage offering 2 bedrooms and 1 bathroom in a convenient location close to everything! This well-maintained home features updated flooring in the kitchen, adding a fresh and modern touch. A new mini-split system provides efficient heating and cooling for year-round comfort. Enjoy peace of mind with a brand new roof just installed. Perfect for a first-time homebuyer, downsizer, or investment opportunity--this home is full of value and ready for its next owner! Bonus room has a seperate entrance. There is also a gas stove hook up in the kitchen. Motivated seller. Buyers and Buyers agents do your own research on square footage and schools.
-
2026-03-25$112,000 Active 695-char remark
Show marketing remark (695 chars)
PRICE IMPROVEMENT on this Charming move-in ready cottage offering 2 bedrooms and 1 bathroom in a convenient location close to everything! This well-maintained home features updated flooring in the kitchen, adding a fresh and modern touch. A new mini-split system provides efficient heating and cooling for year-round comfort. Enjoy peace of mind with a brand new roof just installed. Perfect for a first-time homebuyer, downsizer, or investment opportunity--this home is full of value and ready for its next owner! Bonus room has a seperate entrance. There is also a gas stove hook up in the kitchen. Motivated seller. Buyers and Buyers agents do your own research on square footage and schools.
-
2025-11-25status Active
-
2025-11-08status Pending
-
2025-10-14status Active
-
2025-10-10price $87,000
-
2025-08-01price $89,900
-
2025-07-16$91,500 Active
-
2025-06-20price $98,900
-
2025-06-06price $104,000
-
2025-05-23$110,000 Active
ⓘ Source: listings_history table (triggers on properties + properties_extension) + one-shot
backfill from property_details.listing_events for pre-trigger history.
Tax reassessment forecast MO · Resets to sale price
- Current annual tax
- $469 · $39/mo
- Projected year-2 tax
- $951 · $79/mo
- Expected delta
- +$481/yr (+$40/mo · 102.6%)
ⓘ Screening estimate from a state-policy table — verify with the county assessor before closing.
Climate risk First Street
- Flood 1/10 Low FEMA zone X (unshaded) · 0% chance over 30 yrs
- Wildfire 1/10 Low
- Heat 5/10 Major 7 d/yr ≥104°F today · 19 d/yr by 30 yrs out
- Wind 2/10 Low
- Air quality 2/10 Low 1 unhealthy d/yr today · 2 by 30 yrs out
Nearby sold comps map
Loading sold comps map…
Walkable amenities ~0.75 mi
Loading nearby amenities…
Taxation est. · year 1
- Rental income
- $12,179
- − Mortgage interest
- −$5,490
- − Property taxes
- −$469
- − Insurance
- −$490
- − Repairs & maintenance
- −$974
- − Management
- −$974
- − Depreciation
- −$2,851
- Taxable income
- $931
- Est. tax owed @ 24.0%
- −$223
- After-tax cash flow
- $2,272/yr
For passive investors: Depreciation is non-cash, so a rental often shows a tax loss while cash-flowing — sheltering income. Rental losses are passive: they offset passive income freely, and up to $25,000/yr can offset ordinary (W-2) income if you actively participate and your MAGI is under $100k (phasing out to $0 by $150k); unused losses carry forward. On sale, claimed depreciation is recaptured at up to 25%, and gains may owe capital-gains tax (a 1031 exchange can defer both). Figures are a year-1 estimate at your 24.0% rate — not tax advice; consult a CPA.
Schools (NCES district)
- District
- Springfield R-XII
- NCES district ID
- 2928860
- Math proficiency
- 32% ▼ -2.00%
- Reading proficiency
- 46% ▼ -3.00%
- Median HH income
- $37,886
- Composite
- 32.45/100
- National rank
- #5717
- State rank
- #174 of 324 in MO
Livability — Springfield
- Score
- 75/100
- State rank
- #57
- US rank
- #4121
Category grades
Schools grade is shown separately in the Schools card above.
Census & demographics
- Census place
- Springfield, MO
- County
- Greene County · 244,327 people
- City population
- 223,044
- Metro
- Springfield, MO
- Population (ZIP)
- 46,739
- Household income
- $55,019
- Rent vs Own
- Severe rent burden
- 1818.0
Population outlook (Greene County) Hauer SSP2
- Today (2025)
- 319,054 people
- By 2030
- 335,135 · +5.0%
- By 2040
- 366,186 · +14.8%
- By 2050
- 397,431 · +24.6%
- By 2075
- 477,035 · +49.5%
- By 2100
- 520,828 · +63.2%
Race, ethnicity, and origin ACS 2023
- Neighborhood character
- Predominantly White (81%)
- Race & ethnicity
- White 81% Two or more races 8% Hispanic / Latino 5% Black 4% Asian 2%
- Common ancestry
- Slovak 2% Lithuanian 2% Italian 2%
- Foreign-born
- 3% · Canada, Vietnam
- Languages at home
- 95% English-only · Spanish 2% Vietnamese 1% Other Indo-European 1%
Political lean MEDSL · Greene
- 2024 margin
- Strong R (+20.8) · D 38.9% · R 59.7% · Other 1.4%
- 2008→2024 swing
- -5.0pp toward R · 2008: -15.8pp · 2024: -20.8pp
- All cycles
- 2024: R+20.8 2020: R+20.1 2016: R+27.4 2012: R+24.4 2008: R+15.8
Not yet ingested
- Civics
- —
Market trends
- HPI YoY
- ▼ -99.72%
- Current HPI
- 212.9826
- Rent YoY
- ▲ 4.82%
- Metro
- Springfield, MO
- State GDP YoY
- ▲ 1.84%
- F500 in state
- 20
Industry mix (Fortune 500 HQ in MO)
| Industry | F500 HQs | Revenue |
|---|---|---|
| Healthcare | 1 | $163B |
|
||
| Insurance | 1 | $21B |
|
||
| Industrial Technology | 1 | $17B |
|
||
| Retail | 1 | $16B |
|
||
| Industrial Distribution | 1 | $10B |
|
||
| Utilities | 1 | $9B |
|
||
Price history
-3.6% since first listed11 events — show timeline
- 2026-05-08 Price Changed $106,000 SOMO
- 2026-03-25 Listed $112,000 SOMO
- 2025-11-25 Relisted — SOMO
- 2025-11-08 Pending — SOMO
- 2025-10-14 Relisted — SOMO
- 2025-10-10 Price Changed $87,000 SOMO
- 2025-08-01 Price Changed $89,900 SOMO
- 2025-07-16 Listed $91,500 SOMO
- 2025-06-20 Price Changed $98,900 SOMO
- 2025-06-06 Price Changed $104,000 SOMO
- 2025-05-23 Listed $110,000 SOMO
Property tax history
+2.3%/yrLatest (2025): $469 · +25.1% YoY. Source: county tax records.
Cash-flow waterfall
monthlySold comps — $/sqft
last 12 mo · ≤1 miLoading sold comps…