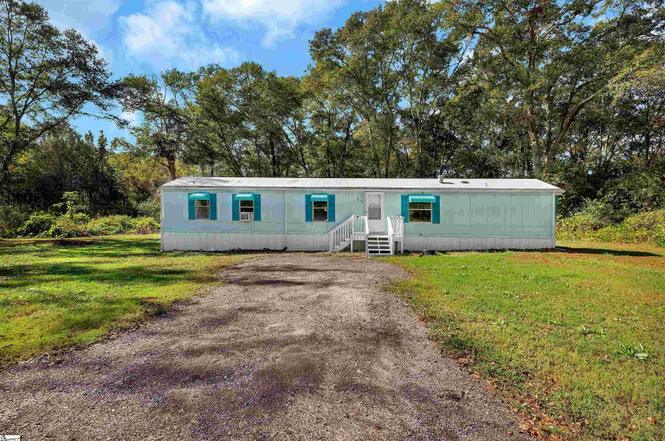
315 Shirley Cir · Fair Play, SC
Flood risk 1/10 · Minimal
- FEMA flood zone
- X (unshaded)
- Chance of flooding over 30 yrs
- 0.0%
- Est. flood insurance / yr
- $507 – $1,088
Fire risk 4/10 · Minor
- Est. fire insurance / yr
- $783 – $1,453
Heat risk 5/10 · Moderate
- Hot days now (above 105°F)
- 7 days/yr
- Hot days in 30 yrs
- 17 days/yr
Wind risk 2/10 · Minimal
- Chance of severe wind over 30 yrs
- 4.0%
Air-quality risk 4/10 · Minor
- Unhealthy air days now
- 4 days/yr
- Unhealthy air days in 30 yrs
- 5 days/yr
Risk factors via First Street. Map © Google.
Why this score? — see what drove the B grade
The composite is a weighted blend of 9 inputs, each scored 0–100. Each bar is that input's sub-score; the figure is the points it added to the 100-point composite (weight × sub-score).
- Cash flow +28.2/30.0
- DSCR +10.0/10.0
- ARV discount +7.5/15.0
- 1% rule +6.5/10.0
- Appreciation +5.0/10.0
- Schools +4.9/10.0
- Livability +3.1/5.0
- Rent growth +2.5/5.0
- Condition / age +2.5/5.0
$99,000
🖨 Deal sheet 📄 Offer letter ✓ Due diligence
Listing remarks MLS
Single Wide Mobile home located on a 1.28-acre level lot. Brand new waterproof and scratch resistant. New HVAC, updated electric, updated new tub, and updated door. Great new interior with 2 bedrooms and 2 full baths. Great lot with surrounding trees for privacy. Schedule your private showing today!
Key facts
- Updated tub
- Brand new hvac
- 1.28 acre lot
Tags
Neighborhood map
What this means for you Summary
Snapshot
- This is a 2-bed/2.0-bath manufactured listed at $99k.
Deal economics
- At list price, monthly cash flow is $313 ($4k/yr) — positive.
- The deal already cash-flows at list — no discount required.
- Meets the 1% rule at list price ($1k rent vs $99k).
- Recommended offer: $98k (1.5% below list) — sets the bar for market timing.
Location & tenants
- Location reads 62/100 on livability (#185 in SC) — a middle-class / working-renter tenant base. Strengths: housing A+, crime A, employment B; Watch: cost of living D+, amenities F, commute F.
- Anderson 04 (rural): math 56% / reading 60% proficiency, ranked #4 of 80 in SC (top 5%) — acceptable for families but not a draw, mixed tenant base, ~2y average lease.
- Zoned schools: Townville Elementary (math 67% / reading 62%, grade B, #56 of 597 statewide, top 10%, 281 students, 86% FRL) — zoned schools average 86% FRL vs 46% district-wide (40 pts higher); higher-poverty schools than district average — tighter screening recommended.
- Market conditions: 1 active listings in the ZIP; 1,255 units permitted in Anderson County in 2024 (0 in 5+ unit buildings).
Forward outlook
- In year one you build about $4k of equity ($684 loan paydown + $3k appreciation (3.0% local appreciation)).
- Anderson County population projected at +14% by 2050 — modest demand growth; plan on rents tracking national, not racing it.
- At projected returns (3.0% appreciation + 3.0% rent growth), your $28k cash investment doubles in ~4 years — after that, you're playing with house money.
- By year 9, paydown + projected appreciation supports a ~$31k cash-out refi (75% LTV) — recoverable capital for the next deal without selling this one.
Negotiation context
- It's been on market 21 days — a 2% lower offer ($98k) is reasonable based on typical stale-listing flexibility.
- 2 sale attempts since 2y ago with the ask held roughly flat each time — persistent listings suggest the price (not the market) is what's stuck; bring a comps-based counter.
Risks & watch-outs
- Climate carrying-cost: extreme-heat days projected 7→17/yr by 2055 (HVAC capex compounding) — expect insurance premiums to compound above CPI over the hold.
Questions for the listing agent
- Is there a deadline driving the sale (1031 exchange, divorce, estate, relocation)? That informs how much negotiation room exists.
- Schools are F-rated, which usually means shorter tenancies and higher turnover. Who's the typical renter profile here, and what's been the actual vacancy rate?
- What's the average days-on-market for RENTAL listings here right now (not sales)? A rising rental-DOM trend means longer vacancies and softer asking-rent achievability than the comps imply.
- What's the recent tenant-quality profile in this submarket — average credit score on applications, eviction rate, late-payment / NSF rate, and stable-employment percentage? A property-management company in the area should have these aggregated.
- How much new for-sale + rental construction is in the pipeline within 1–3 miles? Heavy new supply typically softens prices + rents 12–24 months out; constrained supply supports both.
Investment metrics
- 1% rule
- 1.15% ✓
- Cap rate
- 10.08%
- Cash-on-cash
- 13.54%
- DSCR
- 1.60
- GRM
- 7.3
CMA / ARV
No comps found within radius.
Projected returns pro-forma
3.0% appreciation · 3.0% rent growth · sell at horizon
- IRR
- 20.2%
- Equity multiple
- 2.15×
- Total profit
- $31,799
- Equity at exit
- $44,515
- IRR
- 21.3%
- Equity multiple
- 4.08×
- Total profit
- $85,244
- Equity at exit
- $68,602
Cash invested: $27,720 (down + closing). Projections, not guarantees.
Landlord ↔ Tenant lean methodology
- Overall (STATE)
- 90 Strongly Landlord-Friendly
- State South Carolina
- 90 Strongly Landlord-Friendly · R+6
- County
- — inherits STATE
- City
- — inherits STATE
ZIP-level market 29689-4434
- Active inventory
- 1
- Price-to-rent
- 7.3×
Monthly cashflow live
- Estimated rent
- $1,136 medium interval (Pro) →
- Mortgage (P&I)
- −$519
- Tax from tax record
- −$25 /mo · $296/yr
- Insurance
- −$41
- HOA
- −$0
- Vacancy / Maint / Mgmt
- −$239
- Net cashflow
- $313
Break-even live
UW: 25.0% down · 7.5% · 30yr · 1.5% tax · 5.0% vac · 8.0% maint · 8.0% mgmt
Financing live
Cash to close
- Down payment
- $24,750
- Closing costs
- $2,970
- Reserves months
- —
- Total cash needed
- —
Loan-product check · same deal, 3 products live
Conventional
25% down · 7.5% · 30yr
- Down + closing
- —
- Monthly P&I
- —
- Monthly cashflow
- —
- DSCR
- —
- Eligible?
- —
Personal DTI + credit; lowest rate.
DSCR
20% down · 8.5% · 30yr
- Down + closing
- —
- Monthly P&I
- —
- Monthly cashflow
- —
- DSCR
- —
- Eligible?
- —
No personal income docs; deal must DSCR.
Hard money
10% down · 12.0% · 12mo
- Down + closing
- —
- Monthly P&I
- —
- Monthly cashflow
- —
- DSCR
- —
- Eligible?
- —
Short-term bridge; refi at stabilization.
Listing history 5 events
-
2026-01-07historical Active Under Contract 300-char remark
Show marketing remark (300 chars)
Single Wide Mobile home located on a 1.28-acre level lot. Brand new waterproof and scratch resistant. New HVAC, updated electric, updated new tub, and updated door. Great new interior with 2 bedrooms and 2 full baths. Great lot with surrounding trees for privacy. Schedule your private showing today!
-
2024-12-02status Pending 300-char remark
Show marketing remark (300 chars)
Single Wide Mobile home located on a 1.28-acre level lot. Brand new waterproof and scratch resistant. New HVAC, updated electric, updated new tub, and updated door. Great new interior with 2 bedrooms and 2 full baths. Great lot with surrounding trees for privacy. Schedule your private showing today!
-
2024-12-02status Pending
Show marketing remark (300 chars)
Single Wide Mobile home located on a 1.28-acre level lot. Brand new waterproof and scratch resistant. New HVAC, updated electric, updated new tub, and updated door. Great new interior with 2 bedrooms and 2 full baths. Great lot with surrounding trees for privacy. Schedule your private showing today!
-
2024-11-11$99,000 Active 300-char remark
Show marketing remark (300 chars)
Single Wide Mobile home located on a 1.28-acre level lot. Brand new waterproof and scratch resistant. New HVAC, updated electric, updated new tub, and updated door. Great new interior with 2 bedrooms and 2 full baths. Great lot with surrounding trees for privacy. Schedule your private showing today!
-
2024-11-11$99,000 Active
Show marketing remark (300 chars)
Single Wide Mobile home located on a 1.28-acre level lot. Brand new waterproof and scratch resistant. New HVAC, updated electric, updated new tub, and updated door. Great new interior with 2 bedrooms and 2 full baths. Great lot with surrounding trees for privacy. Schedule your private showing today!
ⓘ Source: listings_history table (triggers on properties + properties_extension) + one-shot
backfill from property_details.listing_events for pre-trigger history.
Tax reassessment forecast SC · Resets to sale price
- Current annual tax
- $296 · $25/mo
- Projected year-2 tax
- $564 · $47/mo
- Expected delta
- +$268/yr (+$22/mo · 90.6%)
ⓘ Screening estimate from a state-policy table — verify with the county assessor before closing.
Climate risk First Street
- Flood 1/10 Low FEMA zone X (unshaded) · 0% chance over 30 yrs
- Wildfire 4/10 Moderate
- Heat 5/10 Major 7 d/yr ≥105°F today · 17 d/yr by 30 yrs out
- Wind 2/10 Low 4% chance of damaging wind over 30 yrs
- Air quality 4/10 Moderate 4 unhealthy d/yr today · 5 by 30 yrs out
Nearby sold comps map
Loading sold comps map…
Walkable amenities ~0.75 mi
Loading nearby amenities…
Taxation est. · year 1
- Rental income
- $13,638
- − Mortgage interest
- −$5,546
- − Property taxes
- −$296
- − Insurance
- −$495
- − Repairs & maintenance
- −$1,091
- − Management
- −$1,091
- − Depreciation
- −$2,880
- Taxable income
- $2,239
- Est. tax owed @ 24.0%
- −$537
- After-tax cash flow
- $3,215/yr
For passive investors: Depreciation is non-cash, so a rental often shows a tax loss while cash-flowing — sheltering income. Rental losses are passive: they offset passive income freely, and up to $25,000/yr can offset ordinary (W-2) income if you actively participate and your MAGI is under $100k (phasing out to $0 by $150k); unused losses carry forward. On sale, claimed depreciation is recaptured at up to 25%, and gains may owe capital-gains tax (a 1031 exchange can defer both). Figures are a year-1 estimate at your 24.0% rate — not tax advice; consult a CPA.
Schools (NCES district)
- District
- Anderson 04
- NCES district ID
- 4500870
- Math proficiency
- 56% ▼ -5.00%
- Reading proficiency
- 60% ▼ -1.00%
- Median HH income
- $48,338
- Composite
- 49.25/100
- National rank
- #2030
- State rank
- #4 of 80 in SC
Livability — Fair Play
- Score
- 62/100
- State rank
- #185
- US rank
- #16124
Category grades
Schools grade is shown separately in the Schools card above.
Census & demographics
No demographic data for this ZIP.
Market trends
- HPI YoY
- —
- Current HPI
- —
- Rent YoY
- —
- Metro
- —
- State GDP YoY
- ▲ 4.51%
- F500 in state
- 2
Industry mix (Fortune 500 HQ in SC)
| Industry | F500 HQs | Revenue |
|---|---|---|
| Packaging | 1 | $7B |
|
||
Price history
+0.0% since first listed5 events — show timeline
- 2026-01-07 Contingent — WUMLS
- 2024-12-02 Pending — WUMLS
- 2024-12-02 Pending — Greater Greenville MLS
- 2024-11-11 Listed $99,000 Greater Greenville MLS
- 2024-11-11 Listed $99,000 WUMLS
Property tax history
+5.9%/yrLatest (2025): $296 · +17.6% YoY. Source: county tax records.
Cash-flow waterfall
monthlySold comps — $/sqft
last 12 mo · ≤1 miLoading sold comps…