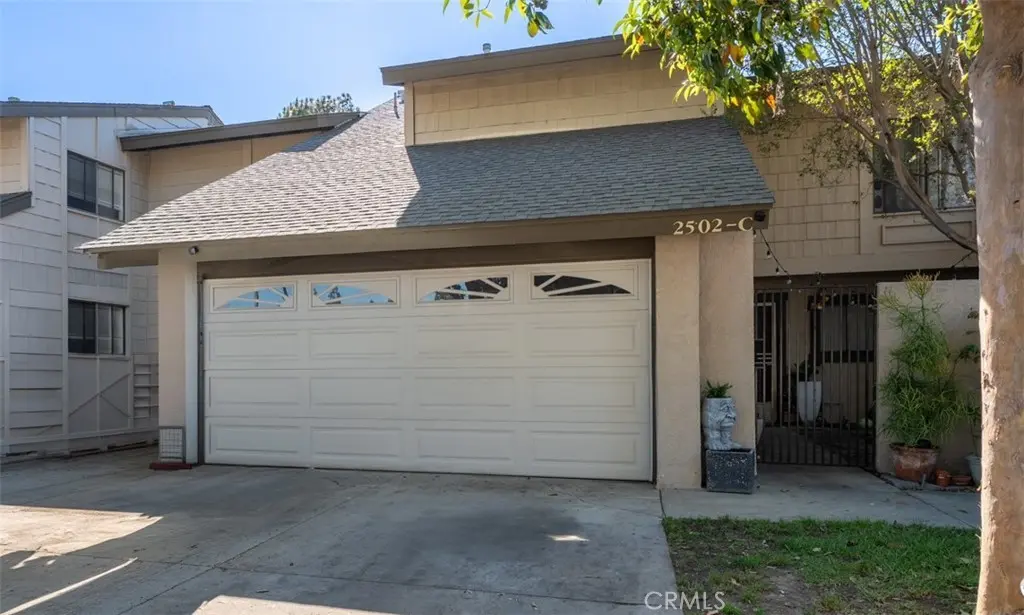
2502 N Tustin Unit C · Santa Ana, CA
Flood risk No data
- FEMA flood zone
- —
- Chance of flooding over 30 yrs
- —
- Est. flood insurance / yr
- —
Fire risk No data
- Est. fire insurance / yr
- —
Heat risk No data
- Hot days now (above threshold)
- —
- Hot days in 30 yrs
- —
Wind risk No data
- Chance of severe wind over 30 yrs
- —
Air-quality risk No data
- Unhealthy air days now
- —
- Unhealthy air days in 30 yrs
- —
Risk factors via First Street. Map © Google.
Why this score? — see what drove the C grade
The composite is a weighted blend of 9 inputs, each scored 0–100. Each bar is that input's sub-score; the figure is the points it added to the 100-point composite (weight × sub-score).
- Cash flow +16.1/30.0
- ARV discount +12.6/15.0
- 1% rule +7.2/10.0
- DSCR +5.0/10.0
- Schools +4.5/10.0
- Condition / age +3.8/5.0
- Rent growth +3.4/5.0
- Livability +2.8/5.0
- Appreciation +0.0/10.0
$319,900
🖨 Deal sheet 📄 Offer letter ✓ Due diligence
Listing remarks MLS
LEASE LAND PRICE TO SELL!! THIS ONE WILL NOT LAST! 2-Story Townhouse style unit on LEASE LAND boasting 1858 square feet of interior living space with 3BR plus DEN, 2.5 Bathrooms, one of the largest floorplan in desirable Shady Hallow gated community. This unit offers: an open floorplan, living-room with vaulted ceilings, dual fireplace, spacious kitchen with ceramic tile countertop, breakfast bar, and dining area. Private backyard off the dining area. Upstairs offers: the master suite with private bath, two large bedrooms and common bathroom. Downstairs DEN ideal for guest bedroom, office/or multi use. Direct 2-car Garage with direct access. Washer/Dryer hookup in garage, Community amenities: swimming pool, spa, and clubhouse. Centrally located to freeway, public transportations, Border City of Orange, minutes from Chapman University, and Old Towne Orange Plaza Don't miss out on this outstanding value!!! NOTE: THIS UNIT IS SITUATED ON LEASED LAND SUBJECT TO LEASE LAND ARRANGEMENT OF 1920.17/MONTHLY, PLUS HOA IS 550.00 MONTHTLY AND A SPECIAL ASSESSMENT OF $155.00 MONTHLY FOR APPROX 7 YEARS
Key facts
- $705 HOA
- 2 garage spots
- Community pool
Neighborhood map
What this means for you Summary
Snapshot
- This is a 3-bed/2.5-bath townhouse listed at $320k. Condition is rated good.
Deal economics
- At list price, monthly cash flow is $167 ($2k/yr) — positive.
- The deal already cash-flows at list — no discount required.
- Meets the 1% rule at list price ($4k rent vs $320k).
- Recommended offer: $301k (6.0% below list) — sets the bar for market timing.
- Cap rate 6.9% vs local median 2.5% in Santa Ana — top-decile yield for the area; either an underpriced asset or a hidden risk that comps aren't pricing in. Stress-test before assuming the spread holds.
Location & tenants
- Location reads 55/100 on livability (#871 in CA) — a working-class tenant base; expect higher turnover. Strengths: employment A; Watch: schools D, crime D-, amenities F.
- Orange Unified (urban): math 39% / reading 60% proficiency, ranked #127 of 517 in CA (top 25%) — families likely to look elsewhere, expect single-tenant / working-renter base with shorter leases.
- Market conditions: Rents rising (+3.7%/yr); 100 active listings in the ZIP; 16 comparable units currently listed for rent nearby; rentals lingering (median 44d on market — plan ~5-8 weeks vacancy on turnover, expect pricing pressure); 50% of comp listings sitting > 30 days — soft ceiling on asking rent; high-income renter base; 6,974 units permitted in Orange County in 2024 (3,839 in 5+ unit buildings).
- This rent runs 36% of the median local income ($129k/yr) — at the standard rent-burdened threshold; future hikes will face affordability resistance.
Forward outlook
- Local home prices are declining (-3.0%/yr); year-one equity from $2k of loan paydown is wiped out by about $10k of value loss. Plan a longer hold.
- Orange County population projected at +14% by 2050 — modest demand growth; plan on rents tracking national, not racing it.
Negotiation context
- It's been on market 72 days — a 6% lower offer ($301k) is reasonable based on typical stale-listing flexibility.
Questions for the listing agent
- It's been on market 72 days. Have you received any prior offers? Is the seller open to a 6% concession, seller financing, or rate buy-down credit?
- Built in 1975 — when were the roof, HVAC, electrical panel, plumbing, and water heater last replaced?
- What does the HOA fee cover, when was the last increase, and are there any pending special assessments or reserve-fund shortfalls?
- Why hasn't it sold? Are there any deal-killer items the seller is aware of (foundation, flood, title, zoning, code violations)?
- Is there a deadline driving the sale (1031 exchange, divorce, estate, relocation)? That informs how much negotiation room exists.
- Schools are D-rated, which usually means shorter tenancies and higher turnover. Who's the typical renter profile here, and what's been the actual vacancy rate?
- Crime grade is D in this area — have there been break-ins, vandalism, or insurance claims at this property in the last 3 years? What carrier currently insures it and at what premium?
- What's the average days-on-market for RENTAL listings here right now (not sales)? A rising rental-DOM trend means longer vacancies and softer asking-rent achievability than the comps imply.
- What's the recent tenant-quality profile in this submarket — average credit score on applications, eviction rate, late-payment / NSF rate, and stable-employment percentage? A property-management company in the area should have these aggregated.
- How much new for-sale + rental construction is in the pipeline within 1–3 miles? Heavy new supply typically softens prices + rents 12–24 months out; constrained supply supports both.
Investment metrics
- 1% rule
- 1.22% ✓
- Cap rate
- 6.92%
- Cash-on-cash
- 2.24%
- DSCR
- 1.10
- GRM
- 6.8
CMA / ARV
- ARV (median comp)
- $360,938
- List price
- $319,900
- Delta
- -11.37%
- Verdict
- UNDERPRICED
- Comps
- 20 within 1.0 mi
Show comp detail 6 sales within ~0.75 mi
| Address | Dist | Beds/Ba | Sqft | Sold | Price | $/sf | Match |
|---|---|---|---|---|---|---|---|
| 2510 N Tustin Avenue Ave #110 | 0.10mi | 3/2.5 | 1,858 (0%) | 10mo | $424,999 | $229 | 87 |
| 2622 N Tustin Ave Unit (147) | 0.16mi | 3/2.5 | 1,858 (0%) | 10mo | $340,000 | $183 | 84 |
| 2518 N Tustin Ave Unit E | 0.05mi | 4/2.5 (+1) | 1,617 (-13%) | 4mo | $360,000 | $223 | 68 |
| 2518 N Tustin #81 | 0.05mi | 4/2.5 (+1) | 1,679 (-10%) | 13mo | $365,000 | $217 | 66 |
| 2604 N Tustin Ave #49 | 0.11mi | 3/2.5 | 1,617 (-13%) | 10mo | $349,000 | $216 | 65 |
| 2620 N Tustin Ave #42 | 0.15mi | 3/2.5 | 1,617 (-13%) | 15mo | $368,000 | $228 | 59 |
Match score weights: distance 35% · size 25% · config 20% · recency 20%. Top-matched comps best support the ARV.
Projected returns pro-forma
-3.0% appreciation · 3.72% rent growth · sell at horizon
- IRR
- -11.5%
- Equity multiple
- 0.58×
- Total profit
- $-37,871
- Equity at exit
- $47,698
- IRR
- -0.8%
- Equity multiple
- 0.94×
- Total profit
- $-5,440
- Equity at exit
- $27,659
Cash invested: $89,572 (down + closing). Projections, not guarantees.
Landlord ↔ Tenant lean methodology
- Overall (STATE)
- 18 Strongly Tenant-Friendly
- State California
- 18 Strongly Tenant-Friendly · D+13
- County
- — inherits STATE
- City
- — inherits STATE
ZIP-level market 92705
- Rents YoY
- 3.7%
- Active inventory
- 100
- Price-to-rent
- 6.8×
Monthly cashflow live
- Estimated rent
- $3,902 high interval (Pro) →
- Mortgage (P&I)
- −$1,678
- Tax est. 1.5%
- −$400 /mo · $4,798/yr
- Insurance
- −$133
- HOA
- −$705
- Vacancy / Maint / Mgmt
- −$819
- Net cashflow
- $167
Break-even live
UW: 25.0% down · 7.5% · 30yr · 1.5% tax · 5.0% vac · 8.0% maint · 8.0% mgmt
Financing live
Cash to close
- Down payment
- $79,975
- Closing costs
- $9,597
- Reserves months
- —
- Total cash needed
- —
Loan-product check · same deal, 3 products live
Conventional
25% down · 7.5% · 30yr
- Down + closing
- —
- Monthly P&I
- —
- Monthly cashflow
- —
- DSCR
- —
- Eligible?
- —
Personal DTI + credit; lowest rate.
DSCR
20% down · 8.5% · 30yr
- Down + closing
- —
- Monthly P&I
- —
- Monthly cashflow
- —
- DSCR
- —
- Eligible?
- —
No personal income docs; deal must DSCR.
Hard money
10% down · 12.0% · 12mo
- Down + closing
- —
- Monthly P&I
- —
- Monthly cashflow
- —
- DSCR
- —
- Eligible?
- —
Short-term bridge; refi at stabilization.
Rent comps 16 comps
| Address | Beds | Baths | Sqft | Rent | $/sqft | DOM | Units | Dist |
|---|---|---|---|---|---|---|---|---|
| 819 S Ponderosa St Orange, CA | 2.0 | 2.0 | 1300 | $2,980 | $2.29 | 43d | 1 | 0.32mi |
| 2243 E Santa Clara Ave Santa Ana, CA | 1.0–2.0 | 1.0–2.0 | 991 | $2,925 | $2.95 | 24d | 3 | 0.34mi |
| 2215 E Avalon Ave Santa Ana, CA | 3.0 | 2.0 | 1315 | $1,400 | $1.06 | 43d | 1 | 0.39mi |
| 2210 E Avalon Ave Unit 2210 Santa Ana, CA | 3.0 | 2.0 | 1325 | $3,800 | $2.87 | 43d | 1 | 0.41mi |
| 1600 Mabury St Santa Ana, CA | 3.0 | 2.0 | 1480 | $3,595 | $2.43 | 43d | 1 | 0.95mi |
| 817 E Palmyra Ave Orange, CA | 2.0 | 2.0 | 1656 | $3,000 | $1.81 | 21d | 1 | 1.03mi |
| 328 S Wheeler Pl Orange, CA | 4.0 | 2.0 | 2265 | $4,500 | $1.99 | 43d | 1 | 1.12mi |
| 2737 Burly Ave Orange, CA | 4.0 | 3.0 | 2062 | $5,750 | $2.79 | 43d | 1 | 1.28mi |
| 408 W La Veta Ave Orange, CA | 3.0 | 2.0 | 1439 | $4,000 | $2.78 | 43d | 1 | 1.30mi |
| 181 N Waverly St Orange, CA | 3.0 | 2.0 | 1522 | $4,900 | $3.22 | 43d | 1 | 1.31mi |
| 1710 E Fruit St Santa Ana, CA | 3.0 | 2.0 | 2000 | $4,200 | $2.10 | 24d | 1 | 1.32mi |
| 401 W La Veta Ave Orange, CA | 2.0–3.0 | 2.0–2.5 | 1152 | $3,695 | $3.21 | 10d | 6 | 1.33mi |
| 850 W Town and Country Rd Orange, CA | 3.0 | 1.0–2.0 | 1008 | $4,410 | $4.38 | 1d | 27 | 1.41mi |
| 345 N Shattuck Pl Orange, CA | 3.0 | 2.0 | 1421 | $5,195 | $3.66 | 12d | 1 | 1.47mi |
| 345 N Shattuck Pl Orange, CA | 3.0 | 1.5 | 1434 | $5,195 | $3.62 | 16d | 1 | 1.47mi |
| 250 N Cleveland St Orange, CA | 3.0 | 1.0 | 1280 | $4,500 | $3.52 | 18d | 1 | 1.49mi |
HOA detail
- Monthly dues
- $705 · $8,460/yr
- Likely covers
- poolsecurity
- ⚠ Special-assessment mentions
-
…IS SITUATED ON LEASED LAND SUBJECT TO LEASE LAND ARRANGEMENT OF 1920.17/MONTHLY, PLUS HOA IS 550.00 MONTHTLY AND A SPECIAL ASSESSMENT OF $155.00 MONTHLY FOR APPROX 7 YEARS
Listing history 15 events
-
2026-06-18days on market $319,900 Active 72 DOM
-
2026-06-17days on market $319,900 Active 71 DOM
-
2026-06-16days on market $319,900 Active 70 DOM
-
2026-06-15days on market $319,900 Active 69 DOM
-
2026-06-13days on market $319,900 Active 67 DOM
-
2026-06-13days on market $319,900 Active 66 DOM
-
2026-06-09days on market $319,900 Active 63 DOM
-
2026-06-08days on market $319,900 Active 62 DOM
-
2026-06-07days on market $319,900 Active 61 DOM
-
2026-06-04days on market $319,900 Active 58 DOM
-
2026-06-03days on market $319,900 Active 57 DOM
-
2026-06-02days on market $319,900 Active 56 DOM
-
2026-06-01days on market $319,900 Active 55 DOM
-
2026-05-31days on market $319,900 Active 54 DOM
-
2026-04-07$335,000 Active 1110-char remark
Show marketing remark (1110 chars)
LEASE LAND PRICE TO SELL!! THIS ONE WILL NOT LAST! 2-Story Townhouse style unit on LEASE LAND boasting 1858 square feet of interior living space with 3BR plus DEN, 2.5 Bathrooms, one of the largest floorplan in desirable Shady Hallow gated community. This unit offers: an open floorplan, living-room with vaulted ceilings, dual fireplace, spacious kitchen with ceramic tile countertop, breakfast bar, and dining area. Private backyard off the dining area. Upstairs offers: the master suite with private bath, two large bedrooms and common bathroom. Downstairs DEN ideal for guest bedroom, office/or multi use. Direct 2-car Garage with direct access. Washer/Dryer hookup in garage, Community amenities: swimming pool, spa, and clubhouse. Centrally located to freeway, public transportations, Border City of Orange, minutes from Chapman University, and Old Towne Orange Plaza Don't miss out on this outstanding value!!! NOTE: THIS UNIT IS SITUATED ON LEASED LAND SUBJECT TO LEASE LAND ARRANGEMENT OF 1920.17/MONTHLY, PLUS HOA IS 550.00 MONTHTLY AND A SPECIAL ASSESSMENT OF $155.00 MONTHLY FOR APPROX 7 YEARS
ⓘ Source: listings_history table (triggers on properties + properties_extension) + one-shot
backfill from property_details.listing_events for pre-trigger history.
Nearby sold comps map
Loading sold comps map…
Walkable amenities ~0.75 mi
Loading nearby amenities…
Taxation est. · year 1
- Rental income
- $46,824
- − Mortgage interest
- −$17,919
- − Property taxes
- −$4,798
- − Insurance
- −$1,600
- − Repairs & maintenance
- −$3,746
- − Management
- −$3,746
- − HOA
- −$8,460
- − Depreciation
- −$9,306
- Taxable loss
- −$2,751
- Est. tax savings @ 24.0%
- +$660
- After-tax cash flow
- $2,662/yr
For passive investors: Depreciation is non-cash, so a rental often shows a tax loss while cash-flowing — sheltering income. Rental losses are passive: they offset passive income freely, and up to $25,000/yr can offset ordinary (W-2) income if you actively participate and your MAGI is under $100k (phasing out to $0 by $150k); unused losses carry forward. On sale, claimed depreciation is recaptured at up to 25%, and gains may owe capital-gains tax (a 1031 exchange can defer both). Figures are a year-1 estimate at your 24.0% rate — not tax advice; consult a CPA.
Condition & rehab AI · 6 photos
This 2-story townhouse in a desirable gated community offers a spacious floorplan with modern amenities and good condition. Minor exterior touch-ups and cleaning would significantly enhance its curb appeal and value.
Value-add opportunities
- Both Paint exterior trim — Enhances curb appeal and value
- Both Clean gutters — Improves drainage and overall appearance
Renovation cost estimate screening
Value-add ROI direction
- Both Paint exterior trim — Enhances curb appeal and value ↑
- Both Clean gutters — Improves drainage and overall appearance ↑
ⓘ Cost ranges are severity-bucket heuristics (US national rule-of-thumb). Get contractor quotes + a written scope before underwriting a rehab budget.
Schools (NCES district)
- District
- Orange Unified
- NCES district ID
- 0628650
- Math proficiency
- 39% ▼ -6.00%
- Reading proficiency
- 60% ▲ 3.00%
- Median HH income
- $83,557
- Composite
- 45.5/100
- National rank
- #2609
- State rank
- #127 of 517 in CA
Livability — Santa Ana
- Score
- 55/100
- State rank
- #871
- US rank
- #23502
Category grades
Schools grade is shown separately in the Schools card above.
Census & demographics
- Census place
- Santa Ana, CA
- County
- Orange County · 3,096,323 people
- City population
- 288,255
- Metro
- Los Angeles-Long Beach-Anaheim, CA
- Population (ZIP)
- 48,781
- Household income
- $129,331
- Rent vs Own
- Severe rent burden
- 1962.0
Population outlook (Orange County) Hauer SSP2
- Today (2025)
- 3,477,456 people
- By 2030
- 3,613,117 · +3.9%
- By 2040
- 3,835,945 · +10.3%
- By 2050
- 3,968,736 · +14.1%
- By 2075
- 4,097,053 · +17.8%
- By 2100
- 3,903,633 · +12.3%
Race, ethnicity, and origin ACS 2023
- Neighborhood character
- Diverse neighborhood (Simpson 0.64)
- Race & ethnicity
- Hispanic / Latino 48% White 34% Two or more races 17% Asian 11% Black 1%
- Hispanic origin (detail)
- Mexican 42%
- Common ancestry
- Lithuanian 2% Italian 1% Romanian 1%
- Foreign-born
- 25% · Canada, Vietnam, China
- Languages at home
- 53% English-only · Spanish 36% Other Indo-European 3% Chinese 2%
Political lean MEDSL · Orange
- 2024 margin
- Toss-up / Even · D 49.7% · R 47.1% · Other 3.2%
- 2008→2024 swing
- +5.2pp toward D · 2008: -2.6pp · 2024: 2.6pp
- All cycles
- 2024: D+2.6 2020: D+9.0 2016: D+7.7 2012: R+8.3 2008: R+2.6
Not yet ingested
- Civics
- —
Market trends
- HPI YoY
- ▼ -831.43%
- Current HPI
- 453.5303
- Rent YoY
- ▲ 3.72%
- Metro
- Los Angeles-Long Beach-Anaheim, CA
- State GDP YoY
- ▲ 3.21%
- F500 in state
- 116
Industry mix (Fortune 500 HQ in CA)
| Industry | F500 HQs | Revenue |
|---|---|---|
| Technology | 27 | $1,492B |
|
||
| Financial Services | 3 | $174B |
|
||
| Retail | 3 | $44B |
|
||
| Insurance | 3 | $26B |
|
||
| Media / Entertainment | 2 | $115B |
|
||
| Pharmaceuticals / Biotech | 2 | $62B |
|
||
Price history
1 event — show timeline
- 2026-04-07 Listed $335,000 CRMLS
Cash-flow waterfall
monthlySold comps — $/sqft
last 12 mo · ≤1 miLoading sold comps…