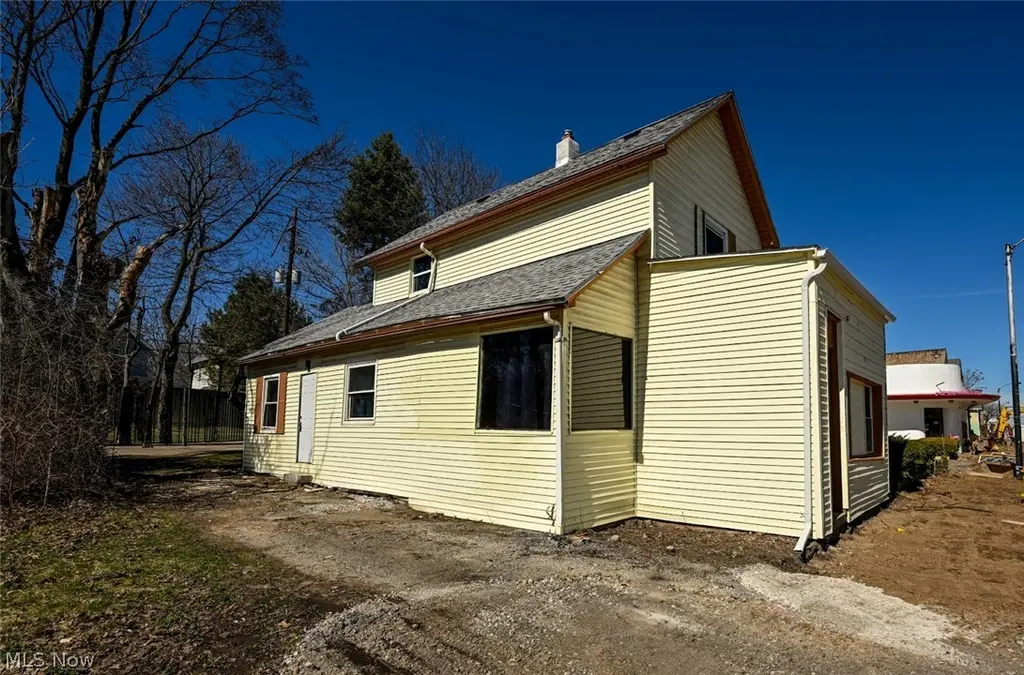
868 N Main St · Akron, OH
Flood risk No data
- FEMA flood zone
- —
- Chance of flooding over 30 yrs
- —
- Est. flood insurance / yr
- —
Fire risk No data
- Est. fire insurance / yr
- —
Heat risk No data
- Hot days now (above threshold)
- —
- Hot days in 30 yrs
- —
Wind risk No data
- Chance of severe wind over 30 yrs
- —
Air-quality risk No data
- Unhealthy air days now
- —
- Unhealthy air days in 30 yrs
- —
Risk factors via First Street. Map © Google.
Why this score? — see what drove the B grade
The composite is a weighted blend of 9 inputs, each scored 0–100. Each bar is that input's sub-score; the figure is the points it added to the 100-point composite (weight × sub-score).
- Cash flow +30.0/30.0
- ARV discount +14.1/15.0
- DSCR +10.0/10.0
- 1% rule +9.5/10.0
- Livability +4.0/5.0
- Rent growth +3.7/5.0
- Schools +2.1/10.0
- Condition / age +1.0/5.0
- Appreciation +0.0/10.0
$105,000
🖨 Deal sheet 📄 Offer letter ✓ Due diligence
Listing remarks MLS
Charming and full of character, this 2,372 sq ft single-family home built in 1910 blends classic craftsmanship with everyday comfort. The home offers three well-proportioned bedrooms and one and a half bathrooms, providing a functional layout ideal for both daily living and entertaining. Original architectural details reflect the home’s historic roots, while generous natural light creates a warm and inviting atmosphere throughout. With its timeless appeal, thoughtful floor plan, and enduring construction, this residence is a wonderful opportunity for those seeking a home with personality, history, and livability
Key facts
- 4,081 sq ft lot
- Built 1910
- Listed 99 days
Neighborhood map
What this means for you Summary
Snapshot
- This is a 3-bed/1.5-bath single-family listed at $105k. Condition is rated poor.
Deal economics
- At list price, monthly cash flow is $479 ($6k/yr) — positive.
- The deal already cash-flows at list — no discount required.
- Meets the 1% rule at list price ($2k rent vs $105k).
- Recommended offer: $96k (9.0% below list) — sets the bar for market timing.
- Cap rate 11.8% vs local median 6.6% in Akron — top-decile yield for the area; either an underpriced asset or a hidden risk that comps aren't pricing in. Stress-test before assuming the spread holds.
Location & tenants
- Location reads 81/100 on livability (#104 in OH, #1,591 nationally) — a professional / high-income tenant draw. Strengths: amenities A+, commute A+, cost of living A+; Watch: crime F, employment F.
- Akron City (urban): math 22% / reading 30% proficiency, ranked #602 of 656 in OH (top 92%) — low school quality limits family demand, transient renter base, plan for 1-2y turnover; 66% free/reduced lunch — lower-income household profile, screen leases tightly.
- Market conditions: Rents rising fast (+4.8%/yr); 86 active listings in the ZIP; 2 comparable units currently listed for rent nearby; lower-income renter base — watch delinquency; 1,114 units permitted in Summit County in 2024 (397 in 5+ unit buildings).
- This rent runs 45% of the median local income ($41k/yr) — at the standard rent-burdened threshold; future hikes will face affordability resistance.
Forward outlook
- Local home prices are declining (-3.0%/yr); year-one equity from $726 of loan paydown is wiped out by about $3k of value loss. Plan a longer hold.
- Summit County population projected to shrink 6% by 2050 — rents likely to lag national; underwrite the cash flow, not the appreciation.
- At projected returns (-3.0% appreciation + 4.8% rent growth), your $29k cash investment doubles in ~6 years — after that, you're playing with house money.
Negotiation context
- It's been on market 99 days — a 9% lower offer ($96k) is reasonable based on typical stale-listing flexibility.
- 2 sale attempts; this cycle's ask has dropped $20k (16%) from the opening price — seller is motivated, your offer sets the floor, not the list.
- Current owner paid $26k; list at $105k implies a 304% gain — meaningful room to come down on a strong offer.
Risks & watch-outs
- Watch-outs: built in 1910 — expect roof / HVAC / electrical / plumbing capex.
Questions for the listing agent
- It's been on market 99 days. Have you received any prior offers? Is the seller open to a 9% concession, seller financing, or rate buy-down credit?
- Have any recent inspections been done? Can we get a copy of the seller's disclosures and any deferred-maintenance estimates?
- Built in 1910 — when were the roof, HVAC, electrical panel, plumbing, and water heater last replaced?
- Why hasn't it sold? Are there any deal-killer items the seller is aware of (foundation, flood, title, zoning, code violations)?
- Is there a deadline driving the sale (1031 exchange, divorce, estate, relocation)? That informs how much negotiation room exists.
- Crime grade is F in this area — have there been break-ins, vandalism, or insurance claims at this property in the last 3 years? What carrier currently insures it and at what premium?
- What's the average days-on-market for RENTAL listings here right now (not sales)? A rising rental-DOM trend means longer vacancies and softer asking-rent achievability than the comps imply.
- What's the recent tenant-quality profile in this submarket — average credit score on applications, eviction rate, late-payment / NSF rate, and stable-employment percentage? A property-management company in the area should have these aggregated.
- How much new for-sale + rental construction is in the pipeline within 1–3 miles? Heavy new supply typically softens prices + rents 12–24 months out; constrained supply supports both.
Investment metrics
- 1% rule
- 1.45% ✓
- Cap rate
- 11.77%
- Cash-on-cash
- 19.55%
- DSCR
- 1.87
- GRM
- 5.7
CMA / ARV
- ARV (median comp)
- $123,173
- List price
- $105,000
- Delta
- -14.75%
- Verdict
- UNDERPRICED
- Comps
- 20 within 1.0 mi
Show comp detail 4 sales within ~0.75 mi
| Address | Dist | Beds/Ba | Sqft | Sold | Price | $/sf | Match |
|---|---|---|---|---|---|---|---|
| 370 E Tallmadge Ave | 0.67mi | 4/1.5 (+1) | 2,187 (-8%) | 5mo | $139,900 | $64 | 47 |
| 728 Wall St | 0.40mi | 4/2.0 (+1) | 2,020 (-15%) | 20mo | $143,000 | $71 | 33 |
| 1255 N Howard St | 0.70mi | 3/1.5 | 2,050 (-14%) | 14mo | $213,500 | $104 | 33 |
| 643 Oxford Ave | 0.65mi | 4/3.0 (+1) | 2,076 (-12%) | 20mo | $170,000 | $82 | 22 |
Match score weights: distance 35% · size 25% · config 20% · recency 20%. Top-matched comps best support the ARV.
Projected returns pro-forma
-3.0% appreciation · 4.82% rent growth · sell at horizon
- IRR
- 13.6%
- Equity multiple
- 1.56×
- Total profit
- $16,358
- Equity at exit
- $15,656
- IRR
- 23.8%
- Equity multiple
- 3.24×
- Total profit
- $65,727
- Equity at exit
- $9,078
Cash invested: $29,400 (down + closing). Projections, not guarantees.
Landlord ↔ Tenant lean methodology
- Overall (STATE)
- 73 Landlord-Friendly
- State Ohio
- 73 Landlord-Friendly · R+6
- County
- — inherits STATE
- City
- — inherits STATE
ZIP-level market 44310
- Rents YoY
- 4.8%
- Active inventory
- 86
- Price-to-rent
- 5.7×
Monthly cashflow live
- Estimated rent
- $1,525 medium interval (Pro) →
- Mortgage (P&I)
- −$551
- Tax est. 1.5%
- −$131 /mo · $1,575/yr
- Insurance
- −$44
- HOA
- −$0
- Vacancy / Maint / Mgmt
- −$320
- Net cashflow
- $479
Break-even live
UW: 25.0% down · 7.5% · 30yr · 1.5% tax · 5.0% vac · 8.0% maint · 8.0% mgmt
Financing live
Cash to close
- Down payment
- $26,250
- Closing costs
- $3,150
- Reserves months
- —
- Total cash needed
- —
Loan-product check · same deal, 3 products live
Conventional
25% down · 7.5% · 30yr
- Down + closing
- —
- Monthly P&I
- —
- Monthly cashflow
- —
- DSCR
- —
- Eligible?
- —
Personal DTI + credit; lowest rate.
DSCR
20% down · 8.5% · 30yr
- Down + closing
- —
- Monthly P&I
- —
- Monthly cashflow
- —
- DSCR
- —
- Eligible?
- —
No personal income docs; deal must DSCR.
Hard money
10% down · 12.0% · 12mo
- Down + closing
- —
- Monthly P&I
- —
- Monthly cashflow
- —
- DSCR
- —
- Eligible?
- —
Short-term bridge; refi at stabilization.
Rent comps 2 comps
| Address | Beds | Baths | Sqft | Rent | $/sqft | DOM | Units | Dist |
|---|---|---|---|---|---|---|---|---|
| 1358 N Howard St Akron, OH | 4.0 | 2.0 | 2100 | $1,800 | $0.86 | 13d | 1 | 0.86mi |
| 678 Hollibaugh Ave Akron, OH | 2.0 | 1.0 | 2482 | $1,400 | $0.56 | 14d | 1 | 1.44mi |
Listing history 21 events
-
2026-06-18days on market $105,000 Active 99 DOM
-
2026-06-17days on market $105,000 Active 98 DOM
-
2026-06-16days on market $105,000 Active 97 DOM
-
2026-06-15days on market $105,000 Active 96 DOM
-
2026-06-14days on market $105,000 Active 94 DOM
-
2026-06-13days on market $105,000 Active 93 DOM
-
2026-06-10pricedays on market $105,000 Active 91 DOM
-
2026-06-09days on market $110,000 Active 90 DOM
-
2026-06-08days on market $110,000 Active 89 DOM
-
2026-06-07days on market $110,000 Active 88 DOM
-
2026-06-05days on market $110,000 Active 85 DOM
-
2026-06-03days on market $110,000 Active 84 DOM
-
2026-06-02days on market $110,000 Active 83 DOM
-
2026-06-01days on market $110,000 Active 82 DOM
-
2026-05-31days on market $110,000 Active 81 DOM
-
2026-05-31days on market $110,000 Active 80 DOM
-
2026-04-27price $119,000 625-char remark
Show marketing remark (625 chars)
Charming and full of character, this 2,372 sq ft single-family home built in 1910 blends classic craftsmanship with everyday comfort. The home offers three well-proportioned bedrooms and one and a half bathrooms, providing a functional layout ideal for both daily living and entertaining. Original architectural details reflect the home’s historic roots, while generous natural light creates a warm and inviting atmosphere throughout. With its timeless appeal, thoughtful floor plan, and enduring construction, this residence is a wonderful opportunity for those seeking a home with personality, history, and livability
-
2026-03-11$125,000 Active 625-char remark
Show marketing remark (625 chars)
Charming and full of character, this 2,372 sq ft single-family home built in 1910 blends classic craftsmanship with everyday comfort. The home offers three well-proportioned bedrooms and one and a half bathrooms, providing a functional layout ideal for both daily living and entertaining. Original architectural details reflect the home’s historic roots, while generous natural light creates a warm and inviting atmosphere throughout. With its timeless appeal, thoughtful floor plan, and enduring construction, this residence is a wonderful opportunity for those seeking a home with personality, history, and livability
-
2025-08-21soldstatus $26,000 Closed 187-char remark
Show marketing remark (187 chars)
For investors or demo and lot use only. For sale, residentially used storefront home on Main St. Interior in need of complete renovation. Water and gas have been turned off for some time.
-
2025-08-11status Pending 187-char remark
Show marketing remark (187 chars)
For investors or demo and lot use only. For sale, residentially used storefront home on Main St. Interior in need of complete renovation. Water and gas have been turned off for some time.
-
2025-08-09$30,000 Active 187-char remark
Show marketing remark (187 chars)
For investors or demo and lot use only. For sale, residentially used storefront home on Main St. Interior in need of complete renovation. Water and gas have been turned off for some time.
ⓘ Source: listings_history table (triggers on properties + properties_extension) + one-shot
backfill from property_details.listing_events for pre-trigger history.
Nearby sold comps map
Loading sold comps map…
Walkable amenities ~0.75 mi
Loading nearby amenities…
Taxation est. · year 1
- Rental income
- $18,298
- − Mortgage interest
- −$5,882
- − Property taxes
- −$1,575
- − Insurance
- −$525
- − Repairs & maintenance
- −$1,464
- − Management
- −$1,464
- − Depreciation
- −$3,055
- Taxable income
- $4,334
- Est. tax owed @ 24.0%
- −$1,040
- After-tax cash flow
- $4,708/yr
For passive investors: Depreciation is non-cash, so a rental often shows a tax loss while cash-flowing — sheltering income. Rental losses are passive: they offset passive income freely, and up to $25,000/yr can offset ordinary (W-2) income if you actively participate and your MAGI is under $100k (phasing out to $0 by $150k); unused losses carry forward. On sale, claimed depreciation is recaptured at up to 25%, and gains may owe capital-gains tax (a 1031 exchange can defer both). Figures are a year-1 estimate at your 24.0% rate — not tax advice; consult a CPA.
Condition & rehab AI · 13 photos
This home requires extensive repairs and updates to improve its condition and increase its value. The roof, exterior siding, flooring, interior walls, HVAC system, and plumbing and utilities all need attention. The home is currently in poor condition and would benefit from a thorough renovation.
Repairs flagged
- Major roof — The roof appears to be in poor condition with visible damage.
- Major exterior siding — The exterior siding is peeling and in need of repainting.
- Major flooring — The flooring in the interior appears to be carpeted and in need of replacement.
- Major interior walls/paint — The interior walls and paint appear to be in poor condition, with peeling paint and potential damage.
- Major HVAC system — The HVAC system appears to be old and in need of replacement.
- Major plumbing and utilities — The water and gas have been turned off for some time, indicating potential issues with the plumbing and utilities.
Value-add opportunities
- Both roof replacement — A new roof will improve the home's appearance and increase its value.
- Both exterior siding repainting — Repainting the exterior siding will improve the home's curb appeal and increase its value.
- Both flooring replacement — Replacing the carpeted flooring with a more modern and durable option will improve the home's appearance and increase its value.
- Both HVAC system replacement — Replacing the old HVAC system with a new, energy-efficient model will improve the home's comfort and increase its value.
- Both plumbing and utility repairs — Repairing the plumbing and utility issues will ensure the home is functional and increase its value.
- Both interior paint and repairs — Painting the interior walls and addressing any damage will improve the home's appearance and increase its value.
Renovation cost estimate screening
| Repair item | Severity | Est. cost |
|---|---|---|
| roof · The roof appears to be in poor condition with visible damage. | Major | $15,000–50,000 |
| exterior siding · The exterior siding is peeling and in need of repainting. | Major | $15,000–50,000 |
| flooring · The flooring in the interior appears to be carpeted and in need of replacement. | Major | $15,000–50,000 |
| interior walls/paint · The interior walls and paint appear to be in poor condition, with peeling paint and potential damage. | Major | $15,000–50,000 |
| HVAC system · The HVAC system appears to be old and in need of replacement. | Major | $15,000–50,000 |
| plumbing and utilities · The water and gas have been turned off for some time, indicating potential issues with the plumbing and utilities. | Major | $15,000–50,000 |
| Total estimated repair cost · 6 items | $90,000–300,000 |
Value-add ROI direction
- Both roof replacement — A new roof will improve the home's appearance and increase its value. ↑
- Both exterior siding repainting — Repainting the exterior siding will improve the home's curb appeal and increase its value. ↑
- Both flooring replacement — Replacing the carpeted flooring with a more modern and durable option will improve the home's appearance and increase its value. ↑
- Both HVAC system replacement — Replacing the old HVAC system with a new, energy-efficient model will improve the home's comfort and increase its value. ↑
- Both plumbing and utility repairs — Repairing the plumbing and utility issues will ensure the home is functional and increase its value. ↑
- Both interior paint and repairs — Painting the interior walls and addressing any damage will improve the home's appearance and increase its value. ↑
ⓘ Cost ranges are severity-bucket heuristics (US national rule-of-thumb). Get contractor quotes + a written scope before underwriting a rehab budget.
Schools (NCES district)
- District
- Akron City
- NCES district ID
- 3904348
- Math proficiency
- 22% ▼ -17.00%
- Reading proficiency
- 30% ▼ -12.00%
- Median HH income
- $33,811
- Composite
- 21.31/100
- National rank
- #8383
- State rank
- #602 of 656 in OH
Livability — Akron
- Score
- 81/100
- State rank
- #104
- US rank
- #1591
Category grades
Schools grade is shown separately in the Schools card above.
Census & demographics
- Census place
- Akron, OH
- County
- Summit County · 440,783 people
- City population
- 174,375
- Metro
- Akron, OH
- Population (ZIP)
- 25,496
- Household income
- $41,066
- Rent vs Own
- Severe rent burden
- 2058.0
Population outlook (Summit County) Hauer SSP2
- Today (2025)
- 546,583 people
- By 2030
- 544,028 · -0.5%
- By 2040
- 531,363 · -2.8%
- By 2050
- 514,923 · -5.8%
- By 2075
- 481,765 · -11.9%
- By 2100
- 432,265 · -20.9%
Race, ethnicity, and origin ACS 2023
- Neighborhood character
- Highly diverse neighborhood (Simpson 0.73)
- Race & ethnicity
- White 40% Black 25% Asian 20% Hispanic / Latino 10% Two or more races 9%
- Hispanic origin (detail)
- Mexican 6% Puerto Rican 2%
- Common ancestry
- Romanian 2% Slovak 1% Italian 1%
- Foreign-born
- 25% · Canada, India, Philippines
- Languages at home
- 69% English-only · Other Indo-European 13% Spanish 7% Other Asian/Pacific 6%
Political lean MEDSL · Summit
- 2024 margin
- Lean D (+7.0) · D 53.0% · R 46.0%
- 2008→2024 swing
- -9.6pp toward R · 2008: 16.6pp · 2024: 7.0pp
- All cycles
- 2024: D+7.0 2020: D+9.6 2016: D+8.2 2012: D+14.8 2008: D+16.6
Not yet ingested
- Civics
- —
Market trends
- HPI YoY
- ▼ -194.41%
- Current HPI
- 203.4431
- Rent YoY
- ▲ 4.82%
- Metro
- Akron, OH
- State GDP YoY
- ▲ 1.98%
- F500 in state
- 48
Industry mix (Fortune 500 HQ in OH)
| Industry | F500 HQs | Revenue |
|---|---|---|
| Insurance | 3 | $145B |
|
||
| Industrial Machinery | 3 | $49B |
|
||
| Financial Services | 3 | $24B |
|
||
| Consumer Goods | 2 | $93B |
|
||
| Aerospace / Defense | 2 | $47B |
|
||
| Utilities | 2 | $33B |
|
||
Price history
+296.7% since first listed5 events — show timeline
- 2026-04-27 Price Changed $119,000 MLSNOW
- 2026-03-11 Listed $125,000 MLSNOW
- 2025-08-21 Sold (MLS) $26,000 MLSNOW
- 2025-08-11 Pending — MLSNOW
- 2025-08-09 Listed $30,000 MLSNOW
Cash-flow waterfall
monthlySold comps — $/sqft
last 12 mo · ≤1 miLoading sold comps…