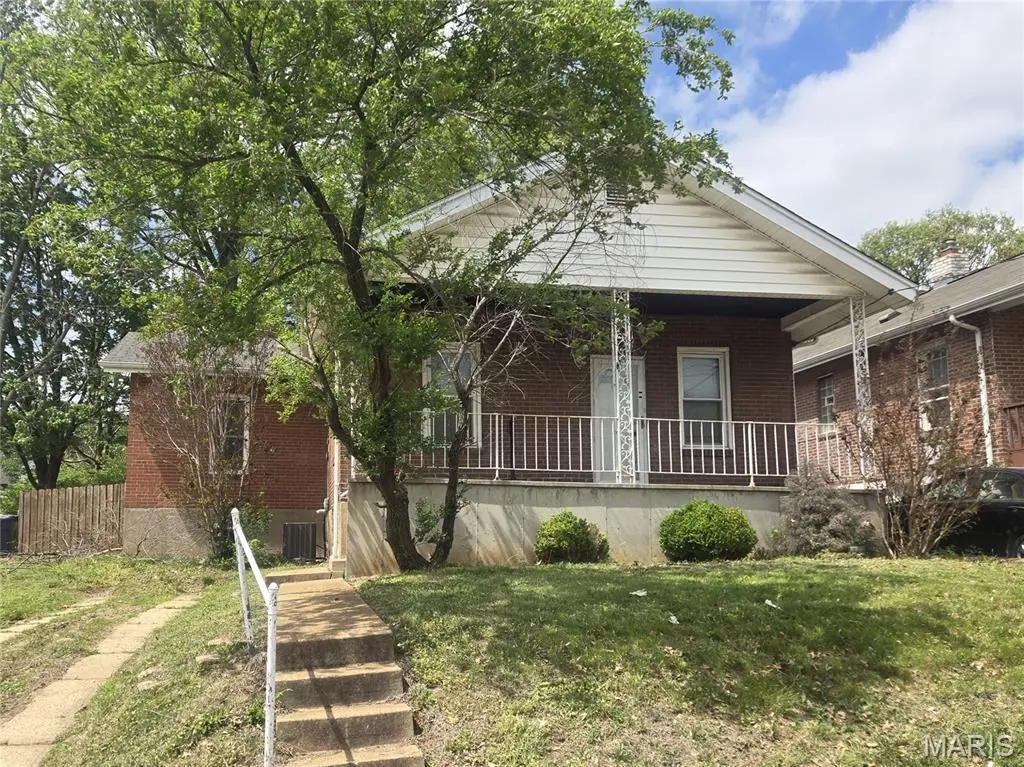
1371 Louisville Ave · St. Louis, MO
Flood risk 1/10 · Minimal
- FEMA flood zone
- X (unshaded)
- Chance of flooding over 30 yrs
- 0.0%
- Est. flood insurance / yr
- $473 – $860
Fire risk 1/10 · Minimal
- Est. fire insurance / yr
- $1,054 – $1,958
Heat risk 5/10 · Moderate
- Hot days now (above 107°F)
- 7 days/yr
- Hot days in 30 yrs
- 21 days/yr
Wind risk 2/10 · Minimal
- Chance of severe wind over 30 yrs
- 1.0%
Air-quality risk 3/10 · Minor
- Unhealthy air days now
- 3 days/yr
- Unhealthy air days in 30 yrs
- 4 days/yr
Risk factors via First Street. Map © Google.
Why this score? — see what drove the C+ grade
The composite is a weighted blend of 9 inputs, each scored 0–100. Each bar is that input's sub-score; the figure is the points it added to the 100-point composite (weight × sub-score).
- Cash flow +24.6/30.0
- ARV discount +15.0/15.0
- DSCR +8.0/10.0
- 1% rule +6.1/10.0
- Rent growth +3.8/5.0
- Livability +2.5/5.0
- Condition / age +2.5/5.0
- Schools +1.2/10.0
- Appreciation +0.0/10.0
$149,900
🖨 Deal sheet 📄 Offer letter ✓ Due diligence
Listing remarks MLS
Nice 3 bedroom brick home. HUD Aquired Property. Property Being sold ' AS IS '. All utilities are turned OFF. Please use discretion When showing and bring a flashlight.
Key facts
- Off street parking
- Full basement
- Corner lot
Tags
Neighborhood map
What this means for you Summary
Snapshot
- This is a 3-bed/1.0-bath single-family listed at $150k.
Deal economics
- At list price, monthly cash flow is $311 ($4k/yr) — positive.
- The deal already cash-flows at list — no discount required.
- Meets the 1% rule at list price ($2k rent vs $150k).
- Cap rate 8.8% vs local median 5.0% in St. Louis — top-decile yield for the area; either an underpriced asset or a hidden risk that comps aren't pricing in. Stress-test before assuming the spread holds.
Location & tenants
- Location reads: area grade C — affects rentability + tenant quality, not the cash-flow math above.
- St. Louis City (urban): math 10% / reading 18% proficiency, ranked #312 of 324 in MO (top 96%) — low school quality limits family demand, transient renter base, plan for 1-2y turnover; 80% free/reduced lunch — lower-income household profile, screen leases tightly.
- Zoned schools: Mason Elem. (math 22% / reading 37%, grade F, #813 of 1,115 statewide, top 75%, 389 students, 99% FRL); Roosevelt High (math 2% / reading 8%, grade F, #517 of 521 statewide, top 100%, 460 students, 99% FRL) — zoned schools average 99% FRL vs 80% district-wide (19 pts higher); higher-poverty schools than district average — tighter screening recommended.
- Market conditions: Rents rising fast (+5.4%/yr); 137 active listings in the ZIP; 32 comparable units currently listed for rent nearby; rentals at typical pace (median 24d on market — plan ~3-4 weeks tenant-placement turnaround); 47% of comp listings sitting > 30 days — soft ceiling on asking rent; solid renter incomes; 294 units permitted in St. Louis city in 2024 (227 in 5+ unit buildings).
Forward outlook
- Local home prices are declining (-3.0%/yr); year-one equity from $1k of loan paydown is wiped out by about $4k of value loss. Plan a longer hold.
- St. Louis County population projected to shrink 6% by 2050 — rents likely to lag national; underwrite the cash flow, not the appreciation.
- At projected returns (-3.0% appreciation + 5.4% rent growth), your $42k cash investment doubles in ~9 years — after that, you're playing with house money.
Negotiation context
- Only 4 days on market — expect competitive offers; lowballing is unlikely to land.
- 2 sale attempts since 14y ago with the ask held roughly flat each time — persistent listings suggest the price (not the market) is what's stuck; bring a comps-based counter.
- Current owner paid $130k; 15% above their basis — modest negotiation headroom, anchor on the comps not their cost.
Risks & watch-outs
- Watch-outs: built in 1924 — expect roof / HVAC / electrical / plumbing capex.
- Climate carrying-cost: extreme-heat days projected 7→21/yr by 2055 (HVAC capex compounding) — expect insurance premiums to compound above CPI over the hold.
Questions for the listing agent
- Built in 1924 — when were the roof, HVAC, electrical panel, plumbing, and water heater last replaced?
- Is there a deadline driving the sale (1031 exchange, divorce, estate, relocation)? That informs how much negotiation room exists.
- What's the average days-on-market for RENTAL listings here right now (not sales)? A rising rental-DOM trend means longer vacancies and softer asking-rent achievability than the comps imply.
- What's the recent tenant-quality profile in this submarket — average credit score on applications, eviction rate, late-payment / NSF rate, and stable-employment percentage? A property-management company in the area should have these aggregated.
- How much new for-sale + rental construction is in the pipeline within 1–3 miles? Heavy new supply typically softens prices + rents 12–24 months out; constrained supply supports both.
Investment metrics
- 1% rule
- 1.11% ✓
- Cap rate
- 8.78%
- Cash-on-cash
- 8.89%
- DSCR
- 1.40
- GRM
- 7.5
CMA / ARV
- ARV (on-the-fly)
- $205,359
- Comps found
- 12
Show comp detail 12 sales within ~0.75 mi
| Address | Dist | Beds/Ba | Sqft | Sold | Price | $/sf | Match |
|---|---|---|---|---|---|---|---|
| 1371 Louisville Ave | 0.00mi | 3/1.0 | 889 (0%) | 1mo | $149,900 | $169 | 99 |
| 1234 Louisville Ave | 0.15mi | 3/1.0 | 950 (+7%) | 2mo | $200,000 | $211 | 80 |
| 6462 Villa Ave | 0.16mi | 2/1.5 (-1) | 936 (+5%) | 2mo | $225,000 | $240 | 75 |
| 1122 Grandview Pl | 0.37mi | 3/1.5 | 864 (-3%) | 2mo | $199,900 | $231 | 74 |
| 1338 Fairmount Ct | 0.10mi | 2/1.0 (-1) | 792 (-11%) | 1mo | $179,000 | $226 | 72 |
| 1334 Fairmount Ct | 0.10mi | 3/2.0 | 1,012 (+14%) | 0mo | $100,000 | $99 | 68 |
| 6136 Victoria Ave | 0.53mi | 2/1.0 (-1) | 864 (-3%) | 2mo | $249,000 | $288 | 64 |
| 6758 Wise Ave | 0.33mi | 3/2.0 | 981 (+10%) | 3mo | $225,000 | $229 | 61 |
| 6554 Mitchell Ter | 0.33mi | 2/1.0 (-1) | 768 (-14%) | 1mo | $194,900 | $254 | 56 |
| 5927 W Park Ave | 0.66mi | 2/1.0 (-1) | 923 (+4%) | 2mo | $215,000 | $233 | 56 |
| 1523 Graham | 0.41mi | 2/1.0 (-1) | 779 (-12%) | 0mo | $199,900 | $257 | 55 |
| 1347 Graham St | 0.37mi | 2/1.5 (-1) | 1,000 (+12%) | 1mo | $182,500 | $183 | 54 |
Match score weights: distance 35% · size 25% · config 20% · recency 20%. Top-matched comps best support the ARV.
Projected returns pro-forma
-3.0% appreciation · 5.39% rent growth · sell at horizon
- IRR
- -0.2%
- Equity multiple
- 0.99×
- Total profit
- $-406
- Equity at exit
- $22,351
- IRR
- 11.7%
- Equity multiple
- 2.02×
- Total profit
- $42,760
- Equity at exit
- $12,961
Cash invested: $41,972 (down + closing). Projections, not guarantees.
Landlord ↔ Tenant lean methodology
- Overall (STATE)
- 81 Strongly Landlord-Friendly
- State Missouri
- 81 Strongly Landlord-Friendly · R+10
- County
- — inherits STATE
- City
- — inherits STATE
ZIP-level market 63139
- Rents YoY
- 5.4%
- Active inventory
- 137
- Price-to-rent
- 7.5×
Monthly cashflow live
- Estimated rent
- $1,660 high interval (Pro) →
- Mortgage (P&I)
- −$786
- Tax from tax record
- −$152 /mo · $1,825/yr
- Insurance
- −$62
- HOA
- −$0
- Vacancy / Maint / Mgmt
- −$349
- Net cashflow
- $311
Break-even live
UW: 25.0% down · 7.5% · 30yr · 1.5% tax · 5.0% vac · 8.0% maint · 8.0% mgmt
Financing live
Cash to close
- Down payment
- $37,475
- Closing costs
- $4,497
- Reserves months
- —
- Total cash needed
- —
Loan-product check · same deal, 3 products live
Conventional
25% down · 7.5% · 30yr
- Down + closing
- —
- Monthly P&I
- —
- Monthly cashflow
- —
- DSCR
- —
- Eligible?
- —
Personal DTI + credit; lowest rate.
DSCR
20% down · 8.5% · 30yr
- Down + closing
- —
- Monthly P&I
- —
- Monthly cashflow
- —
- DSCR
- —
- Eligible?
- —
No personal income docs; deal must DSCR.
Hard money
10% down · 12.0% · 12mo
- Down + closing
- —
- Monthly P&I
- —
- Monthly cashflow
- —
- DSCR
- —
- Eligible?
- —
Short-term bridge; refi at stabilization.
Rent comps 32 comps
| Address | Beds | Baths | Sqft | Rent | $/sqft | DOM | Units | Dist |
|---|---|---|---|---|---|---|---|---|
| 6620 Wise Ave Unit 6620 St. Louis, MO | 2.0 | 2.0 | 664 | $2,400 | $3.61 | 43d | 1 | 0.21mi |
| 6605 Clayton Ave Saint Louis, MO | 1.0–2.0 | 1.0–2.0 | 860 | $1,723 | $2.00 | 2d | 8 | 0.27mi |
| 6723 Glades Ave Saint Louis, MO | 3.0 | 1.0 | 980 | $1,750 | $1.79 | 7d | 1 | 0.41mi |
| 6320 Berthold Ave Unit 1st Flr St. Louis, MO | 2.0 | 1.0 | 750 | $1,400 | $1.87 | 23d | 1 | 0.42mi |
| 6226-6238 Oakland Ave St. Louis, MO | 1.0–2.0 | 1.0 | 571 | $1,125 | $1.97 | 2d | 3 | 0.52mi |
| 7018 Plateau Ave Saint Louis, MO | 2.0 | 2.0 | 1040 | $1,995 | $1.92 | 1d | 1 | 0.59mi |
| 7027 Plateau Ave Saint Louis, MO | 2.0 | 1.0 | 816 | $1,750 | $2.14 | 43d | 1 | 0.60mi |
| 2533 Tamm Ave Saint Louis, MO | 2.0 | 1.0 | 720 | $1,550 | $2.15 | 4d | 1 | 0.78mi |
| 2050 Yale Ave Maplewood, MO | 2.0 | 1.0 | 700 | $1,150 | $1.64 | 23d | 1 | 0.81mi |
| 6238 Southwood Ave Unit 3S St. Louis, MO | 2.0 | 2.0 | 1100 | $1,595 | $1.45 | 43d | 1 | 0.81mi |
| 5700 Highlands Plaza Dr Saint Louis, MO | 3.0 | 1.0–2.0 | 1029 | $4,100 | $3.98 | 2d | 24 | 0.84mi |
| 665 S Skinker Blvd Saint Louis, MO | 3.0 | 1.0–2.0 | 1080 | $3,500 | $3.24 | 16d | 40 | 0.87mi |
| 665 S Skinker Blvd Saint Louis, MO | 3.0 | 1.0–2.0 | 1080 | $3,045 | $2.82 | 1d | 43 | 0.87mi |
| 6300 N Rosebury Ave Saint Louis, MO | 2.0 | 1.0 | 930 | $1,595 | $1.72 | 43d | 1 | 0.90mi |
| 6300 N Rosebury Ave Unit 1N Clayton, MO | 2.0 | 1.0 | 930 | $1,600 | $1.72 | 43d | 1 | 0.90mi |
| 6302 N Rosebury Ave Unit 1W Clayton, MO | 2.0 | 1.0 | 870 | $1,200 | $1.38 | 43d | 1 | 0.91mi |
| 6301 N Rosebury Ave Unit 3W Clayton, MO | 2.0 | 1.0 | 870 | $1,595 | $1.83 | 43d | 1 | 0.92mi |
| 6323 S Rosebury Ave Unit 2E Clayton, MO | 2.0 | 2.0 | 1100 | $1,995 | $1.81 | 17d | 1 | 0.94mi |
| 2262 Yale Ave Saint Louis, MO | 2.0 | 1.0 | 900 | $2,700 | $3.00 | 14d | 1 | 1.03mi |
| 6225 Marmaduke Ave Saint Louis, MO | 3.0 | 2.0 | 1008 | $2,179 | $2.16 | 4d | 1 | 1.10mi |
| 7208 Zephyr Pl Apt 1E Maplewood, MO | 2.0 | 1.0 | 1100 | $1,199 | $1.09 | 43d | 1 | 1.11mi |
| 2507 Bellevue Ave Unit 2507 1 Maplewood, MO | 2.0 | 1.0 | 800 | $1,245 | $1.56 | 43d | 1 | 1.11mi |
| 6048 Southwest Ave St. Louis, MO | 2.0 | 1.0 | 770 | $1,200 | $1.56 | 43d | 1 | 1.11mi |
| 7473 Wise Ave Saint Louis, MO | 2.0 | 1.0 | 917 | $1,295 | $1.41 | 43d | 1 | 1.14mi |
| 7210 Lyndover Pl Unit 3E Maplewood, MO | 2.0 | 1.0 | 800 | $1,250 | $1.56 | 7d | 1 | 1.16mi |
| 2624 Roseland Ter Saint Louis, MO | 2.0 | 1.0 | 750 | $1,045 | $1.39 | 2d | 2 | 1.24mi |
| 6228 Arsenal St Unit 1F St. Louis, MO | 2.0 | 1.0 | 1050 | $1,250 | $1.19 | 43d | 1 | 1.30mi |
| 1421 Claytonia Ter Unit 1F Richmond Heights, MO | 2.0 | 1.0 | 855 | $1,125 | $1.32 | 10d | 1 | 1.39mi |
| 7135 Canterbury Ave Saint Louis, MO | 1.0–2.0 | 1.0–1.5 | 1016 | $2,155 | $2.12 | 19d | 4 | 1.41mi |
| 1146 Moorlands Dr Richmond Heights, MO | 2.0 | 1.0 | 1075 | $1,500 | $1.40 | 43d | 1 | 1.43mi |
| 7560 Alicia Ave Saint Louis, MO | 2.0 | 1.0 | 960 | $1,650 | $1.72 | 43d | 1 | 1.44mi |
| 5252 Bischoff Ave St. Louis, MO | 2.0 | 1.0 | 750 | $1,225 | $1.63 | 43d | 1 | 1.46mi |
Listing history 6 events
-
2026-04-28status Pending
-
2026-04-24$149,900 Active
-
2013-01-04soldstatus 174-char remark
Show marketing remark (174 chars)
Nice 3 bedroom brick home. HUD Aquired Property. Property Being sold ' AS IS '. All utilities are turned OFF. Please use discretion When showing and bring a flashlight.
-
2012-11-01$42,000 174-char remark
Show marketing remark (174 chars)
Nice 3 bedroom brick home. HUD Aquired Property. Property Being sold ' AS IS '. All utilities are turned OFF. Please use discretion When showing and bring a flashlight.
-
2006-03-16soldstatus $130,000
-
1998-08-19soldstatus $51,400
ⓘ Source: listings_history table (triggers on properties + properties_extension) + one-shot
backfill from property_details.listing_events for pre-trigger history.
Tax reassessment forecast MO · Resets to sale price
- Current annual tax
- $1,825 · $152/mo
- Projected year-2 tax
- $1,825 · $152/mo
- Expected delta
- $0/yr ($0/mo · 0.0%)
ⓘ Screening estimate from a state-policy table — verify with the county assessor before closing.
Climate risk First Street
- Flood 1/10 Low FEMA zone X (unshaded) · 0% chance over 30 yrs
- Wildfire 1/10 Low
- Heat 5/10 Major 7 d/yr ≥107°F today · 21 d/yr by 30 yrs out
- Wind 2/10 Low 100% chance of damaging wind over 30 yrs
- Air quality 3/10 Moderate 3 unhealthy d/yr today · 4 by 30 yrs out
Nearby sold comps map
Loading sold comps map…
Walkable amenities ~0.75 mi
Loading nearby amenities…
Taxation est. · year 1
- Rental income
- $19,920
- − Mortgage interest
- −$8,397
- − Property taxes
- −$1,825
- − Insurance
- −$750
- − Repairs & maintenance
- −$1,594
- − Management
- −$1,594
- − Depreciation
- −$4,361
- Taxable income
- $1,401
- Est. tax owed @ 24.0%
- −$336
- After-tax cash flow
- $3,393/yr
For passive investors: Depreciation is non-cash, so a rental often shows a tax loss while cash-flowing — sheltering income. Rental losses are passive: they offset passive income freely, and up to $25,000/yr can offset ordinary (W-2) income if you actively participate and your MAGI is under $100k (phasing out to $0 by $150k); unused losses carry forward. On sale, claimed depreciation is recaptured at up to 25%, and gains may owe capital-gains tax (a 1031 exchange can defer both). Figures are a year-1 estimate at your 24.0% rate — not tax advice; consult a CPA.
Schools (NCES district)
- District
- St. Louis City
- NCES district ID
- 2929280
- Math proficiency
- 10% ▼ -6.00%
- Reading proficiency
- 18% ▼ -3.00%
- Median HH income
- $35,685
- Composite
- 11.54/100
- National rank
- #9699
- State rank
- #312 of 324 in MO
Livability — St. Louis
No livability data for this city. (Only ~50 U.S. cities are tracked.)
Census & demographics
- Census place
- St. Louis, MO
- County
- Saint Louis City · 254,015 people
- City population
- 283,259
- Metro
- St. Louis, MO-IL
- Population (ZIP)
- 21,631
- Household income
- $75,757
- Rent vs Own
- Severe rent burden
- 653.0
Population outlook (St. Louis County) Hauer SSP2
- Today (2025)
- 315,737 people
- By 2030
- 313,865 · -0.6%
- By 2040
- 305,439 · -3.3%
- By 2050
- 296,529 · -6.1%
- By 2075
- 271,028 · -14.2%
- By 2100
- 255,359 · -19.1%
Race, ethnicity, and origin ACS 2023
- Neighborhood character
- Predominantly White (70%)
- Race & ethnicity
- White 70% Black 16% Two or more races 7% Hispanic / Latino 5% Asian 3%
- Hispanic origin (detail)
- Mexican 3%
- Common ancestry
- Lithuanian 4% Slovak 2% Romanian 2%
- Foreign-born
- 5% · Canada, China
- Languages at home
- 93% English-only · Spanish 2% Other Indo-European 1% German/W. Germanic 1%
Political lean MEDSL · St. Louis
- 2024 margin
- Solid D (+64.7) · D 81.4% · R 16.7% · Other 2.0%
- 2008→2024 swing
- -3.5pp toward R · 2008: 68.2pp · 2024: 64.7pp
- All cycles
- 2024: D+64.7 2020: D+66.2 2016: D+63.7 2012: D+66.6 2008: D+68.2
Not yet ingested
- Civics
- —
Market trends
- HPI YoY
- ▼ -277.54%
- Current HPI
- 256.7513
- Rent YoY
- ▲ 5.39%
- Metro
- St. Louis, MO-IL
- State GDP YoY
- ▲ 1.84%
- F500 in state
- 20
Industry mix (Fortune 500 HQ in MO)
| Industry | F500 HQs | Revenue |
|---|---|---|
| Healthcare | 1 | $163B |
|
||
| Insurance | 1 | $21B |
|
||
| Industrial Technology | 1 | $17B |
|
||
| Retail | 1 | $16B |
|
||
| Industrial Distribution | 1 | $10B |
|
||
| Utilities | 1 | $9B |
|
||
Price history
+191.6% since first listed6 events — show timeline
- 2026-04-28 Pending — MARIS as Distributed by MLS Grid
- 2026-04-24 Listed $149,900 MARIS as Distributed by MLS Grid
- 2013-01-04 Sold (MLS) — MARIS as Distributed by MLS Grid
- 2012-11-01 Listed $42,000 MARIS as Distributed by MLS Grid
- 2006-03-16 Sold (Public Records) $130,000 Public Records
- 1998-08-19 Sold (Public Records) $51,400 Public Records
Property tax history
+4.8%/yrLatest (2022): $1,825 · +0.1% YoY. Source: county tax records.
Cash-flow waterfall
monthlySold comps — $/sqft
last 12 mo · ≤1 miLoading sold comps…