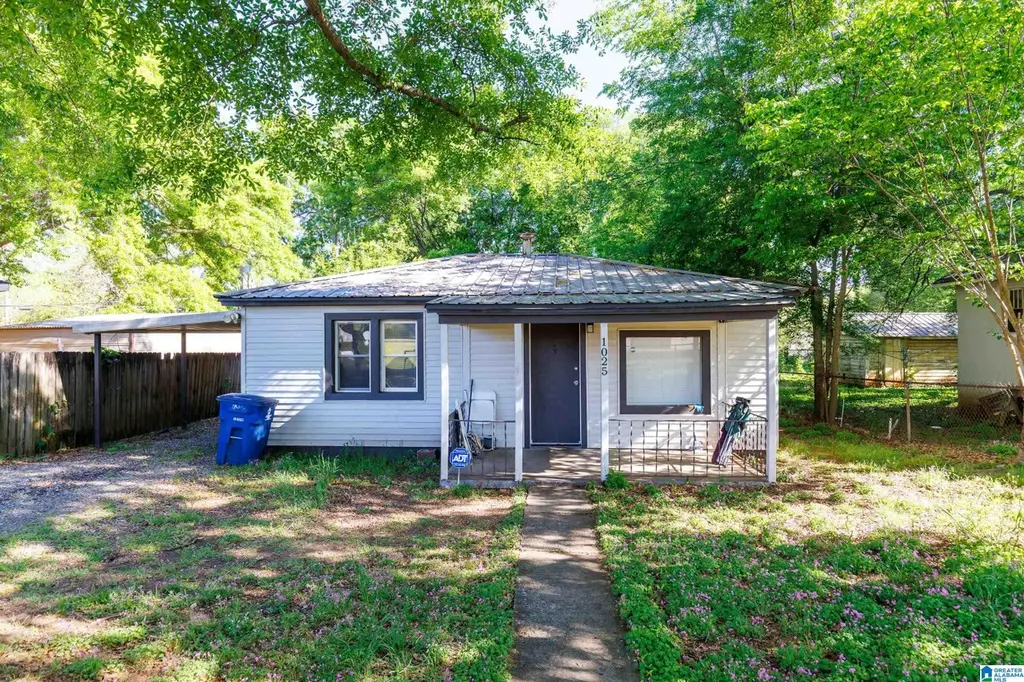
1025 Cherry St · Midfield, AL
Flood risk 1/10 · Minimal
- FEMA flood zone
- X (unshaded)
- Chance of flooding over 30 yrs
- 0.0%
- Est. flood insurance / yr
- $507 – $1,088
Fire risk 3/10 · Minor
- Est. fire insurance / yr
- $916 – $1,700
Heat risk 7/10 · Major
- Hot days now (above 108°F)
- 7 days/yr
- Hot days in 30 yrs
- 20 days/yr
Wind risk 6/10 · Moderate
- Chance of severe wind over 30 yrs
- 27.0%
Air-quality risk 3/10 · Minor
- Unhealthy air days now
- 2 days/yr
- Unhealthy air days in 30 yrs
- 5 days/yr
Risk factors via First Street. Map © Google.
Why this score? — see what drove the C grade
The composite is a weighted blend of 9 inputs, each scored 0–100. Each bar is that input's sub-score; the figure is the points it added to the 100-point composite (weight × sub-score).
- Cash flow +25.5/30.0
- DSCR +8.5/10.0
- ARV discount +7.5/15.0
- 1% rule +6.0/10.0
- Livability +3.2/5.0
- Appreciation +2.6/10.0
- Condition / age +2.5/5.0
- Rent growth +2.1/5.0
- Schools +0.7/10.0
$90,000
🖨 Deal sheet 📄 Offer letter ✓ Due diligence
Listing remarks MLS
Turnkey investment opportunity with tenant in place! This 3-bedroom home is already producing income at $995/month, offering immediate cash flow from day one. Features include a durable metal roof for long-term, low-maintenance ownership. The property is professionally managed and currently leased through February 2027, making it an ideal addition to any investor’s portfolio seeking stability and reduced vacancy risk. Located in an established rental area of Midfield with consistent demand, this property requires no upfront work—just collect rent. Whether you’re a new investor or expanding your portfolio, this is a solid, income-producing asset. Showings limited due to tenant occupancy.
Key facts
- Metal roof
- 7,405 sq ft lot
- Built 1958
Tags
Neighborhood map
What this means for you Summary
Snapshot
- This is a 2-bed/1.0-bath single-family listed at $90k.
Deal economics
- At list price, monthly cash flow is $210 ($3k/yr) — positive.
- The deal already cash-flows at list — no discount required.
- Meets the 1% rule at list price ($990 rent vs $90k).
- Recommended offer: $85k (6.0% below list) — sets the bar for market timing.
Location & tenants
- Location reads 64/100 on livability (#164 in AL) — a middle-class / working-renter tenant base. Strengths: commute A+, cost of living A+, housing A+; Watch: schools F, amenities F, employment F.
- Midfield City (suburban): math 2% / reading 14% proficiency, ranked #126 of 129 in AL (top 98%) — low school quality limits family demand, transient renter base, plan for 1-2y turnover; 83% free/reduced lunch — lower-income household profile, screen leases tightly.
- Market conditions: Rents soft (-1.5%/yr); 87 active listings in the ZIP; 21 comparable units currently listed for rent nearby; rentals at typical pace (median 16d on market — plan ~3-4 weeks tenant-placement turnaround); 2,114 units permitted in Jefferson County in 2024 (556 in 5+ unit buildings).
Forward outlook
- Local home prices are declining (-3.0%/yr); year-one equity from $622 of loan paydown is wiped out by about $3k of value loss. Plan a longer hold.
- Jefferson County population projected to shrink 4% by 2050 — rents likely to lag national; underwrite the cash flow, not the appreciation.
Negotiation context
- It's been on market 62 days — a 6% lower offer ($85k) is reasonable based on typical stale-listing flexibility.
- 3 sale attempts since 6y ago with the ask held roughly flat each time — persistent listings suggest the price (not the market) is what's stuck; bring a comps-based counter.
- Current owner paid $30k; list at $90k implies a 200% gain — meaningful room to come down on a strong offer.
Risks & watch-outs
- Watch-outs: built in 1958 — expect roof / HVAC / electrical / plumbing capex.
- Climate carrying-cost: major wind risk, 27% chance of damaging wind over 30y; extreme-heat days projected 7→20/yr by 2055 (HVAC capex compounding) — expect insurance premiums to compound above CPI over the hold.
Questions for the listing agent
- It's been on market 62 days. Have you received any prior offers? Is the seller open to a 6% concession, seller financing, or rate buy-down credit?
- Built in 1958 — when were the roof, HVAC, electrical panel, plumbing, and water heater last replaced?
- Why hasn't it sold? Are there any deal-killer items the seller is aware of (foundation, flood, title, zoning, code violations)?
- Is there a deadline driving the sale (1031 exchange, divorce, estate, relocation)? That informs how much negotiation room exists.
- Schools are F-rated, which usually means shorter tenancies and higher turnover. Who's the typical renter profile here, and what's been the actual vacancy rate?
- What's the average days-on-market for RENTAL listings here right now (not sales)? A rising rental-DOM trend means longer vacancies and softer asking-rent achievability than the comps imply.
- What's the recent tenant-quality profile in this submarket — average credit score on applications, eviction rate, late-payment / NSF rate, and stable-employment percentage? A property-management company in the area should have these aggregated.
- How much new for-sale + rental construction is in the pipeline within 1–3 miles? Heavy new supply typically softens prices + rents 12–24 months out; constrained supply supports both.
Investment metrics
- 1% rule
- 1.10% ✓
- Cap rate
- 9.09%
- Cash-on-cash
- 10.00%
- DSCR
- 1.45
- GRM
- 7.6
CMA / ARV
- ARV (median comp)
- $48,780
- List price
- $90,000
- Delta
- 84.50%
- Verdict
- OVERPRICED
- Comps
- 20 within 1.0 mi
Show comp detail 7 sales within ~0.75 mi
| Address | Dist | Beds/Ba | Sqft | Sold | Price | $/sf | Match |
|---|---|---|---|---|---|---|---|
| 1013 Herring St | 0.08mi | 2/1.0 | 808 (-3%) | 3mo | $77,500 | $96 | 88 |
| 16 Wilkes Cir | 0.15mi | 2/1.0 | 720 (-14%) | 13mo | $11,500 | $16 | 59 |
| 207 4th Ave | 0.41mi | 2/1.0 | 768 (-8%) | 22mo | $25,000 | $33 | 49 |
| 602 8th Ave | 0.75mi | 2/1.0 | 750 (-10%) | 0mo | $18,000 | $24 | 48 |
| 1521 Watts St | 0.72mi | 3/1.0 (+1) | 903 (+8%) | 2mo | $10,000 | $11 | 47 |
| 440 Oakmont St | 0.66mi | 3/1.0 (+1) | 960 (+15%) | 3mo | $53,000 | $55 | 37 |
| 1209 8th St | 0.72mi | 3/1.0 (+1) | 912 (+9%) | 15mo | $52,000 | $57 | 34 |
Match score weights: distance 35% · size 25% · config 20% · recency 20%. Top-matched comps best support the ARV.
Projected returns pro-forma
-3.0% appreciation · 0.0% rent growth · sell at horizon
- IRR
- -4.5%
- Equity multiple
- 0.84×
- Total profit
- $-4,121
- Equity at exit
- $13,419
- IRR
- 1.5%
- Equity multiple
- 1.09×
- Total profit
- $2,362
- Equity at exit
- $7,782
Cash invested: $25,200 (down + closing). Projections, not guarantees.
Landlord ↔ Tenant lean methodology
- Overall (STATE)
- 90 Strongly Landlord-Friendly
- State Alabama
- 90 Strongly Landlord-Friendly · R+15
- County
- — inherits STATE
- City
- — inherits STATE
ZIP-level market 35228
- Home prices YoY
- -3.5%
- Rents YoY
- -1.5%
- Active inventory
- 87
- Price-to-rent
- 7.6×
Monthly cashflow live
- Estimated rent
- $990 high interval (Pro) →
- Mortgage (P&I)
- −$472
- Tax from tax record
- −$63 /mo · $754/yr
- Insurance
- −$38
- HOA
- −$0
- Vacancy / Maint / Mgmt
- −$208
- Net cashflow
- $210
Break-even live
UW: 25.0% down · 7.5% · 30yr · 1.5% tax · 5.0% vac · 8.0% maint · 8.0% mgmt
Financing live
Cash to close
- Down payment
- $22,500
- Closing costs
- $2,700
- Reserves months
- —
- Total cash needed
- —
Loan-product check · same deal, 3 products live
Conventional
25% down · 7.5% · 30yr
- Down + closing
- —
- Monthly P&I
- —
- Monthly cashflow
- —
- DSCR
- —
- Eligible?
- —
Personal DTI + credit; lowest rate.
DSCR
20% down · 8.5% · 30yr
- Down + closing
- —
- Monthly P&I
- —
- Monthly cashflow
- —
- DSCR
- —
- Eligible?
- —
No personal income docs; deal must DSCR.
Hard money
10% down · 12.0% · 12mo
- Down + closing
- —
- Monthly P&I
- —
- Monthly cashflow
- —
- DSCR
- —
- Eligible?
- —
Short-term bridge; refi at stabilization.
Rent comps 21 comps
| Address | Beds | Baths | Sqft | Rent | $/sqft | DOM | Units | Dist |
|---|---|---|---|---|---|---|---|---|
| 36 Wilkes Cir Birmingham, AL | 2.0 | 1.0 | 762 | $875 | $1.15 | 44d | 1 | 0.14mi |
| 925 Woodward Rd Birmingham, AL | 2.0 | 2.0 | 1104 | $950 | $0.86 | 44d | 1 | 0.45mi |
| 605 10th Ave Birmingham, AL | 3.0 | 1.0 | 1060 | $850 | $0.80 | 44d | 1 | 0.72mi |
| 412 Fairfax Dr Unit 400-1 Fairfield, AL | 2.0 | 1.5 | 935 | $1,175 | $1.26 | 3d | 1 | 0.94mi |
| 412 Fairfax Dr Unit 424-10 Fairfield, AL | 3.0 | 1.5 | 1035 | $1,275 | $1.23 | 12d | 1 | 0.94mi |
| 412 Fairfax Dr Unit 400-12 Fairfield, AL | 2.0 | 1.0 | 888 | $915 | $1.03 | 10d | 1 | 0.94mi |
| 412 Fairfax Dr Unit 424-3 Fairfield, AL | 3.0 | 1.5 | 1035 | $1,200 | $1.16 | 10d | 1 | 0.94mi |
| 412 Fairfax Dr Unit 436-11 Fairfield, AL | 2.0 | 1.5 | 935 | $910 | $0.97 | 10d | 1 | 0.94mi |
| 412 Fairfax Dr Unit 436-10 Fairfield, AL | 2.0 | 1.0 | 888 | $890 | $1.00 | 10d | 1 | 0.94mi |
| 412 Fairfax Dr Unit 432-13 Fairfield, AL | 1.0 | 1.0 | 555 | $775 | $1.40 | 10d | 1 | 0.94mi |
| 412 Fairfax Dr Unit 444-12 Fairfield, AL | 2.0 | 1.0 | 888 | $910 | $1.02 | 10d | 1 | 0.94mi |
| 412 Fairfax Dr Unit 416-11 Fairfield, AL | 2.0 | 1.5 | 935 | $975 | $1.04 | 3d | 1 | 0.94mi |
| 407 Fairfax Dr Fairfield, AL | 1.0 | 1.5 | 850 | $1,160 | $1.36 | 44d | 2 | 1.01mi |
| 6001 Ivy St Birmingham, AL | 3.0 | 1.0 | 906 | $950 | $1.05 | 44d | 1 | 1.08mi |
| 520 Brewer Dr Bessemer, AL | 3.0 | 1.0 | 1040 | $1,100 | $1.06 | 3d | 1 | 1.10mi |
| 517 Grant St Birmingham, AL | 3.0 | 1.0 | 912 | $850 | $0.93 | 23d | 1 | 1.11mi |
| 1721 Collier Dr Birmingham, AL | 2.0 | 1.0 | 925 | $800 | $0.86 | 44d | 1 | 1.14mi |
| 5704 14th St S Bessemer, AL | 2.0 | 2.0 | 1024 | $850 | $0.83 | 16d | 1 | 1.23mi |
| 546 Selma Rd Bessemer, AL | 3.0 | 1.0 | 888 | $900 | $1.01 | 44d | 1 | 1.29mi |
| 5709 13th St S Bessemer, AL | 3.0 | 1.0 | 1120 | $1,200 | $1.07 | 44d | 1 | 1.34mi |
| 4506 Letson St Brighton, AL | 3.0 | 2.0 | 1032 | $1,200 | $1.16 | 23d | 1 | 1.36mi |
Listing history 29 events
-
2026-06-18days on market $90,000 Active 62 DOM
-
2026-06-17days on market $90,000 Active 61 DOM
-
2026-06-16days on market $90,000 Active 60 DOM
-
2026-06-15days on market $90,000 Active 59 DOM
-
2026-06-13days on market $90,000 Active 57 DOM
-
2026-06-13days on market $90,000 Active 56 DOM
-
2026-06-10days on market $90,000 Active 54 DOM
-
2026-06-09days on market $90,000 Active 53 DOM
-
2026-06-08days on market $90,000 Active 52 DOM
-
2026-06-07days on market $90,000 Active 51 DOM
-
2026-06-05days on market $90,000 Active 48 DOM
-
2026-06-03days on market $90,000 Active 47 DOM
-
2026-06-02days on market $90,000 Active 46 DOM
-
2026-06-01days on market $90,000 Active 45 DOM
-
2026-05-31days on market $90,000 Active 44 DOM
-
2026-04-17$90,000 Active 713-char remark
Show marketing remark (713 chars)
Turnkey investment opportunity with tenant in place! This 3-bedroom home is already producing income at $995/month, offering immediate cash flow from day one. Features include a durable metal roof for long-term, low-maintenance ownership. The property is professionally managed and currently leased through February 2027, making it an ideal addition to any investor’s portfolio seeking stability and reduced vacancy risk. Located in an established rental area of Midfield with consistent demand, this property requires no upfront work—just collect rent. Whether you’re a new investor or expanding your portfolio, this is a solid, income-producing asset. Showings limited due to tenant occupancy.
-
2025-02-27historical $995
-
2024-11-15price $995
-
2024-11-13price $1,045
-
2024-10-26price $1,095
-
2024-10-11price $1,100
-
2024-10-09price $1,125
-
2024-09-11price $1,150
-
2024-09-04$1,075
-
2022-06-10soldstatus $30,000
-
2020-09-11soldstatus $30,500 Sold 204-char remark
Show marketing remark (204 chars)
Affordable and convenient in Midfield . .. 2 bedroom 1 Bath. separate Living room & Dinning room Carport plus a Detached 2 car garage , , Covered Front & back porches Fully fenced yard . ..
-
2020-09-03status Pending 204-char remark
Show marketing remark (204 chars)
Affordable and convenient in Midfield . .. 2 bedroom 1 Bath. separate Living room & Dinning room Carport plus a Detached 2 car garage , , Covered Front & back porches Fully fenced yard . ..
-
2020-08-14price $39,000 204-char remark
Show marketing remark (204 chars)
Affordable and convenient in Midfield . .. 2 bedroom 1 Bath. separate Living room & Dinning room Carport plus a Detached 2 car garage , , Covered Front & back porches Fully fenced yard . ..
-
2020-07-03$44,000 Active 204-char remark
Show marketing remark (204 chars)
Affordable and convenient in Midfield . .. 2 bedroom 1 Bath. separate Living room & Dinning room Carport plus a Detached 2 car garage , , Covered Front & back porches Fully fenced yard . ..
ⓘ Source: listings_history table (triggers on properties + properties_extension) + one-shot
backfill from property_details.listing_events for pre-trigger history.
Tax reassessment forecast AL · Resets to sale price
- Current annual tax
- $754 · $63/mo
- Projected year-2 tax
- $754 · $63/mo
- Expected delta
- $0/yr ($0/mo · 0.0%)
ⓘ Screening estimate from a state-policy table — verify with the county assessor before closing.
Climate risk First Street
- Flood 1/10 Low FEMA zone X (unshaded) · 0% chance over 30 yrs
- Wildfire 3/10 Moderate
- Heat 7/10 Severe 7 d/yr ≥108°F today · 20 d/yr by 30 yrs out
- Wind 6/10 Major 27% chance of damaging wind over 30 yrs
- Air quality 3/10 Moderate 2 unhealthy d/yr today · 5 by 30 yrs out
Nearby sold comps map
Loading sold comps map…
Walkable amenities ~0.75 mi
Loading nearby amenities…
Taxation est. · year 1
- Rental income
- $11,885
- − Mortgage interest
- −$5,041
- − Property taxes
- −$754
- − Insurance
- −$450
- − Repairs & maintenance
- −$951
- − Management
- −$951
- − Depreciation
- −$2,618
- Taxable income
- $1,119
- Est. tax owed @ 24.0%
- −$269
- After-tax cash flow
- $2,252/yr
For passive investors: Depreciation is non-cash, so a rental often shows a tax loss while cash-flowing — sheltering income. Rental losses are passive: they offset passive income freely, and up to $25,000/yr can offset ordinary (W-2) income if you actively participate and your MAGI is under $100k (phasing out to $0 by $150k); unused losses carry forward. On sale, claimed depreciation is recaptured at up to 25%, and gains may owe capital-gains tax (a 1031 exchange can defer both). Figures are a year-1 estimate at your 24.0% rate — not tax advice; consult a CPA.
Schools (NCES district)
- District
- Midfield City
- NCES district ID
- 0102350
- Math proficiency
- 2% ▼ -18.00%
- Reading proficiency
- 14% ▼ -5.00%
- Median HH income
- $39,267
- Composite
- 6.89/100
- National rank
- #9978
- State rank
- #126 of 129 in AL
Livability — Midfield
- Score
- 64/100
- State rank
- #164
- US rank
- #14536
Category grades
Schools grade is shown separately in the Schools card above.
Census & demographics
- Census place
- Midfield, AL
- County
- Jefferson County · 527,445 people
- City population
- 10,216
- Metro
- Birmingham-Hoover, AL
- Population (ZIP)
- 10,216
- Household income
- $50,815
- Rent vs Own
- Severe rent burden
- 456.0
Population outlook (Jefferson County) Hauer SSP2
- Today (2025)
- 669,185 people
- By 2030
- 669,694 · +0.1%
- By 2040
- 661,388 · -1.2%
- By 2050
- 643,086 · -3.9%
- By 2075
- 577,267 · -13.7%
- By 2100
- 474,758 · -29.1%
Race, ethnicity, and origin ACS 2023
- Neighborhood character
- Predominantly Black (89%)
- Race & ethnicity
- Black 89% Hispanic / Latino 5% Two or more races 5% White 5%
- Foreign-born
- 2% · Canada
- Languages at home
- 95% English-only · Spanish 5%
Political lean MEDSL · Jefferson
- 2024 margin
- D (+10.4) · D 54.6% · R 44.2% · Other 1.2%
- 2008→2024 swing
- +5.4pp toward D · 2008: 5.1pp · 2024: 10.4pp
- All cycles
- 2024: D+10.4 2020: D+13.2 2016: D+7.2 2012: D+6.0 2008: D+5.1
Not yet ingested
- Civics
- —
Market trends
- HPI YoY
- ▼ -4.84%
- Current HPI
- 134.8633
- Rent YoY
- ▼ -1.47%
- Metro
- Birmingham-Hoover, AL
- State GDP YoY
- ▲ 2.94%
- F500 in state
- 4
Industry mix (Fortune 500 HQ in AL)
| Industry | F500 HQs | Revenue |
|---|---|---|
| Financial Services | 1 | $8B |
|
||
| Healthcare | 1 | $5B |
|
||
Price history
+104.5% since first listed14 events — show timeline
- 2026-04-17 Listed $90,000 Greater Alabama MLS
- 2025-02-27 Rental Removed $995 APPFOLIO
- 2024-11-15 Price Changed $995 APPFOLIO
- 2024-11-13 Price Changed $1,045 APPFOLIO
- 2024-10-26 Price Changed $1,095 APPFOLIO
- 2024-10-11 Price Changed $1,100 APPFOLIO
- 2024-10-09 Price Changed $1,125 APPFOLIO
- 2024-09-11 Price Changed $1,150 APPFOLIO
- 2024-09-04 Listed for Rent $1,075 APPFOLIO
- 2022-06-10 Sold (Public Records) $30,000 Public Records
- 2020-09-11 Sold (MLS) $30,500 Greater Alabama MLS
- 2020-09-03 Pending — Greater Alabama MLS
- 2020-08-14 Price Changed $39,000 Greater Alabama MLS
- 2020-07-03 Listed $44,000 Greater Alabama MLS
Property tax history
+2.1%/yrLatest (2025): $754 · +6.8% YoY. Source: county tax records.
Cash-flow waterfall
monthlySold comps — $/sqft
last 12 mo · ≤1 miLoading sold comps…