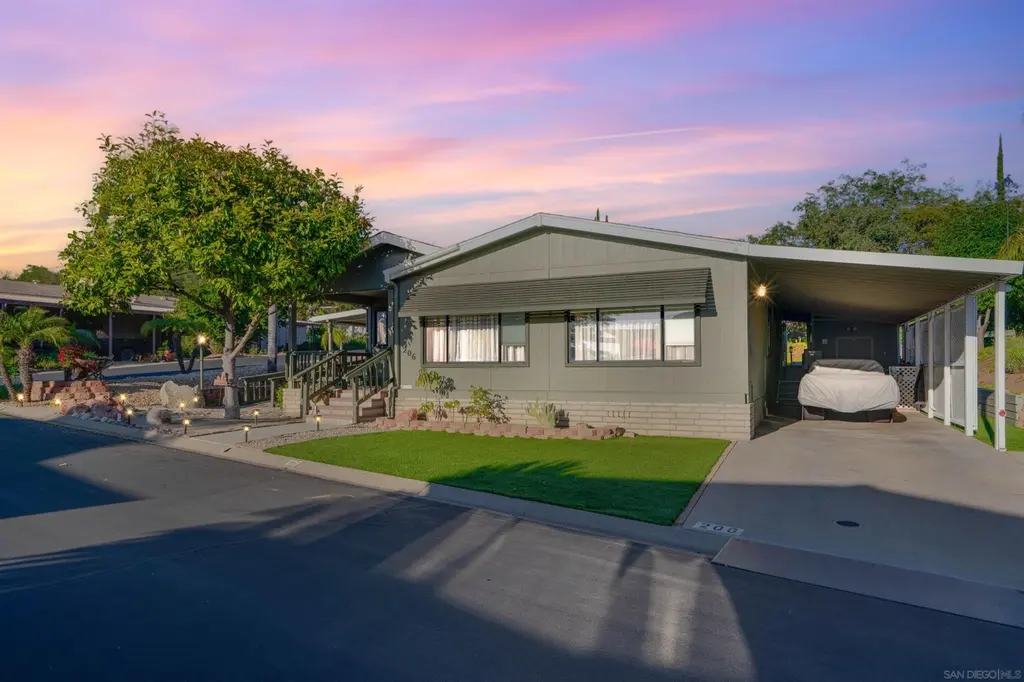
18218 Paradise Mountain Rd #206 · Valley Center, CA
Flood risk 1/10 · Minimal
- FEMA flood zone
- X (unshaded)
- Chance of flooding over 30 yrs
- 0.0%
- Est. flood insurance / yr
- $507 – $1,088
Fire risk 10/10 · Severe
- Est. fire insurance / yr
- $659 – $1,223
Heat risk 4/10 · Minor
- Hot days now (above 97°F)
- 1 days/yr
- Hot days in 30 yrs
- 3 days/yr
Wind risk 1/10 · Minimal
- Chance of severe wind over 30 yrs
- —
Air-quality risk 6/10 · Moderate
- Unhealthy air days now
- 10 days/yr
- Unhealthy air days in 30 yrs
- 12 days/yr
Risk factors via First Street. Map © Google.
Why this score? — see what drove the B+ grade
The composite is a weighted blend of 9 inputs, each scored 0–100. Each bar is that input's sub-score; the figure is the points it added to the 100-point composite (weight × sub-score).
- Cash flow +30.0/30.0
- ARV discount +15.0/15.0
- 1% rule +10.0/10.0
- DSCR +10.0/10.0
- Livability +2.6/5.0
- Rent growth +2.5/5.0
- Condition / age +2.5/5.0
- Schools +2.4/10.0
- Appreciation +0.0/10.0
$165,000
🖨 Deal sheet (PDF) 📄 Offer letter ✓ Due diligence
Listing remarks
Live the life you deserve! - including unlimited FREE golf, swimming pools, exercise room, RV Parking and more. This home shows pride of ownership and comes move in ready with a beautiful, carefree, front and backyard and a detached studio that can be used as a shop, craft room or whatever you can dream. The two large bedrooms each have its own bath, and one has a walk-in closet and separate outside entry. In addition to the spacious living room, the home has an equally large family room with a wet bar and direct access to the light and bright kitchen. It's a great floor plan! The screen porch is a favorite and creates a nice retreat. Skyline Ranch Country Club is for residents that are 55+
Key facts
- Rv parking
- Swimming pools
- Exercise room
Tags
Neighborhood map
What this means for you Summary
Snapshot
- This is a 2-bed/2.0-bath manufactured listed at $165k.
Deal economics
- At list price, monthly cash flow is $1k ($18k/yr) — positive.
- The deal already cash-flows at list — no discount required.
- Meets the 1% rule at list price ($3k rent vs $165k).
- Recommended offer: $160k (3.0% below list) — sets the bar for market timing.
- Cap rate 17.2% vs local median 2.5% in Valley Center — top-decile yield for the area; either an underpriced asset or a hidden risk that comps aren't pricing in. Stress-test before assuming the spread holds.
Location & tenants
- Location reads 52/100 on livability (#1,017 in CA) — a working-class tenant base; expect higher turnover. Strengths: employment A+, housing B; Watch: commute C-, schools F, amenities F.
- Valley Center-Pauma Unified (rural): math 16% / reading 34% proficiency, ranked #367 of 517 in CA (top 71%) — low school quality limits family demand, transient renter base, plan for 1-2y turnover.
- Market conditions: 168 active listings in the ZIP; high-income renter base; 11,759 units permitted in San Diego County in 2024 (7,244 in 5+ unit buildings).
Forward outlook
- Local home prices are declining (-3.0%/yr); year-one equity from $1k of loan paydown is wiped out by about $5k of value loss. Plan a longer hold.
- San Diego County population projected at +20% by 2050 — long-run rental-demand tailwind backs the buy-and-hold thesis.
- At projected returns (-3.0% appreciation + 3.0% rent growth), your $46k cash investment doubles in ~4 years — after that, you're playing with house money.
Negotiation context
- It's been on market 39 days — a 3% lower offer ($160k) is reasonable based on typical stale-listing flexibility.
- 5 sale attempts since 6y ago; this cycle's ask has dropped $45k (21%) from the opening price — seller is motivated, your offer sets the floor, not the list.
Risks & watch-outs
- Climate carrying-cost: severe wildfire risk — expect insurance premiums to compound above CPI over the hold.
Questions for the listing agent
- It's been on market 39 days. Have you received any prior offers? Is the seller open to a 3% concession, seller financing, or rate buy-down credit?
- Is there a deadline driving the sale (1031 exchange, divorce, estate, relocation)? That informs how much negotiation room exists.
- Schools are F-rated, which usually means shorter tenancies and higher turnover. Who's the typical renter profile here, and what's been the actual vacancy rate?
- What's the average days-on-market for RENTAL listings here right now (not sales)? A rising rental-DOM trend means longer vacancies and softer asking-rent achievability than the comps imply.
- What's the recent tenant-quality profile in this submarket — average credit score on applications, eviction rate, late-payment / NSF rate, and stable-employment percentage? A property-management company in the area should have these aggregated.
- How much new for-sale + rental construction is in the pipeline within 1–3 miles? Heavy new supply typically softens prices + rents 12–24 months out; constrained supply supports both.
Investment metrics
- 1% rule
- 1.90% ✓
- Cap rate
- 17.15%
- Cash-on-cash
- 38.78%
- DSCR
- 2.73
- GRM
- 4.4
CMA / ARV
- ARV (median comp)
- $231,746
- List price
- $165,000
- Delta
- -28.80%
- Verdict
- UNDERPRICED
- Comps
- 20 within 1.0 mi
Show comp detail 8 sales within ~0.75 mi
| Address | Dist | Beds/Ba | Sqft | Sold | Price | $/sf | Match |
|---|---|---|---|---|---|---|---|
| 18218 Paradise Mountain Rd Spc 200 Spc 200 | 0.00mi | 2/2.0 | 2,038 (-0%) | 11mo | $105,000 | $52 | 91 |
| 18218 Paradise Mountain Rd Spc 151 Spc 151 | 0.00mi | 3/2.0 (+1) | 2,064 (+1%) | 12mo | $289,000 | $140 | 83 |
| 18218 Paradise Mountain Rd #203 | 0.00mi | 2/2.0 | 1,784 (-12%) | 1mo | $275,000 | $154 | 79 |
| 18218 Paradise Mountain Rd Spc 89 | 0.00mi | 2/2.0 | 1,770 (-13%) | 2mo | $215,000 | $121 | 76 |
| 18218 Paradise Mountain Rd Spc 68 | 0.00mi | 3/2.0 (+1) | 2,005 (-2%) | 24mo | $245,000 | $122 | 72 |
| 18218 Paradise Mountain Rd Spc 18 Spc 18 | 0.00mi | 2/2.0 | 1,792 (-12%) | 11mo | $285,000 | $159 | 71 |
| 18218 Paradise Mountain Rd #20 | 0.00mi | 2/2.0 | 1,832 (-10%) | 21mo | $110,000 | $60 | 65 |
| 18218 Paradise Mountain Rd Spc 190 #190 | 0.00mi | 3/2.0 (+1) | 2,300 (+13%) | 12mo | $347,000 | $151 | 64 |
Match score weights: distance 35% · size 25% · config 20% · recency 20%. Top-matched comps best support the ARV.
Projected returns pro-forma
-3.0% appreciation · 3.0% rent growth · sell at horizon
- IRR
- 34.9%
- Equity multiple
- 2.48×
- Total profit
- $68,318
- Equity at exit
- $24,602
- IRR
- 41.7%
- Equity multiple
- 4.93×
- Total profit
- $181,755
- Equity at exit
- $14,266
Cash invested: $46,200 (down + closing). Projections, not guarantees.
Landlord ↔ Tenant lean methodology
- Overall (STATE)
- 18 Strongly Tenant-Friendly
- State California
- 18 Strongly Tenant-Friendly · D+13
- County
- — inherits STATE
- City
- — inherits STATE
ZIP-level market 92082
- Active inventory
- 168
- Price-to-rent
- 4.4×
Monthly cashflow live
- Estimated rent
- $3,137 medium interval (Pro) →
- Mortgage (P&I)
- −$865
- Tax from tax record
- −$51 /mo · $608/yr
- Insurance
- −$69
- HOA
- −$0
- Vacancy / Maint / Mgmt
- −$659
- Net cashflow
- $1,493
Break-even live
Sensitivity live
| Price | -10% $1,587 | -5% $1,540 | +0% $1,493 | +5% $1,447 | +10% $1,400 |
|---|---|---|---|---|---|
| Rent | -10% $1,245 | -5% $1,369 | +0% $1,493 | +5% $1,617 | +10% $1,741 |
| Rate | -1.0pp $1,576 | -0.5pp $1,535 | base $1,493 | +0.5pp $1,450 | +1.0pp $1,407 |
UW: 25.0% down · 7.5% · 30yr · 1.5% tax · 5.0% vac · 8.0% maint · 8.0% mgmt
Financing live
Cash to close
- Down payment
- $41,250
- Closing costs
- $4,950
- Reserves months
- —
- Total cash needed
- —
Loan-product check · same deal, 3 products live
Conventional
25% down · 7.5% · 30yr
- Down + closing
- —
- Monthly P&I
- —
- Monthly cashflow
- —
- DSCR
- —
- Eligible?
- —
Personal DTI + credit; lowest rate.
DSCR
20% down · 8.5% · 30yr
- Down + closing
- —
- Monthly P&I
- —
- Monthly cashflow
- —
- DSCR
- —
- Eligible?
- —
No personal income docs; deal must DSCR.
Hard money
10% down · 12.0% · 12mo
- Down + closing
- —
- Monthly P&I
- —
- Monthly cashflow
- —
- DSCR
- —
- Eligible?
- —
Short-term bridge; refi at stabilization.
Listing history 32 events
-
2026-06-21days on market $165,000 Active 39 DOM
-
2026-06-18days on market $165,000 Active 36 DOM
-
2026-06-17days on market $165,000 Active 35 DOM
-
2026-06-16days on market $165,000 Active 34 DOM
-
2026-06-15days on market $165,000 Active 33 DOM
-
2026-06-13days on market $165,000 Active 31 DOM
-
2026-06-13days on market $165,000 Active 30 DOM
-
2026-06-09days on market $165,000 Active 27 DOM
-
2026-06-08days on market $165,000 Active 26 DOM
-
2026-06-07statusdays on market $165,000 Active 25 DOM
-
2026-05-12historical
-
2026-04-01price $165,000
-
2026-03-23price $189,000
-
2026-02-06price $199,000
-
2025-11-19$210,000 Active
-
2025-09-22historical
-
2025-07-10price $229,900
-
2025-02-03status Active
-
2025-02-03price $269,000
-
2025-02-02historical
-
2024-08-26$285,000 Active
-
2023-09-22soldstatus $193,300 Sold
-
2023-08-30status Pending
-
2023-08-15price $199,000
-
2023-08-08price $260,000
-
2023-07-27price $270,000
-
2023-07-21price $275,000
-
2023-07-06$285,000 Active
-
2023-07-05historical $285,000
-
2021-03-08soldstatus $153,000 Closed Sale
-
2021-02-05status Pending Sale
-
2020-11-07$159,500 Active
ⓘ Source: listings_history table (triggers on properties + properties_extension) + one-shot
backfill from property_details.listing_events for pre-trigger history.
Tax reassessment forecast CA · Resets to sale price
- Current annual tax
- $608 · $51/mo
- Projected year-2 tax
- $1,254 · $104/mo
- Expected delta
- +$646/yr (+$54/mo · 106.2%)
ⓘ Screening estimate from a state-policy table — verify with the county assessor before closing.
Climate risk First Street
- Flood 1/10 Low FEMA zone X (unshaded) · 0% chance over 30 yrs
- Wildfire 10/10 Extreme
- Heat 4/10 Moderate 1 d/yr ≥97°F today · 3 d/yr by 30 yrs out
- Wind 1/10 Low
- Air quality 6/10 Major 10 unhealthy d/yr today · 12 by 30 yrs out
Nearby sold comps map
Loading sold comps map…
Walkable amenities ~0.75 mi
Loading nearby amenities…
Taxation est. · year 1
- Rental income
- $37,639
- − Mortgage interest
- −$9,243
- − Property taxes
- −$608
- − Insurance
- −$825
- − Repairs & maintenance
- −$3,011
- − Management
- −$3,011
- − Depreciation
- −$4,800
- Taxable income
- $16,141
- Est. tax owed @ 24.0%
- −$3,874
- After-tax cash flow
- $14,045/yr
For passive investors: Depreciation is non-cash, so a rental often shows a tax loss while cash-flowing — sheltering income. Rental losses are passive: they offset passive income freely, and up to $25,000/yr can offset ordinary (W-2) income if you actively participate and your MAGI is under $100k (phasing out to $0 by $150k); unused losses carry forward. On sale, claimed depreciation is recaptured at up to 25%, and gains may owe capital-gains tax (a 1031 exchange can defer both). Figures are a year-1 estimate at your 24.0% rate — not tax advice; consult a CPA.
Schools (NCES district)
- District
- Valley Center-Pauma Unified
- NCES district ID
- 0600069
- Math proficiency
- 16% ▼ -8.00%
- Reading proficiency
- 34% ▼ -5.00%
- Median HH income
- $74,438
- Composite
- 24.32/100
- National rank
- #7705
- State rank
- #367 of 517 in CA
Livability — Valley Center
- Score
- 52/100
- State rank
- #1017
- US rank
- #24938
Category grades
Schools grade is shown separately in the Schools card above.
Census & demographics
- County
- San Diego County · 3,178,799 people
- City population
- 21,727
- Metro
- San Diego-Chula Vista-Carlsbad, CA
- Population (ZIP)
- 21,727
- Household income
- $126,544
- Rent vs Own
- Severe rent burden
- 241.0
Population outlook (San Diego County) Hauer SSP2
- Today (2025)
- 3,678,185 people
- By 2030
- 3,856,546 · +4.8%
- By 2040
- 4,171,407 · +13.4%
- By 2050
- 4,421,607 · +20.2%
- By 2075
- 4,831,599 · +31.4%
- By 2100
- 4,832,502 · +31.4%
Race, ethnicity, and origin ACS 2023
- Neighborhood character
- Diverse neighborhood (Simpson 0.61)
- Race & ethnicity
- White 49% Hispanic / Latino 38% Two or more races 23% Native American 4% Asian 3% Black 2%
- Hispanic origin (detail)
- Mexican 33%
- Common ancestry
- Italian 2% Slovak 2% Iranian 1%
- Foreign-born
- 17% · Canada, South Korea
- Languages at home
- 74% English-only · Spanish 22% Tagalog/Filipino 1% Other Indo-European 1%
Political lean MEDSL · San Diego
- 2024 margin
- D (+16.8) · D 56.9% · R 40.1% · Other 2.9%
- 2008→2024 swing
- +6.6pp toward D · 2008: 10.2pp · 2024: 16.8pp
- All cycles
- 2024: D+16.8 2020: D+22.8 2016: D+17.8 2012: D+5.1 2008: D+10.2
Not yet ingested
- Civics
- —
Market trends
- HPI YoY
- ▼ -293.00%
- Current HPI
- 294.6017
- Rent YoY
- —
- Metro
- San Diego-Chula Vista-Carlsbad, CA
- State GDP YoY
- ▲ 3.21%
- F500 in state
- 116
Industry mix (Fortune 500 HQ in CA)
| Industry | F500 HQs | Revenue |
|---|---|---|
| Technology | 27 | $1,492B |
|
||
| Financial Services | 3 | $174B |
|
||
| Retail | 3 | $44B |
|
||
| Insurance | 3 | $26B |
|
||
| Media / Entertainment | 2 | $115B |
|
||
| Pharmaceuticals / Biotech | 2 | $62B |
|
||
Price history
+3.4% since first listed22 events — show timeline
- 2026-05-12 Listing Removed — CRMLS
- 2026-04-01 Price Changed $165,000 CRMLS
- 2026-03-23 Price Changed $189,000 CRMLS
- 2026-02-06 Price Changed $199,000 CRMLS
- 2025-11-19 Listed $210,000 CRMLS
- 2025-09-22 Listing Removed — CRMLS
- 2025-07-10 Price Changed $229,900 CRMLS
- 2025-02-03 Relisted — CRMLS
- 2025-02-03 Price Changed $269,000 CRMLS
- 2025-02-02 Listing Removed — CRMLS
- 2024-08-26 Listed $285,000 CRMLS
- 2023-09-22 Sold (MLS) $193,300 SDMLS
- 2023-08-30 Pending — SDMLS
- 2023-08-15 Price Changed $199,000 SDMLS
- 2023-08-08 Price Changed $260,000 SDMLS
- 2023-07-27 Price Changed $270,000 SDMLS
- 2023-07-21 Price Changed $275,000 SDMLS
- 2023-07-06 Listed $285,000 SDMLS
- 2023-07-05 Coming Soon $285,000 SDMLS
- 2021-03-08 Sold (MLS) $153,000 CRMLS
- 2021-02-05 Pending — CRMLS
- 2020-11-07 Listed $159,500 CRMLS
Property tax history
+2.0%/yrLatest (2013): $608 · +2.3% YoY. Source: county tax records.
Cash-flow waterfall
monthlySold comps — $/sqft
last 12 mo · ≤1 miLoading sold comps…