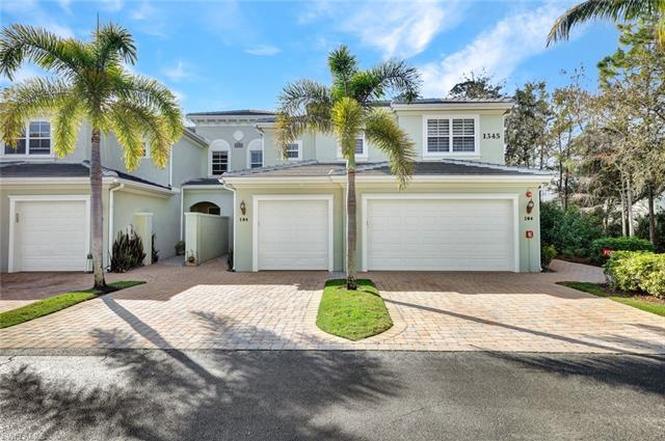
1345 Mariposa Cir #5204 · Vineyards, FL
Flood risk 3/10 · Minor
- FEMA flood zone
- X (unshaded)
- Chance of flooding over 30 yrs
- 0.12%
- Est. flood insurance / yr
- $507 – $1,088
Fire risk 1/10 · Minimal
- Est. fire insurance / yr
- $947 – $1,759
Heat risk 10/10 · Severe
- Hot days now (above 107°F)
- 7 days/yr
- Hot days in 30 yrs
- 27 days/yr
Wind risk 10/10 · Severe
- Chance of severe wind over 30 yrs
- 99.0%
Air-quality risk 2/10 · Minimal
- Unhealthy air days now
- 2 days/yr
- Unhealthy air days in 30 yrs
- 2 days/yr
Risk factors via First Street. Map © Google.
Why this score? — see what drove the C grade
The composite is a weighted blend of 9 inputs, each scored 0–100. Each bar is that input's sub-score; the figure is the points it added to the 100-point composite (weight × sub-score).
- Cash flow +21.6/30.0
- ARV discount +7.5/15.0
- DSCR +6.9/10.0
- 1% rule +5.8/10.0
- Schools +5.0/10.0
- Livability +3.2/5.0
- Rent growth +2.7/5.0
- Condition / age +2.5/5.0
- Appreciation +0.0/10.0
$525,000
🖨 Deal sheet (PDF) 📄 Offer letter ✓ Due diligence
Listing remarks MLS
Don't miss this one! Freshly painted 3+Den/2.5 Bath/2 Car Coach home located in Mariposa at Whippoorwill. All applliances remain including washer & dryer in separate laundry room. Many fine architectural details like arched doorways, tray ceilings and French Doors. Loads of storage and closets. Central and convenient location. This is a Fannie Mae HomePath property. Purchase this property for as little as 3% down! This property is approved for HomePath Mortgage Financing. THIS PROPERTY IS INCLUDED IN THE "FIRST LOOK" MARKETING PERIOD!
Key facts
- Granite-clad kitchen
- Fitness center
- Clubhouse
Tags
Property features AI
Finance
- HOA & community: Mandatory HOA; Monthly HOA fee of $545; Annual recurring HOA fees total $6,540; One-time fees $150; HOA maintenance covers cable, trash removal, and water; Community amenities include clubhouse, community pool, exercise room, sidewalks, and streetlights; Managed as a condo in a gated community; Complex has 180 units; 8 units in building; 2 units per floor; 2 total floors
Exterior
- Parking: Attached 2-car garage; 2+ parking spaces
- Security: Gated community; Entry keypad
- Utilities: Central water; Central sewer; Cable available
- Home design: Residential property in a low-rise (1-3) building; 2-story building; Rear exposure faces south; Located in the Whippoorwill development (Mariposa sub-condo)
- Construction: Concrete block construction; Stucco exterior finish; Tile roof; Built in 2007
- Exterior features: Privacy wall; Sliding windows; Screened lanai/porch
Interior
- Kitchen: Cooktop; Dishwasher; Disposal; Microwave; Refrigerator; Self-cleaning oven; Breakfast bar and eat-in kitchen; Breakfast room and formal dining options
- Bedrooms: 3 bedrooms with split bedroom floor plan
- Flooring: Marble flooring; Wood flooring
- Bathrooms: 2 full bathrooms; 1 half bathroom; Master bath with dual sinks and separate tub and shower
- Heating & cooling: Central electric cooling; Ceiling fans
- Interior features: Built-in cabinets; Cable prewire; Cathedral and vaulted ceilings; Foyer; High-speed internet available; Smoke detectors; Volume ceiling; Walk-in closet; Window coverings; Den (study); Great room; Guest bath; Screened lanai/porch
- Laundry & utility: Washer and dryer included (washer/dryer hookup); Laundry in residence; Auto garage door
Neighborhood map
What this means for you Summary
Snapshot
- This is a 3-bed/2.5-bath condo listed at $525k.
Deal economics
- At list price, monthly cash flow is $794 ($10k/yr) — positive.
- The deal already cash-flows at list — no discount required.
- Meets the 1% rule at list price ($6k rent vs $525k).
- Recommended offer: $462k (12.0% below list) — sets the bar for market timing.
Location & tenants
- Location reads 64/100 on livability (#679 in FL) — a middle-class / working-renter tenant base. Strengths: crime A+, employment A+, housing A-; Watch: health & safety D, amenities F, commute F.
- Collier (suburban): math 60% / reading 56% proficiency, ranked #16 of 73 in FL (top 22%) — acceptable for families but not a draw, mixed tenant base, ~2y average lease.
- Zoned schools: Osceola Elementary School (math 78% / reading 74%, grade A, #198 of 2,144 statewide, top 10%, 621 students, 32% FRL); Pine Ridge Middle School (math 74% / reading 70%, grade A, #52 of 571 statewide, top 10%, 832 students, 31% FRL); Barron Collier High School (math 62% / reading 68%, grade B, #76 of 667 statewide, top 11%, 1,650 students, 26% FRL) — zoned schools average 30% FRL vs 55% district-wide (25 pts lower); this property's tenant base skews higher-income than the district average.
- Zoned-school proficiency averages 71% at this address vs 58% district-wide (+13 pts) — the actual schools serving this property are materially stronger than the Collier average implies; a family-tenant draw the district grade alone would hide.
- Market conditions: Rents flat; 334 active listings in the ZIP; 39 comparable units currently listed for rent nearby; rentals at typical pace (median 25d on market — plan ~3-4 weeks tenant-placement turnaround); solid renter incomes; 3,520 units permitted in Collier County in 2024 (959 in 5+ unit buildings).
- At $5,689/mo this rent would consume 74% of the median local household income ($92k/yr) (locally 780% of renters already pay >50% of income on rent) — very limited rent-growth headroom before tenants either downsize or default.
Forward outlook
- Local home prices are declining (-3.0%/yr); year-one equity from $4k of loan paydown is wiped out by about $16k of value loss. Plan a longer hold.
- Collier County population projected at +30% by 2050 — long-run rental-demand tailwind backs the buy-and-hold thesis.
Negotiation context
- It's been on market 184 days — a 12% lower offer ($462k) is reasonable based on typical stale-listing flexibility.
- 4 sale attempts since 16y ago with the ask held roughly flat each time — persistent listings suggest the price (not the market) is what's stuck; bring a comps-based counter.
- Current owner paid $177k; list at $525k implies a 197% gain — meaningful room to come down on a strong offer.
Risks & watch-outs
- Climate carrying-cost: severe wind risk, 99% chance of damaging wind over 30y; extreme-heat days projected 7→27/yr by 2055 (HVAC capex compounding) — expect insurance premiums to compound above CPI over the hold.
Questions for the listing agent
- It's been on market 184 days. Have you received any prior offers? Is the seller open to a 12% concession, seller financing, or rate buy-down credit?
- What does the HOA fee cover, when was the last increase, and are there any pending special assessments or reserve-fund shortfalls?
- Any open or pending special assessments — roof, HVAC, plumbing, elevator, façade? What's the per-unit balance and payoff schedule, and is the seller paying it off at close or rolling it to the buyer?
- Why hasn't it sold? Are there any deal-killer items the seller is aware of (foundation, flood, title, zoning, code violations)?
- Is there a deadline driving the sale (1031 exchange, divorce, estate, relocation)? That informs how much negotiation room exists.
- What's the average days-on-market for RENTAL listings here right now (not sales)? A rising rental-DOM trend means longer vacancies and softer asking-rent achievability than the comps imply.
- What's the recent tenant-quality profile in this submarket — average credit score on applications, eviction rate, late-payment / NSF rate, and stable-employment percentage? A property-management company in the area should have these aggregated.
- How much new apartment / multifamily construction is in the pipeline within 1–3 miles? Heavy new supply (>2% of stock underway) typically softens rents 12–24 months out; light construction supports rent growth.
Investment metrics
- 1% rule
- 1.08% ✓
- Cap rate
- 8.11%
- Cash-on-cash
- 6.48%
- DSCR
- 1.29
- GRM
- 7.7
CMA / ARV
No comps found within radius.
Projected returns pro-forma
-3.0% appreciation · 0.85% rent growth · sell at horizon
- IRR
- -8.8%
- Equity multiple
- 0.68×
- Total profit
- $-46,399
- Equity at exit
- $78,279
- IRR
- -2.5%
- Equity multiple
- 0.85×
- Total profit
- $-22,084
- Equity at exit
- $45,392
Cash invested: $147,000 (down + closing). Projections, not guarantees.
Landlord ↔ Tenant lean methodology
- Overall (STATE)
- 87 Strongly Landlord-Friendly
- State Florida
- 87 Strongly Landlord-Friendly · R+3
- County
- — inherits STATE
- City
- — inherits STATE
ZIP-level market 34105
- Home prices YoY
- -30.5%
- Rents YoY
- 0.8%
- Active inventory
- 334
- Price-to-rent
- 7.7×
Monthly cashflow live
- Estimated rent
- $5,689 high interval (Pro) →
- Mortgage (P&I)
- −$2,753
- Tax from tax record
- −$183 /mo · $2,197/yr
- Insurance
- −$219
- HOA
- −$545
- Vacancy / Maint / Mgmt
- −$1,195
- Net cashflow
- $794
Break-even live
Sensitivity live
| Price | -10% $1,092 | -5% $943 | +0% $794 | +5% $646 | +10% $497 |
|---|---|---|---|---|---|
| Rent | -10% $345 | -5% $570 | +0% $794 | +5% $1,019 | +10% $1,244 |
| Rate | -1.0pp $1,059 | -0.5pp $928 | base $794 | +0.5pp $658 | +1.0pp $520 |
UW: 25.0% down · 7.5% · 30yr · 1.5% tax · 5.0% vac · 8.0% maint · 8.0% mgmt
Financing live
Cash to close
- Down payment
- $131,250
- Closing costs
- $15,750
- Reserves months
- —
- Total cash needed
- —
Loan-product check · same deal, 3 products live
Conventional
25% down · 7.5% · 30yr
- Down + closing
- —
- Monthly P&I
- —
- Monthly cashflow
- —
- DSCR
- —
- Eligible?
- —
Personal DTI + credit; lowest rate.
DSCR
20% down · 8.5% · 30yr
- Down + closing
- —
- Monthly P&I
- —
- Monthly cashflow
- —
- DSCR
- —
- Eligible?
- —
No personal income docs; deal must DSCR.
Hard money
10% down · 12.0% · 12mo
- Down + closing
- —
- Monthly P&I
- —
- Monthly cashflow
- —
- DSCR
- —
- Eligible?
- —
Short-term bridge; refi at stabilization.
Rent comps 39 comps
| Address | Beds | Baths | Sqft | Rent | $/sqft | DOM | Units | Dist |
|---|---|---|---|---|---|---|---|---|
| 836 Hampton Cir #171 Naples, FL | 3.0 | 2.5 | 1580 | $5,000 | $3.16 | 22d | 1 | 0.23mi |
| 836 Hampton Cir #171 Naples, FL | 3.0 | 2.5 | 1580 | $5,000 | $3.16 | 25d | 1 | 0.23mi |
| 1256 Carpazi Ct Unit 502 Naples, FL | 3.0 | 2.0 | 1744 | $2,495 | $1.43 | 15d | 1 | 0.28mi |
| 1256 Carpazi Ct #502 Naples, FL | 3.0 | 2.0 | 1744 | $2,495 | $1.43 | 25d | 1 | 0.28mi |
| 1299 Verde Dr Unit 1503 Naples, FL | 3.0 | 2.0 | 1744 | $4,200 | $2.41 | 15d | 1 | 0.31mi |
| 1303 Verde Dr Unit 1603 Naples, FL | 3.0 | 2.0 | 1877 | $2,500 | $1.33 | 15d | 1 | 0.33mi |
| 12839 Carrington Cir Unit 8-102 Naples, FL | 3.0 | 2.0 | 2063 | $6,500 | $3.15 | 25d | 1 | 0.36mi |
| 6559 Monterey Pt Naples, FL | 3.0 | 2.0 | 2300 | $9,000 | $3.91 | 22d | 1 | 0.45mi |
| 6525 Monterey Pt Unit 203 Naples, FL | 3.0 | 2.5 | 2288 | $5,250 | $2.29 | 15d | 1 | 0.45mi |
| 6548 Monterey Pt Unit 204 Naples, FL | 3.0 | 2.5 | 2288 | $6,000 | $2.62 | 15d | 1 | 0.48mi |
| 13078 Pembroke Dr Naples, FL | 3.0 | 2.5 | 2024 | $6,500 | $3.21 | 25d | 1 | 0.50mi |
| 12885 Brynwood Way Naples, FL | 3.0 | 3.0 | 2489 | $10,000 | $4.02 | 25d | 1 | 0.51mi |
| 12667 Biscayne Ct Naples, FL | 4.0 | 3.5 | 2600 | $8,500 | $3.27 | 25d | 1 | 0.55mi |
| 12914 Brynwood Preserve Ln Naples, FL | 2.0 | 2.0 | 1720 | $7,000 | $4.07 | 25d | 1 | 0.55mi |
| 6542 Marbella Dr Naples, FL | 3.0 | 2.5 | 2144 | $6,250 | $2.92 | 25d | 1 | 0.56mi |
| 6670 Marbella Ln Naples, FL | 3.0 | 3.0 | 2439 | $8,400 | $3.44 | 25d | 1 | 0.57mi |
| 12848 Brynwood Way Naples, FL | 4.0 | 2.5 | 2689 | $6,000 | $2.23 | 25d | 1 | 0.58mi |
| 12902 Brynwood Preserve Ln Naples, FL | 3.0 | 3.0 | 2100 | $7,500 | $3.57 | 25d | 1 | 0.58mi |
| 12832 Brynwood Way Naples, FL | 3.0 | 2.0 | 1714 | $5,250 | $3.06 | 15d | 1 | 0.61mi |
| 4740 Stratford Ct #1603 Naples, FL | 3.0 | 3.0 | 2686 | $14,000 | $5.21 | 25d | 1 | 0.85mi |
| 4752 Stratford Ct #1404 Naples, FL | 3.0 | 3.0 | 2686 | $8,500 | $3.16 | 25d | 1 | 0.86mi |
| 3099 Lancaster Dr Unit 7-701 Naples, FL | 2.0 | 2.0 | 2160 | $10,000 | $4.63 | 25d | 1 | 1.10mi |
| 104 Siena Way #1407 Naples, FL | 2.0 | 2.0 | 1450 | $7,000 | $4.83 | 25d | 1 | 1.14mi |
| 106 Siena Way #1508 Naples, FL | 2.0 | 2.0 | 1414 | $4,500 | $3.18 | 25d | 1 | 1.15mi |
| 3255 Tamara Dr #4 Naples, FL | 3.0 | 2.5 | 1437 | $2,500 | $1.74 | 15d | 1 | 1.18mi |
| 103 Tuscana Ct #1107 Naples, FL | 2.0 | 2.0 | 1412 | $5,000 | $3.54 | 25d | 1 | 1.18mi |
| 155 Vintage Cir #103 Naples, FL | 2.0 | 2.0 | 1500 | $5,000 | $3.33 | 15d | 1 | 1.20mi |
| 172 Vintage Cir #202 Naples, FL | 3.0 | 2.0 | 1774 | $5,195 | $2.93 | 15d | 1 | 1.21mi |
| 102 Tuscana Ct #901 Naples, FL | 2.0 | 2.0 | 1631 | $2,300 | $1.41 | 25d | 1 | 1.22mi |
| 6025 Chardonnay Ln Unit 1Unit 102 Naples, FL | 2.0 | 2.0 | 1414 | $2,195 | $1.55 | 25d | 1 | 1.22mi |
| 3268 Amanda Ln #3 Naples, FL | 3.0 | 2.5 | 1437 | $2,350 | $1.64 | 15d | 1 | 1.25mi |
| 5065 Kensington High St Naples, FL | 3.0 | 3.0 | 2661 | $20,000 | $7.52 | 25d | 1 | 1.28mi |
| 210 Vintage Cir Unit C401 Naples, FL | 3.0 | 2.0 | 1520 | $6,500 | $4.28 | 15d | 1 | 1.28mi |
| 200 Vintage Cir Unit D304 Naples, FL | 3.0 | 2.0 | 1492 | $2,800 | $1.88 | 15d | 1 | 1.30mi |
| 152 Napa Ridge Way Naples, FL | 3.0 | 2.0 | 1775 | $7,000 | $3.94 | 25d | 1 | 1.36mi |
| 224 Via Perignon Unit 5-4 Naples, FL | 2.0 | 2.5 | 2085 | $6,000 | $2.88 | 22d | 1 | 1.38mi |
| 116 Fountain Cir Naples, FL | 3.0 | 2.0 | 1561 | $4,500 | $2.88 | 25d | 1 | 1.39mi |
| 5950 Almaden Dr Naples, FL | 3.0 | 2.0 | 1762 | $6,500 | $3.69 | 25d | 1 | 1.45mi |
| 271 Perignon Pl Unit 16-1 Naples, FL | 2.0 | 2.0 | 1449 | $2,700 | $1.86 | 25d | 1 | 1.46mi |
HOA detail condo
- Monthly dues
- $545 · $6,540/yr
- Assessments
- None detected in remarks — confirm with the listing agent.
Listing history 14 events
-
2026-06-21days on market $525,000 Active 184 DOM
-
2026-06-18days on market $525,000 Active 181 DOM
-
2026-06-17days on market $525,000 Active 180 DOM
-
2026-06-16days on market $525,000 Active 179 DOM
-
2026-06-15days on market $525,000 Active 178 DOM
-
2026-06-10days on market $525,000 Active 173 DOM
-
2026-06-09days on market $525,000 Active 172 DOM
-
2026-06-08days on market $525,000 Active 171 DOM
-
2026-06-07days on market $525,000 Active 170 DOM
-
2026-06-03days on market $525,000 Active 166 DOM
-
2026-06-02days on market $525,000 Active 165 DOM
-
2026-06-01days on market $525,000 Active 164 DOM
-
2026-05-31remarks 687-char remark
-
2026-05-31$525,000 Active 163 DOM
ⓘ Source: listings_history table (triggers on properties + properties_extension) + one-shot
backfill from property_details.listing_events for pre-trigger history.
Tax reassessment forecast FL · Resets to sale price
- Current annual tax
- $2,197 · $183/mo
- Projected year-2 tax
- $4,358 · $363/mo
- Expected delta
- +$2,161/yr (+$180/mo · 98.3%)
ⓘ Screening estimate from a state-policy table — verify with the county assessor before closing.
Climate risk First Street
- Flood 3/10 Moderate FEMA zone X (unshaded) · 12% chance over 30 yrs
- Wildfire 1/10 Low
- Heat 10/10 Extreme 7 d/yr ≥107°F today · 27 d/yr by 30 yrs out
- Wind 10/10 Extreme 99% chance of damaging wind over 30 yrs
- Air quality 2/10 Low 2 unhealthy d/yr today · 2 by 30 yrs out
Nearby sold comps map
Loading sold comps map…
Walkable amenities ~0.75 mi
Loading nearby amenities…
Taxation est. · year 1
- Rental income
- $68,268
- − Mortgage interest
- −$29,408
- − Property taxes
- −$2,197
- − Insurance
- −$2,625
- − Repairs & maintenance
- −$5,461
- − Management
- −$5,461
- − HOA
- −$6,540
- − Depreciation
- −$15,273
- Taxable income
- $1,303
- Est. tax owed @ 24.0%
- −$313
- After-tax cash flow
- $9,220/yr
For passive investors: Depreciation is non-cash, so a rental often shows a tax loss while cash-flowing — sheltering income. Rental losses are passive: they offset passive income freely, and up to $25,000/yr can offset ordinary (W-2) income if you actively participate and your MAGI is under $100k (phasing out to $0 by $150k); unused losses carry forward. On sale, claimed depreciation is recaptured at up to 25%, and gains may owe capital-gains tax (a 1031 exchange can defer both). Figures are a year-1 estimate at your 24.0% rate — not tax advice; consult a CPA.
Schools (NCES district)
- District
- Collier
- NCES district ID
- 1200330
- Math proficiency
- 60% ▼ -4.00%
- Reading proficiency
- 56% ▼ -2.00%
- Median HH income
- $58,275
- Composite
- 50.23/100
- National rank
- #1892
- State rank
- #16 of 73 in FL
Livability — Vineyards
- Score
- 64/100
- State rank
- #679
- US rank
- #14101
Category grades
Schools grade is shown separately in the Schools card above.
Census & demographics
- County
- Collier County · 396,295 people
- Metro
- Naples-Marco Island, FL
- Population (ZIP)
- 15,441
- Household income
- $92,214
- Rent vs Own
- Severe rent burden
- 780.0
Population outlook (Collier County) Hauer SSP2
- Today (2025)
- 420,858 people
- By 2030
- 450,054 · +6.9%
- By 2040
- 502,232 · +19.3%
- By 2050
- 544,932 · +29.5%
- By 2075
- 627,203 · +49.0%
- By 2100
- 659,015 · +56.6%
Race, ethnicity, and origin ACS 2023
- Neighborhood character
- Predominantly White (79%)
- Race & ethnicity
- White 79% Hispanic / Latino 14% Two or more races 7% Asian 5%
- Hispanic origin (detail)
- Mexican 3% Puerto Rican 1% Cuban 3% Salvadoran 1%
- Common ancestry
- Romanian 3% Lithuanian 3% Italian 3%
- Foreign-born
- 22% · Canada, China, Jamaica
- Languages at home
- 77% English-only · Spanish 11% Other Indo-European 3% Russian/Polish/Slavic 3%
Political lean MEDSL · Collier
- 2024 margin
- Solid R (+33.1) · D 33.1% · R 66.2%
- 2008→2024 swing
- -10.6pp toward R · 2008: -22.5pp · 2024: -33.1pp
- All cycles
- 2024: R+33.1 2020: R+24.7 2016: R+26.0 2012: R+30.1 2008: R+22.5
Not yet ingested
- Civics
- —
Market trends
- HPI YoY
- ▼ -124.65%
- Current HPI
- 283.9084
- Rent YoY
- ▲ 0.85%
- Metro
- Naples-Marco Island, FL
- State GDP YoY
- ▲ 3.28%
- F500 in state
- 36
Industry mix (Fortune 500 HQ in FL)
| Industry | F500 HQs | Revenue |
|---|---|---|
| Industrial Technology | 2 | $29B |
|
||
| Insurance | 2 | $17B |
|
||
| Retail | 1 | $60B |
|
||
| Technology Distribution | 1 | $58B |
|
||
| Homebuilding | 1 | $35B |
|
||
| Technology Manufacturing | 1 | $35B |
|
||
Price history
+162.6% since first listed7 events — show timeline
- 2026-04-16 Price Changed $525,000 NAPLESMLS
- 2025-12-19 Listed $539,000 NAPLESMLS
- 2025-07-31 Listing Removed — NAPLESMLS
- 2025-02-13 Listed $569,000 NAPLESMLS
- 2011-03-07 Sold (MLS) $177,000 NAPLESMLS
- 2011-02-16 Listed $179,900 NAPLESMLS
- 2010-08-27 Listed $199,900 NAPLESMLS
Property tax history
+2.1%/yrLatest (2025): $2,197 · +2.5% YoY. Source: county tax records.
Cash-flow waterfall
monthlySold comps — $/sqft
last 12 mo · ≤1 miLoading sold comps…