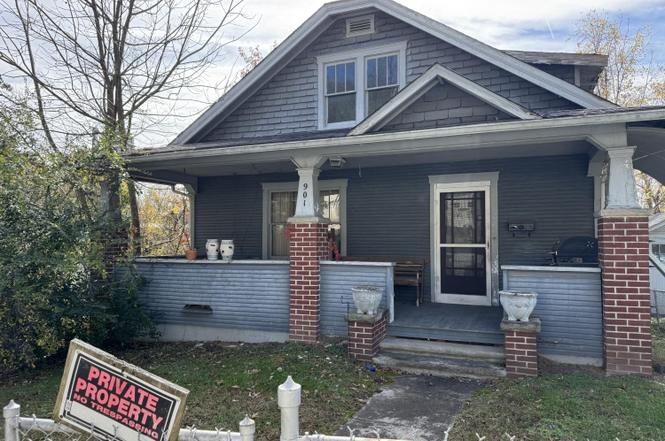
901 Park Dr · Dunbar, WV
Flood risk 10/10 · Severe
- FEMA flood zone
- A
- Chance of flooding over 30 yrs
- 0.99%
- Est. flood insurance / yr
- $946 – $6,584
Fire risk 4/10 · Minor
- Est. fire insurance / yr
- $787 – $1,461
Heat risk 5/10 · Moderate
- Hot days now (above 101°F)
- 7 days/yr
- Hot days in 30 yrs
- 20 days/yr
Wind risk 2/10 · Minimal
- Chance of severe wind over 30 yrs
- 1.0%
Air-quality risk 1/10 · Minimal
- Unhealthy air days now
- 0 days/yr
- Unhealthy air days in 30 yrs
- 0 days/yr
Risk factors via First Street. Map © Google.
Why this score? — see what drove the D grade
The composite is a weighted blend of 9 inputs, each scored 0–100. Each bar is that input's sub-score; the figure is the points it added to the 100-point composite (weight × sub-score).
- Cash flow +15.0/30.0
- ARV discount +7.5/15.0
- 1% rule +5.0/10.0
- DSCR +5.0/10.0
- Livability +3.5/5.0
- Schools +2.9/10.0
- Rent growth +2.5/5.0
- Condition / age +2.5/5.0
- Appreciation +0.0/10.0
$29,900
🖨 Deal sheet 📄 Offer letter ✓ Due diligence
Listing remarks
Dunbar, WV 4 bedroom 2 bath home, fenced yard, basement.
Key facts
- Fenced yard
- Basement
- Garage
Tags
Property features AI
Exterior
- Parking: Attached garage
- Home design: Residential property
- Construction: Block foundation
- Exterior features: Shingle and wood roof
Interior
- Flooring: Hardwood flooring; Laminate flooring
- Bathrooms: Two full bathrooms
- Heating & cooling: No heating system specified; No cooling system specified
- Interior features: Laminate countertops; Hardwood and laminate flooring; Seven total rooms
Neighborhood map
What this means for you Summary
Snapshot
- This is a 4-bed/2.0-bath single-family listed at $30k.
Deal economics
- At list price, monthly cash flow is $446 ($5k/yr) — positive.
- The deal already cash-flows at list — no discount required.
- Meets the 1% rule at list price ($1k rent vs $30k).
- Recommended offer: $26k (12.0% below list) — sets the bar for market timing.
- Cap rate 36.8% vs local median 4.2% in Dunbar — top-decile yield for the area; either an underpriced asset or a hidden risk that comps aren't pricing in. Stress-test before assuming the spread holds.
Location & tenants
- Location reads 70/100 on livability (#62 in WV) — a middle-class / working-renter tenant base. Strengths: cost of living A+, housing A+, health & safety B+; Watch: employment D+, schools F, amenities F.
- Kanawha County Schools (suburban): math 29% / reading 40% proficiency, ranked #17 of 55 in WV (top 31%) — families likely to look elsewhere, expect single-tenant / working-renter base with shorter leases.
- Market conditions: 46 active listings in the ZIP; 103 units permitted in Kanawha County in 2024 (0 in 5+ unit buildings).
Forward outlook
- Local home prices are declining (-3.0%/yr); year-one equity from $207 of loan paydown is wiped out by about $897 of value loss. Plan a longer hold.
- Kanawha County population projected at -17% by 2050 — secular population decline; favor cash flow + early exit over multi-decade hold.
- At projected returns (-3.0% appreciation + 3.0% rent growth), your $8k cash investment doubles in ~2 years — after that, you're playing with house money.
Negotiation context
- It's been on market 222 days — a 12% lower offer ($26k) is reasonable based on typical stale-listing flexibility.
Risks & watch-outs
- Watch-outs: flood insurance adds $314/mo; built in 1930 — expect roof / HVAC / electrical / plumbing capex.
- Climate carrying-cost: in FEMA flood zone A (mandatory federal flood insurance); extreme-heat days projected 7→20/yr by 2055 (HVAC capex compounding) — expect insurance premiums to compound above CPI over the hold.
Questions for the listing agent
- It's been on market 222 days. Have you received any prior offers? Is the seller open to a 12% concession, seller financing, or rate buy-down credit?
- Built in 1930 — when were the roof, HVAC, electrical panel, plumbing, and water heater last replaced?
- What's the actual annual flood-insurance premium (NFIP or private), and is the property in a SFHA with mandatory coverage?
- Why hasn't it sold? Are there any deal-killer items the seller is aware of (foundation, flood, title, zoning, code violations)?
- Is there a deadline driving the sale (1031 exchange, divorce, estate, relocation)? That informs how much negotiation room exists.
- Schools are F-rated, which usually means shorter tenancies and higher turnover. Who's the typical renter profile here, and what's been the actual vacancy rate?
- The area grade is low — what's the realistic commute time and amenity access for the typical tenant pool here? Any planned neighborhood developments (good or bad) we should know about?
- What's the average days-on-market for RENTAL listings here right now (not sales)? A rising rental-DOM trend means longer vacancies and softer asking-rent achievability than the comps imply.
- What's the recent tenant-quality profile in this submarket — average credit score on applications, eviction rate, late-payment / NSF rate, and stable-employment percentage? A property-management company in the area should have these aggregated.
- How much new for-sale + rental construction is in the pipeline within 1–3 miles? Heavy new supply typically softens prices + rents 12–24 months out; constrained supply supports both.
Investment metrics
- 1% rule
- 4.18% ✓
- Cap rate
- 36.80%
- Cash-on-cash
- 108.94%
- DSCR
- 5.85
- GRM
- 2.0
CMA / ARV
- ARV (on-the-fly)
- $185,409
- Comps found
- 12
Show comp detail 12 sales within ~0.75 mi
| Address | Dist | Beds/Ba | Sqft | Sold | Price | $/sf | Match |
|---|---|---|---|---|---|---|---|
| 1325 West Virginia Ave | 0.58mi | 4/2.0 | 1,703 (+0%) | 16mo | $201,000 | $118 | 59 |
| 1313 Moore Ave | 0.45mi | 3/1.5 (-1) | 1,650 (-3%) | 15mo | $143,035 | $87 | 55 |
| 1335 West Virginia Ave | 0.61mi | 4/2.0 | 1,603 (-6%) | 9mo | $175,000 | $109 | 54 |
| 1231 Grosscup Ave | 0.49mi | 3/2.5 (-1) | 1,680 (-1%) | 18mo | $180,000 | $107 | 54 |
| 435 Park Ave | 0.73mi | 3/2.0 (-1) | 1,651 (-3%) | 6mo | $195,700 | $119 | 51 |
| 1239 West Virginia Ave | 0.51mi | 3/2.0 (-1) | 1,588 (-7%) | 13mo | $193,000 | $122 | 49 |
| 538 20th St | 0.73mi | 4/2.0 | 1,839 (+8%) | 5mo | $185,000 | $101 | 48 |
| 1322 West Virginia Ave | 0.57mi | 3/1.5 (-1) | 1,612 (-5%) | 13mo | $130,000 | $81 | 47 |
| 827 Valley Dr | 0.73mi | 3/2.5 (-1) | 1,729 (+2%) | 18mo | $195,000 | $113 | 41 |
| 14 Perkins Way | 0.72mi | 3/2.5 (-1) | 1,816 (+7%) | 10mo | $298,000 | $164 | 40 |
| 5103 Indiana St | 0.71mi | 3/2.0 (-1) | 1,484 (-13%) | 6mo | $150,000 | $101 | 35 |
| 422 18th St | 0.67mi | 3/1.5 (-1) | 1,505 (-12%) | 14mo | $65,000 | $43 | 31 |
Match score weights: distance 35% · size 25% · config 20% · recency 20%. Top-matched comps best support the ARV.
Projected returns pro-forma
-3.0% appreciation · 3.0% rent growth · sell at horizon
- IRR
- 63.3%
- Equity multiple
- 3.84×
- Total profit
- $23,806
- Equity at exit
- $4,458
- IRR
- 67.9%
- Equity multiple
- 7.96×
- Total profit
- $58,245
- Equity at exit
- $2,585
Cash invested: $8,372 (down + closing). Projections, not guarantees.
Landlord ↔ Tenant lean methodology
- Overall (STATE)
- 83 Strongly Landlord-Friendly
- State West Virginia
- 83 Strongly Landlord-Friendly · R+22
- County
- — inherits STATE
- City
- — inherits STATE
ZIP-level market 25064
- Home prices YoY
- -14.2%
- Active inventory
- 46
- Price-to-rent
- 2.0×
Monthly cashflow live
- Estimated rent
- $1,250 medium interval (Pro) →
- Mortgage (P&I)
- −$157
- Tax from tax record
- −$58 /mo · $701/yr
- Insurance
- −$12
- Flood insurance flood zone
- −$314 /mo · $3,765/yr
- HOA
- −$0
- Vacancy / Maint / Mgmt
- −$263
- Net cashflow
- $446
Break-even live
UW: 25.0% down · 7.5% · 30yr · 1.5% tax · 5.0% vac · 8.0% maint · 8.0% mgmt
Financing live
Cash to close
- Down payment
- $7,475
- Closing costs
- $897
- Reserves months
- —
- Total cash needed
- —
Loan-product check · same deal, 3 products live
Conventional
25% down · 7.5% · 30yr
- Down + closing
- —
- Monthly P&I
- —
- Monthly cashflow
- —
- DSCR
- —
- Eligible?
- —
Personal DTI + credit; lowest rate.
DSCR
20% down · 8.5% · 30yr
- Down + closing
- —
- Monthly P&I
- —
- Monthly cashflow
- —
- DSCR
- —
- Eligible?
- —
No personal income docs; deal must DSCR.
Hard money
10% down · 12.0% · 12mo
- Down + closing
- —
- Monthly P&I
- —
- Monthly cashflow
- —
- DSCR
- —
- Eligible?
- —
Short-term bridge; refi at stabilization.
Listing history 23 events
-
2026-06-19days on market $29,900 Active 222 DOM
-
2026-06-18days on market $29,900 Active 221 DOM
-
2026-06-17days on market $29,900 Active 220 DOM
-
2026-06-16days on market $29,900 Active 219 DOM
-
2026-06-15days on market $29,900 Active 218 DOM
-
2026-06-14days on market $29,900 Active 216 DOM
-
2026-06-12days on market $29,900 Active 215 DOM
-
2026-06-09days on market $29,900 Active 212 DOM
-
2026-06-08days on market $29,900 Active 211 DOM
-
2026-06-07days on market $29,900 Active 210 DOM
-
2026-06-05days on market $29,900 Active 207 DOM
-
2026-06-03days on market $29,900 Active 206 DOM
-
2026-06-02days on market $29,900 Active 205 DOM
-
2026-06-01days on market $29,900 Active 204 DOM
-
2026-05-31days on market $29,900 Active 203 DOM
-
2026-05-30days on market $29,900 Active 202 DOM
-
2026-04-30price $29,900
-
2026-03-21price $35,900
-
2026-02-13price $39,900
-
2026-01-01price $41,900
-
2025-12-09price $44,900
-
2025-11-09$49,900 Active
-
1986-11-26soldstatus $32,000
ⓘ Source: listings_history table (triggers on properties + properties_extension) + one-shot
backfill from property_details.listing_events for pre-trigger history.
Tax reassessment forecast WV · Resets to sale price
- Current annual tax
- $701 · $58/mo
- Projected year-2 tax
- $701 · $58/mo
- Expected delta
- $0/yr ($0/mo · 0.0%)
ⓘ Screening estimate from a state-policy table — verify with the county assessor before closing.
Climate risk First Street
- Flood 10/10 Extreme FEMA zone A · 99% chance over 30 yrs
- Wildfire 4/10 Moderate
- Heat 5/10 Major 7 d/yr ≥101°F today · 20 d/yr by 30 yrs out
- Wind 2/10 Low 100% chance of damaging wind over 30 yrs
- Air quality 1/10 Low 0 unhealthy d/yr today · 0 by 30 yrs out
Nearby sold comps map
Loading sold comps map…
Walkable amenities ~0.75 mi
Loading nearby amenities…
Taxation est. · year 1
- Rental income
- $15,004
- − Mortgage interest
- −$1,675
- − Property taxes
- −$701
- − Insurance
- −$3,914
- − Repairs & maintenance
- −$1,200
- − Management
- −$1,200
- − Depreciation
- −$870
- Taxable income
- $5,443
- Est. tax owed @ 24.0%
- −$1,306
- After-tax cash flow
- $4,049/yr
For passive investors: Depreciation is non-cash, so a rental often shows a tax loss while cash-flowing — sheltering income. Rental losses are passive: they offset passive income freely, and up to $25,000/yr can offset ordinary (W-2) income if you actively participate and your MAGI is under $100k (phasing out to $0 by $150k); unused losses carry forward. On sale, claimed depreciation is recaptured at up to 25%, and gains may owe capital-gains tax (a 1031 exchange can defer both). Figures are a year-1 estimate at your 24.0% rate — not tax advice; consult a CPA.
Schools (NCES district)
- District
- Kanawha County Schools
- NCES district ID
- 5400600
- Math proficiency
- 29% ▼ -13.00%
- Reading proficiency
- 40% ▼ -7.00%
- Median HH income
- $44,329
- Composite
- 29.35/100
- National rank
- #6540
- State rank
- #17 of 55 in WV
Livability — Dunbar
- Score
- 70/100
- State rank
- #62
- US rank
- #7810
Category grades
Schools grade is shown separately in the Schools card above.
Census & demographics
- Census place
- Dunbar, WV
- Population (ZIP)
- 9,182
Population outlook (Kanawha County) Hauer SSP2
- Today (2025)
- 178,946 people
- By 2030
- 172,906 · -3.4%
- By 2040
- 159,874 · -10.7%
- By 2050
- 148,148 · -17.2%
- By 2075
- 123,257 · -31.1%
- By 2100
- 96,454 · -46.1%
Race, ethnicity, and origin ACS 2023
- Neighborhood character
- Predominantly White (72%)
- Race & ethnicity
- White 72% Black 16% Two or more races 7% Hispanic / Latino 3% Pacific Islander 2% Asian 1%
- Common ancestry
- Serbian 2% Italian 2% Slovak 2%
- Foreign-born
- 1% · Canada
- Languages at home
- 97% English-only · Spanish 1% Tagalog/Filipino 1%
Political lean MEDSL · Kanawha
- 2024 margin
- R (+17.4) · D 40.2% · R 57.6% · Other 2.2%
- 2008→2024 swing
- -17.0pp toward R · 2008: -0.4pp · 2024: -17.4pp
- All cycles
- 2024: R+17.4 2020: R+14.7 2016: R+20.6 2012: R+11.9 2008: R+0.4
Not yet ingested
- Civics
- —
Market trends
- HPI YoY
- ▼ -28.70%
- Current HPI
- 172.7534
- Rent YoY
- —
- Metro
- —
- State GDP YoY
- —
- F500 in state
- 0
Price history
-6.6% since first listed7 events — show timeline
- 2026-04-30 Price Changed $29,900 GVBOR
- 2026-03-21 Price Changed $35,900 GVBOR
- 2026-02-13 Price Changed $39,900 GVBOR
- 2026-01-01 Price Changed $41,900 GVBOR
- 2025-12-09 Price Changed $44,900 GVBOR
- 2025-11-09 Listed $49,900 GVBOR
- 1986-11-26 Sold (Public Records) $32,000 Public Records
Property tax history
+2.1%/yrLatest (2025): $701 · +5.5% YoY. Source: county tax records.
Cash-flow waterfall
monthlySold comps — $/sqft
last 12 mo · ≤1 miLoading sold comps…