5004 Green Dolphin Way Unit Share B · Kiawah Island, SC
Flood risk 9/10 · Severe
- FEMA flood zone
- AE
- Chance of flooding over 30 yrs
- 0.99%
- Est. flood insurance / yr
- $1,737 – $8,500
Fire risk 1/10 · Minimal
- Est. fire insurance / yr
- $783 – $1,453
Heat risk 10/10 · Severe
- Hot days now (above 105°F)
- 7 days/yr
- Hot days in 30 yrs
- 22 days/yr
Wind risk 9/10 · Severe
- Chance of severe wind over 30 yrs
- 99.0%
Air-quality risk 2/10 · Minimal
- Unhealthy air days now
- 1 days/yr
- Unhealthy air days in 30 yrs
- 1 days/yr
Risk factors via First Street. Map © Google.
Why this score? — see what drove the C- grade
The composite is a weighted blend of 9 inputs, each scored 0–100. Each bar is that input's sub-score; the figure is the points it added to the 100-point composite (weight × sub-score).
- Cash flow +20.1/30.0
- ARV discount +7.6/15.0
- DSCR +6.4/10.0
- 1% rule +5.3/10.0
- Schools +4.3/10.0
- Rent growth +3.2/5.0
- Livability +3.2/5.0
- Condition / age +2.5/5.0
- Appreciation +0.0/10.0
$269,000
🖨 Deal sheet 📄 Offer letter ✓ Due diligence
Listing remarks
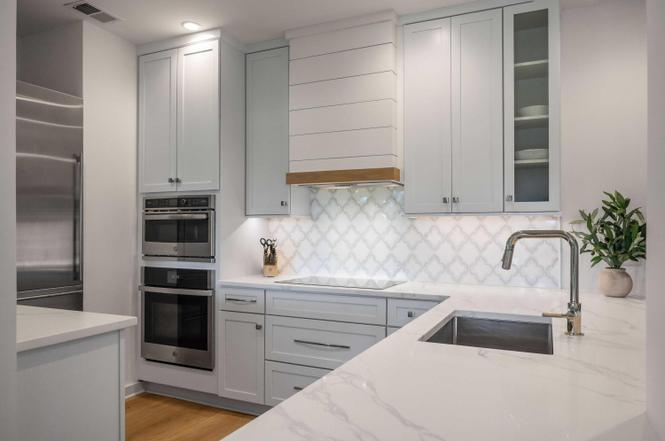
Walk to the Beach!! A beautifully remodeled 3-bedroom, 3 full bath villa, offered through fractional ownership with 6-week share opportunities available. Located in the exclusive Turtle Point community, this luxurious residence delivers sweeping golf and lagoon views over the renowned Turtle Point Golf Course and is just a 4-minute walk to Kiawah's 10-mile pristine beaches. Villa features White Oak hardwood floors throughout, custom-built closets and a spa-like master bathroom w/ dual vanities. The open concept living area flows seamlessly into a gourmet kitchen equipped with quartz countertops and stainless-steel appliances. Enjoy the outdoor deck and spacious screened in porch while liste
Key facts
- Gourmet kitchen
- Custom-built closets
- Remodeled villa
Tags
Property features AI
Finance
- HOA & community: Clubhouse; Club membership available; Fitness center; Golf course; Golf membership available; Park; Tennis courts; Trash service; Walk/jog trails
Exterior
- Parking: Off-street parking
- Security: Community security
- Utilities: Public sewer; Berkeley Electric Co-Op service
- Home design: Residential fractional ownership; Two levels; Kiawah Island community
- Construction: No other structures indicated
- Exterior features: Located on a golf course; Lagoon waterfront
Interior
- Kitchen: Built-in electric oven; Electric cooktop; Electric range; Microwave; Dishwasher; Disposal; Refrigerator
- Bedrooms: 3 bedrooms (master bedroom includes ceiling fan)
- Flooring: Ceramic tile; Wood
- Bathrooms: 3 bathrooms
- Heating & cooling: Central heating; Central air
- Interior features: Ceiling fan(s)
- Laundry & utility: Washer; Washer hookup; Dryer; Electric dryer hookup
Neighborhood map
What this means for you Summary
Snapshot
- This is a 3-bed/3.0-bath single-family listed at $269k.
Deal economics
- At list price, monthly cash flow is $-94 ($-1k/yr) — negative.
- To cash-flow at today's rent, offer at most $255k (5.1% below list).
- Meets the 1% rule at list price ($3k rent vs $269k).
- Recommended offer: $237k (12.0% below list) — sets the bar for market timing.
- Cap rate 7.8% vs local median 0.0% in Kiawah Island — top-decile yield for the area; either an underpriced asset or a hidden risk that comps aren't pricing in. Stress-test before assuming the spread holds.
Location & tenants
- Location reads 64/100 on livability (#154 in SC) — a middle-class / working-renter tenant base. Strengths: crime A+, employment A+; Watch: housing C-, amenities F, commute F.
- Charleston 01 (urban): math 48% / reading 53% proficiency, ranked #7 of 80 in SC (top 9%) — acceptable for families but not a draw, mixed tenant base, ~2y average lease.
- Zoned schools: Haut Gap Middle (math 39% / reading 44%, grade F, #68 of 229 statewide, top 31%, 444 students, 100% FRL); St. Johns High (math 42% / reading 72%, grade C, #120 of 196 statewide, top 64%, 387 students, 100% FRL) — zoned schools average 100% FRL vs 44% district-wide (56 pts higher); higher-poverty schools than district average — tighter screening recommended.
- Market conditions: Rents rising (+3.0%/yr); 568 active listings in the ZIP; high-income renter base; 4,156 units permitted in Charleston County in 2024 (857 in 5+ unit buildings).
Forward outlook
- Local home prices are declining (-3.0%/yr); year-one equity from $2k of loan paydown is wiped out by about $8k of value loss. Plan a longer hold.
- Charleston County population projected at +44% by 2050 — long-run rental-demand tailwind backs the buy-and-hold thesis.
Negotiation context
- It's been on market 145 days — a 12% lower offer ($237k) is reasonable based on typical stale-listing flexibility.
Risks & watch-outs
- Watch-outs: flood insurance adds $427/mo.
- Climate carrying-cost: in FEMA flood zone AE (mandatory federal flood insurance); severe wind risk, 99% chance of damaging wind over 30y; extreme-heat days projected 7→22/yr by 2055 (HVAC capex compounding) — expect insurance premiums to compound above CPI over the hold.
Questions for the listing agent
- What do current leases actually rent for vs. the listed asking? Can we see a recent rent roll and the last 12 months of T-12 income?
- It's been on market 145 days. Have you received any prior offers? Is the seller open to a 12% concession, seller financing, or rate buy-down credit?
- What's the actual annual flood-insurance premium (NFIP or private), and is the property in a SFHA with mandatory coverage?
- Why hasn't it sold? Are there any deal-killer items the seller is aware of (foundation, flood, title, zoning, code violations)?
- Is there a deadline driving the sale (1031 exchange, divorce, estate, relocation)? That informs how much negotiation room exists.
- What's the average days-on-market for RENTAL listings here right now (not sales)? A rising rental-DOM trend means longer vacancies and softer asking-rent achievability than the comps imply.
- What's the recent tenant-quality profile in this submarket — average credit score on applications, eviction rate, late-payment / NSF rate, and stable-employment percentage? A property-management company in the area should have these aggregated.
- How much new for-sale + rental construction is in the pipeline within 1–3 miles? Heavy new supply typically softens prices + rents 12–24 months out; constrained supply supports both.
Investment metrics
- 1% rule
- 1.03% ✓
- Cap rate
- 7.78%
- Cash-on-cash
- 5.30%
- DSCR
- 1.24
- GRM
- 8.1
CMA / ARV
- ARV (on-the-fly)
- $269,328
- Comps found
- 3
Show comp detail 3 sales within ~0.75 mi
| Address | Dist | Beds/Ba | Sqft | Sold | Price | $/sf | Match |
|---|---|---|---|---|---|---|---|
| 5004 Green Dolphin Way Unit Share D | 0.00mi | 3/3.0 | 1,448 (0%) | 3mo | $269,000 | $186 | 98 |
| 5004 Green Dolphin Way Unit Share E | 0.00mi | 3/3.0 | 1,448 (0%) | 3mo | $269,000 | $186 | 98 |
| 4507 Park Lake Dr | 0.49mi | 3/3.0 | 1,240 (-14%) | 16mo | $140,000 | $113 | 40 |
Match score weights: distance 35% · size 25% · config 20% · recency 20%. Top-matched comps best support the ARV.
Projected returns pro-forma
-3.0% appreciation · 2.95% rent growth · sell at horizon
- IRR
- -18.7%
- Equity multiple
- 0.34×
- Total profit
- $-49,418
- Equity at exit
- $40,109
- IRR
- -11.0%
- Equity multiple
- 0.34×
- Total profit
- $-50,085
- Equity at exit
- $23,258
Cash invested: $75,320 (down + closing). Projections, not guarantees.
Landlord ↔ Tenant lean methodology
- Overall (STATE)
- 90 Strongly Landlord-Friendly
- State South Carolina
- 90 Strongly Landlord-Friendly · R+6
- County
- — inherits STATE
- City
- — inherits STATE
ZIP-level market 29455
- Rents YoY
- 3.0%
- Active inventory
- 568
- Price-to-rent
- 8.1×
Monthly cashflow live
- Estimated rent
- $2,774 medium interval (Pro) →
- Mortgage (P&I)
- −$1,411
- Tax est. 1.5%
- −$336 /mo · $4,035/yr
- Insurance
- −$112
- Flood insurance flood zone
- −$427 /mo · $5,118/yr
- HOA
- −$0
- Vacancy / Maint / Mgmt
- −$583
- Net cashflow
- $-94
Break-even live
UW: 25.0% down · 7.5% · 30yr · 1.5% tax · 5.0% vac · 8.0% maint · 8.0% mgmt
Financing live
Cash to close
- Down payment
- $67,250
- Closing costs
- $8,070
- Reserves months
- —
- Total cash needed
- —
Loan-product check · same deal, 3 products live
Conventional
25% down · 7.5% · 30yr
- Down + closing
- —
- Monthly P&I
- —
- Monthly cashflow
- —
- DSCR
- —
- Eligible?
- —
Personal DTI + credit; lowest rate.
DSCR
20% down · 8.5% · 30yr
- Down + closing
- —
- Monthly P&I
- —
- Monthly cashflow
- —
- DSCR
- —
- Eligible?
- —
No personal income docs; deal must DSCR.
Hard money
10% down · 12.0% · 12mo
- Down + closing
- —
- Monthly P&I
- —
- Monthly cashflow
- —
- DSCR
- —
- Eligible?
- —
Short-term bridge; refi at stabilization.
Listing history 13 events
-
2026-06-18days on market $269,000 Active 145 DOM
-
2026-06-17days on market $269,000 Active 144 DOM
-
2026-06-16days on market $269,000 Active 143 DOM
-
2026-06-15days on market $269,000 Active 142 DOM
-
2026-06-10days on market $269,000 Active 137 DOM
-
2026-06-09days on market $269,000 Active 136 DOM
-
2026-06-08days on market $269,000 Active 135 DOM
-
2026-06-07days on market $269,000 Active 134 DOM
-
2026-06-05days on market $269,000 Active 131 DOM
-
2026-06-03days on market $269,000 Active 130 DOM
-
2026-06-01days on market $269,000 Active 128 DOM
-
2026-05-31days on market $269,000 Active 127 DOM
-
2026-01-24$269,000 Active
ⓘ Source: listings_history table (triggers on properties + properties_extension) + one-shot
backfill from property_details.listing_events for pre-trigger history.
Climate risk First Street
- Flood 9/10 Extreme FEMA zone AE · 99% chance over 30 yrs
- Wildfire 1/10 Low
- Heat 10/10 Extreme 7 d/yr ≥105°F today · 22 d/yr by 30 yrs out
- Wind 9/10 Extreme 99% chance of damaging wind over 30 yrs
- Air quality 2/10 Low 1 unhealthy d/yr today · 1 by 30 yrs out
Nearby sold comps map
Loading sold comps map…
Walkable amenities ~0.75 mi
Loading nearby amenities…
Taxation est. · year 1
- Rental income
- $33,288
- − Mortgage interest
- −$15,068
- − Property taxes
- −$4,035
- − Insurance
- −$6,464
- − Repairs & maintenance
- −$2,663
- − Management
- −$2,663
- − Depreciation
- −$7,825
- Taxable loss
- −$5,430
- Est. tax savings @ 24.0%
- +$1,303
- After-tax cash flow
- $174/yr
For passive investors: Depreciation is non-cash, so a rental often shows a tax loss while cash-flowing — sheltering income. Rental losses are passive: they offset passive income freely, and up to $25,000/yr can offset ordinary (W-2) income if you actively participate and your MAGI is under $100k (phasing out to $0 by $150k); unused losses carry forward. On sale, claimed depreciation is recaptured at up to 25%, and gains may owe capital-gains tax (a 1031 exchange can defer both). Figures are a year-1 estimate at your 24.0% rate — not tax advice; consult a CPA.
Schools (NCES district)
- District
- Charleston 01
- NCES district ID
- 4501440
- Math proficiency
- 48% ▼ -2.00%
- Reading proficiency
- 53% ▬ 0.00%
- Median HH income
- $52,376
- Composite
- 43.41/100
- National rank
- #3018
- State rank
- #7 of 80 in SC
Livability — Kiawah Island
- Score
- 64/100
- State rank
- #154
- US rank
- #14517
Category grades
Schools grade is shown separately in the Schools card above.
Census & demographics
- Census place
- Kiawah Island, SC
- County
- Charleston County · 366,793 people
- Metro
- Charleston-North Charleston, SC
- Population (ZIP)
- 27,576
- Household income
- $121,372
- Rent vs Own
- Severe rent burden
- 304.0
Population outlook (Charleston County) Hauer SSP2
- Today (2025)
- 480,562 people
- By 2030
- 525,921 · +9.4%
- By 2040
- 612,189 · +27.4%
- By 2050
- 691,627 · +43.9%
- By 2075
- 847,979 · +76.5%
- By 2100
- 926,482 · +92.8%
Race, ethnicity, and origin ACS 2023
- Neighborhood character
- Predominantly White (75%)
- Race & ethnicity
- White 75% Black 11% Hispanic / Latino 8% Two or more races 6% Native American 3%
- Hispanic origin (detail)
- Mexican 4%
- Common ancestry
- Lithuanian 5% Romanian 4% Slovak 3%
- Foreign-born
- 5% · Canada, Dominican Republic
- Languages at home
- 92% English-only · Spanish 6%
Political lean MEDSL · Charleston
- 2024 margin
- Lean D (+5.7) · D 51.9% · R 46.3% · Other 1.8%
- 2008→2024 swing
- -2.7pp toward R · 2008: 8.3pp · 2024: 5.7pp
- All cycles
- 2024: D+5.7 2020: D+12.9 2016: D+7.9 2012: D+2.4 2008: D+8.3
Not yet ingested
- Civics
- —
Market trends
- HPI YoY
- ▼ -223.02%
- Current HPI
- 297.7408
- Rent YoY
- ▲ 2.95%
- Metro
- Charleston-North Charleston, SC
- State GDP YoY
- ▲ 4.51%
- F500 in state
- 2
Industry mix (Fortune 500 HQ in SC)
| Industry | F500 HQs | Revenue |
|---|---|---|
| Packaging | 1 | $7B |
|
||
Price history
1 event — show timeline
- 2026-01-24 Listed $269,000 Charleston Trident MLS
Cash-flow waterfall
monthlySold comps — $/sqft
last 12 mo · ≤1 miLoading sold comps…