 🏷️ Likely Rental
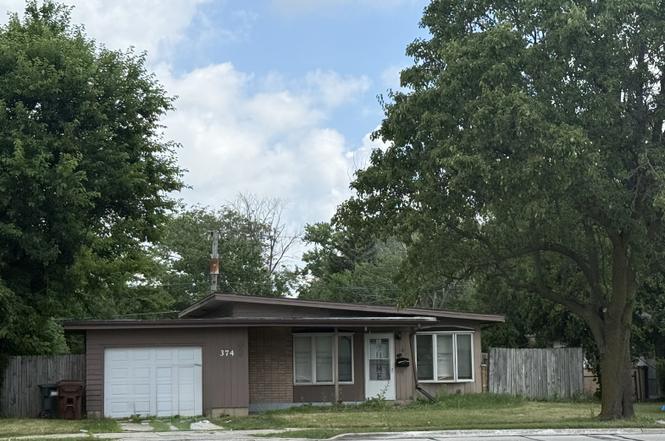
374 Sauk Trl · Park Forest, IL
Flood risk 1/10 · Minimal
- FEMA flood zone
- X (unshaded)
- Chance of flooding over 30 yrs
- 0.0%
- Est. flood insurance / yr
- $473 – $860
Fire risk 1/10 · Minimal
- Est. fire insurance / yr
- $804 – $1,492
Heat risk 3/10 · Minor
- Hot days now (above 101°F)
- 7 days/yr
- Hot days in 30 yrs
- 16 days/yr
Wind risk 2/10 · Minimal
- Chance of severe wind over 30 yrs
- —
Air-quality risk 2/10 · Minimal
- Unhealthy air days now
- 1 days/yr
- Unhealthy air days in 30 yrs
- 1 days/yr
Risk factors via First Street. Map © Google.
Why this score? — see what drove the B grade
The composite is a weighted blend of 9 inputs, each scored 0–100. Each bar is that input's sub-score; the figure is the points it added to the 100-point composite (weight × sub-score).
- Cash flow +30.0/30.0
- ARV discount +15.0/15.0
- 1% rule +10.0/10.0
- DSCR +10.0/10.0
- Livability +3.9/5.0
- Rent growth +2.5/5.0
- Condition / age +2.5/5.0
- Schools +0.9/10.0
- Appreciation +0.0/10.0
$125,000
🖨 Deal sheet (PDF) 📄 Offer letter ✓ Due diligence
Listing remarks
This classic ranch-style home with an attached garage has 3 bedrooms and 1.5 bathrooms. This property presents a fantastic opportunity for buyers or investors. Currently tenant-occupied with a lease in place through 02/28/2027. Schedule your showing today!
Key facts
- 7,562 sq ft lot
- Garage
- Built 1956
Property features AI
Finance
- Other: Possession at closing
- Financial info: Special service area: No
- HOA & community: No master association fee required
Exterior
- Parking: Attached garage (1-car)
- Utilities: Public water; Public sewer
- Home design: Detached single-family home; One-story layout; Fee simple ownership; Property currently leased
- Construction: Brick construction; Built 61–70 years ago; Built before 1978
- Exterior features: Lot smaller than 0.25 acre; Lot dimensions recorded
Interior
- Kitchen: Kitchen on the main level (approximately 10 x 12)
- Bedrooms: 3 bedrooms (all on the main level); Master bedroom on the main level with a full bath
- Bathrooms: 1 full bathroom; 1 half bathroom
- Heating & cooling: Natural gas heating; Central air conditioning
- Interior features: 7 total rooms
- Laundry & utility: Dedicated laundry room
Neighborhood map
What this means for you Summary
Snapshot
- This is a 3-bed/1.5-bath single-family listed at $125k.
Deal economics
- At list price, monthly cash flow is $746 ($9k/yr) — positive.
- The deal already cash-flows at list — no discount required.
- Meets the 1% rule at list price ($2k rent vs $125k).
- Recommended offer: $114k (9.0% below list) — sets the bar for market timing.
- Cap rate 13.5% vs local median 9.7% in Park Forest — top-decile yield for the area; either an underpriced asset or a hidden risk that comps aren't pricing in. Stress-test before assuming the spread holds.
Location & tenants
- Location reads 78/100 on livability (#148 in IL, #2,726 nationally) — a middle-class / working-renter tenant base. Strengths: commute A+, cost of living A+, housing A+; Watch: schools D+, amenities F.
- Rich Twp Hsd 227 (suburban): math 5% / reading 12% proficiency, ranked #577 of 620 in IL (top 93%) — low school quality limits family demand, transient renter base, plan for 1-2y turnover.
- Market conditions: 102 active listings in the ZIP; 21 comparable units currently listed for rent nearby; rentals leasing fast (median 13d on market — plan ~1-2 weeks tenant-placement turnaround); 6,272 units permitted in Cook County in 2024 (4,658 in 5+ unit buildings).
- This rent runs 40% of the median local income ($62k/yr) — at the standard rent-burdened threshold; future hikes will face affordability resistance.
Forward outlook
- Local home prices are declining (-3.0%/yr); year-one equity from $864 of loan paydown is wiped out by about $4k of value loss. Plan a longer hold.
- At projected returns (-3.0% appreciation + 3.0% rent growth), your $35k cash investment doubles in ~5 years — after that, you're playing with house money.
Negotiation context
- It's been on market 111 days — a 9% lower offer ($114k) is reasonable based on typical stale-listing flexibility.
- 11 sale attempts since 17y ago with the ask held roughly flat each time — persistent listings suggest the price (not the market) is what's stuck; bring a comps-based counter.
- Current owner paid $70k; list at $125k implies a 79% gain — meaningful room to come down on a strong offer.
Risks & watch-outs
- Watch-outs: built in 1956 — expect roof / HVAC / electrical / plumbing capex.
Questions for the listing agent
- It's been on market 111 days. Have you received any prior offers? Is the seller open to a 9% concession, seller financing, or rate buy-down credit?
- Built in 1956 — when were the roof, HVAC, electrical panel, plumbing, and water heater last replaced?
- Why hasn't it sold? Are there any deal-killer items the seller is aware of (foundation, flood, title, zoning, code violations)?
- Is there a deadline driving the sale (1031 exchange, divorce, estate, relocation)? That informs how much negotiation room exists.
- Schools are D-rated, which usually means shorter tenancies and higher turnover. Who's the typical renter profile here, and what's been the actual vacancy rate?
- What's the average days-on-market for RENTAL listings here right now (not sales)? A rising rental-DOM trend means longer vacancies and softer asking-rent achievability than the comps imply.
- What's the recent tenant-quality profile in this submarket — average credit score on applications, eviction rate, late-payment / NSF rate, and stable-employment percentage? A property-management company in the area should have these aggregated.
- How much new for-sale + rental construction is in the pipeline within 1–3 miles? Heavy new supply typically softens prices + rents 12–24 months out; constrained supply supports both.
Investment metrics
- 1% rule
- 1.63% ✓
- Cap rate
- 13.46%
- Cash-on-cash
- 25.59%
- DSCR
- 2.14
- GRM
- 5.1
CMA / ARV
- ARV (on-the-fly)
- $160,290
- Comps found
- 12
Show comp detail 12 sales within ~0.75 mi
| Address | Dist | Beds/Ba | Sqft | Sold | Price | $/sf | Match |
|---|---|---|---|---|---|---|---|
| 506 Wildwood Dr | 0.22mi | 3/1.5 | 1,170 (0%) | 3mo | $160,000 | $137 | 87 |
| 356 Wilshire St | 0.18mi | 3/1.5 | 1,248 (+7%) | 2mo | $50,000 | $40 | 79 |
| 308 Minocqua St | 0.39mi | 3/1.0 | 1,148 (-2%) | 1mo | $139,000 | $121 | 76 |
| 3435 218 Pl | 0.53mi | 3/1.5 | 1,154 (-1%) | 2mo | $183,000 | $159 | 71 |
| 251 Westwood Dr | 0.35mi | 3/2.0 | 1,248 (+7%) | 2mo | $217,000 | $174 | 69 |
| 306 Winnebago St | 0.36mi | 3/2.0 | 1,088 (-7%) | 3mo | $105,000 | $97 | 67 |
| 356 Winnebago St | 0.48mi | 3/2.0 | 1,088 (-7%) | 1mo | $150,000 | $138 | 63 |
| 314 Windsor St | 0.23mi | 3/1.0 | 1,014 (-13%) | 2mo | $141,000 | $139 | 63 |
| 433 Lakewood Blvd | 0.59mi | 3/1.5 | 1,248 (+7%) | 2mo | $165,000 | $132 | 60 |
| 434 Shabbona Dr | 0.74mi | 3/1.0 | 1,092 (-7%) | 0mo | $177,900 | $163 | 52 |
| 210 Marquette St | 0.75mi | 3/1.0 | 1,269 (+8%) | 1mo | $153,000 | $121 | 48 |
| 254 Blackhawk Dr | 0.65mi | 2/1.0 (-1) | 1,000 (-14%) | 2mo | $105,000 | $105 | 37 |
Match score weights: distance 35% · size 25% · config 20% · recency 20%. Top-matched comps best support the ARV.
Projected returns pro-forma
-3.0% appreciation · 3.0% rent growth · sell at horizon
- IRR
- 19.2%
- Equity multiple
- 1.78×
- Total profit
- $27,314
- Equity at exit
- $18,638
- IRR
- 27.5%
- Equity multiple
- 3.43×
- Total profit
- $85,122
- Equity at exit
- $10,808
Cash invested: $35,000 (down + closing). Projections, not guarantees.
Landlord ↔ Tenant lean methodology
- Overall (STATE)
- 43 Moderately Tenant-Leaning
- State Illinois
- 43 Moderately Tenant-Leaning · D+7
- County
- — inherits STATE
- City
- — inherits STATE
ZIP-level market 60466
- Home prices YoY
- -21.1%
- Active inventory
- 102
- Price-to-rent
- 5.1×
Monthly cashflow live
- Estimated rent
- $2,038 high interval (Pro) →
- Mortgage (P&I)
- −$656
- Tax est. 1.5%
- −$156 /mo · $1,875/yr
- Insurance
- −$52
- HOA
- −$0
- Vacancy / Maint / Mgmt
- −$428
- Net cashflow
- $746
Break-even live
Sensitivity live
| Price | -10% $833 | -5% $790 | +0% $746 | +5% $703 | +10% $660 |
|---|---|---|---|---|---|
| Rent | -10% $585 | -5% $666 | +0% $746 | +5% $827 | +10% $907 |
| Rate | -1.0pp $809 | -0.5pp $778 | base $746 | +0.5pp $714 | +1.0pp $681 |
UW: 25.0% down · 7.5% · 30yr · 1.5% tax · 5.0% vac · 8.0% maint · 8.0% mgmt
Financing live
Cash to close
- Down payment
- $31,250
- Closing costs
- $3,750
- Reserves months
- —
- Total cash needed
- —
Loan-product check · same deal, 3 products live
Conventional
25% down · 7.5% · 30yr
- Down + closing
- —
- Monthly P&I
- —
- Monthly cashflow
- —
- DSCR
- —
- Eligible?
- —
Personal DTI + credit; lowest rate.
DSCR
20% down · 8.5% · 30yr
- Down + closing
- —
- Monthly P&I
- —
- Monthly cashflow
- —
- DSCR
- —
- Eligible?
- —
No personal income docs; deal must DSCR.
Hard money
10% down · 12.0% · 12mo
- Down + closing
- —
- Monthly P&I
- —
- Monthly cashflow
- —
- DSCR
- —
- Eligible?
- —
Short-term bridge; refi at stabilization.
Rent comps 21 comps
| Address | Beds | Baths | Sqft | Rent | $/sqft | DOM | Units | Dist |
|---|---|---|---|---|---|---|---|---|
| 400 Watseka St Park Forest, IL | 4.0 | 2.0 | 1161 | $2,161 | $1.86 | 16d | 1 | 0.35mi |
| 3905 Tower Dr Richton Park, IL | 1.0–2.0 | 1.0–2.0 | 905 | $1,795 | $1.98 | 1d | 19 | 0.59mi |
| 4014 Euclid Ln Richton Park, IL | 2.0 | 1.0 | 1100 | $2,100 | $1.91 | 7d | 1 | 0.62mi |
| 4014 Euclid Ln Richton Park, IL | 2.0 | 1.0 | 1100 | $2,100 | $1.91 | 22d | 1 | 0.62mi |
| 4014 Euclid Ln Richton Park, IL | 3.0 | 1.0 | 1100 | $2,100 | $1.91 | 13d | 1 | 0.62mi |
| 411 Huron St Park Forest, IL | 3.0 | 1.0 | 1092 | $2,300 | $2.11 | 25d | 1 | 0.88mi |
| 277 Somonauk St Park Forest, IL | 3.0 | 1.0 | 966 | $2,000 | $2.07 | 3d | 1 | 0.92mi |
| 22501 Butterfield Rd Unit 22411-514 Richton Park, IL | 2.0 | 1.5 | 1021 | $1,365 | $1.34 | 7d | 1 | 0.95mi |
| 22501 Butterfield Rd Unit 22400-311 Richton Park, IL | 2.0 | 1.0 | 882 | $1,360 | $1.54 | 7d | 1 | 0.95mi |
| 22501 Butterfield Rd Unit 22411-506 Richton Park, IL | 2.0 | 1.0 | 882 | $1,325 | $1.50 | 7d | 1 | 0.95mi |
| 22501 Butterfield Rd Unit 22415-207 Richton Park, IL | 2.0 | 1.5 | 944 | $1,360 | $1.44 | 7d | 1 | 0.95mi |
| 22501 Butterfield Rd Unit 22419-109 Richton Park, IL | 2.0 | 1.0 | 798 | $1,310 | $1.64 | 7d | 1 | 0.95mi |
| 372 Oswego St Park Forest, IL | 4.0 | 1.0 | 1200 | $2,600 | $2.17 | 25d | 1 | 0.99mi |
| 3838 216th Pl Matteson, IL | 2.0 | 2.0 | 1160 | $1,996 | $1.72 | 20d | 1 | 1.02mi |
| 490 Shabbona Dr Park Forest, IL | 3.0 | 1.0 | 1300 | $1,895 | $1.46 | 3d | 1 | 1.13mi |
| 111 Nashua St Park Forest, IL | 4.0 | 1.5 | 1500 | $2,500 | $1.67 | 25d | 1 | 1.18mi |
| 22015 E Churchill Dr Richton Park, IL | 4.0 | 2.0 | 1200 | $2,300 | $1.92 | 25d | 1 | 1.25mi |
| 235 Tampa St Park Forest, IL | 3.0 | 1.0 | 1092 | $2,000 | $1.83 | 25d | 1 | 1.32mi |
| 194 Monee Rd Park Forest, IL | 3.0 | 1.0 | 1092 | $1,971 | $1.80 | 22d | 1 | 1.33mi |
| 3324 Western Ave Park Forest, IL | 1.0–3.0 | 1.0 | 1026 | $1,995 | $1.94 | 1d | 11 | 1.33mi |
| 3538 212th Pl Matteson, IL | 3.0 | 1.0 | 1209 | $2,000 | $1.65 | 25d | 1 | 1.37mi |
Listing history 45 events
-
2026-06-18days on market $125,000 Active 111 DOM
-
2026-06-17days on market $125,000 Active 110 DOM
-
2026-06-16days on market $125,000 Active 109 DOM
-
2026-06-15days on market $125,000 Active 108 DOM
-
2026-06-13days on market $125,000 Active 106 DOM
-
2026-06-09days on market $125,000 Active 102 DOM
-
2026-06-08days on market $125,000 Active 101 DOM
-
2026-06-07days on market $125,000 Active 100 DOM
-
2026-06-04days on market $125,000 Active 97 DOM
-
2026-06-03days on market $125,000 Active 96 DOM
-
2026-06-02days on market $125,000 Active 95 DOM
-
2026-06-01days on market $125,000 Active 94 DOM
-
2026-05-31days on market $125,000 Active 93 DOM
-
2026-02-27$125,000 Active
-
2026-02-27historical
-
2025-07-18Active
-
2025-07-17historical
-
2025-01-10Active
-
2025-01-10Active
-
2025-01-10historical
-
2021-07-28soldstatus $70,000
-
2021-07-16soldstatus $70,000 Closed
-
2021-07-14status Back On Market
-
2021-07-13historical
-
2021-07-12New
-
2021-04-10status Contingent (Do Not Show)
-
2021-03-31historical
-
2021-02-12price $88,000
-
2020-12-27price $93,000
-
2020-11-17$98,000 New
-
2014-09-06historical
-
2014-06-19price Price Change
-
2014-03-22price Price Change
-
2014-03-06New
-
2009-12-04soldstatus $25,000 Closed Sale
-
2009-10-12historical Contingent
-
2009-10-06price $30,000 Price Change
-
2009-10-02$37,900 New
-
2009-09-29historical
-
2009-09-24status Reactivated
-
2009-09-11historical Contingent
-
2009-08-18New
-
2003-10-24soldstatus $127,000
-
2002-06-07soldstatus $82,500
-
1991-08-07soldstatus $63,000
ⓘ Source: listings_history table (triggers on properties + properties_extension) + one-shot
backfill from property_details.listing_events for pre-trigger history.
Climate risk First Street
- Flood 1/10 Low FEMA zone X (unshaded) · 0% chance over 30 yrs
- Wildfire 1/10 Low
- Heat 3/10 Moderate 7 d/yr ≥101°F today · 16 d/yr by 30 yrs out
- Wind 2/10 Low
- Air quality 2/10 Low 1 unhealthy d/yr today · 1 by 30 yrs out
Nearby sold comps map
Loading sold comps map…
Walkable amenities ~0.75 mi
Loading nearby amenities…
Taxation est. · year 1
- Rental income
- $24,459
- − Mortgage interest
- −$7,002
- − Property taxes
- −$1,875
- − Insurance
- −$625
- − Repairs & maintenance
- −$1,957
- − Management
- −$1,957
- − Depreciation
- −$3,636
- Taxable income
- $7,408
- Est. tax owed @ 24.0%
- −$1,778
- After-tax cash flow
- $7,179/yr
For passive investors: Depreciation is non-cash, so a rental often shows a tax loss while cash-flowing — sheltering income. Rental losses are passive: they offset passive income freely, and up to $25,000/yr can offset ordinary (W-2) income if you actively participate and your MAGI is under $100k (phasing out to $0 by $150k); unused losses carry forward. On sale, claimed depreciation is recaptured at up to 25%, and gains may owe capital-gains tax (a 1031 exchange can defer both). Figures are a year-1 estimate at your 24.0% rate — not tax advice; consult a CPA.
Schools (NCES district)
- District
- Rich Twp Hsd 227
- NCES district ID
- 1733420
- Math proficiency
- 5% ▼ -3.00%
- Reading proficiency
- 12% ▬ 0.00%
- Median HH income
- $56,056
- Composite
- 8.93/100
- National rank
- #9885
- State rank
- #577 of 620 in IL
Livability — Park Forest
- Score
- 78/100
- State rank
- #148
- US rank
- #2726
Category grades
Schools grade is shown separately in the Schools card above.
Census & demographics
- Census place
- Park Forest, IL
- County
- Cook County · 4,486,803 people
- City population
- 21,461
- Metro
- Chicago-Naperville-Elgin, IL-IN-WI
- Population (ZIP)
- 21,461
- Household income
- $61,654
- Rent vs Own
- Severe rent burden
- 900.0
Population outlook (Cook County) Hauer SSP2
- Today (2025)
- 5,347,519 people
- By 2030
- 5,357,703 · +0.2%
- By 2040
- 5,324,924 · -0.4%
- By 2050
- 5,230,762 · -2.2%
- By 2075
- 4,785,735 · -10.5%
- By 2100
- 4,188,836 · -21.7%
Race, ethnicity, and origin ACS 2023
- Neighborhood character
- Predominantly Black (69%)
- Race & ethnicity
- Black 69% White 19% Hispanic / Latino 9% Two or more races 3% Native American 1%
- Hispanic origin (detail)
- Mexican 8%
- Common ancestry
- Romanian 2% Iranian 1% Italian 1%
- Foreign-born
- 6% · Canada
- Languages at home
- 90% English-only · Spanish 7% French/Haitian/Cajun 1% Russian/Polish/Slavic 1%
Political lean MEDSL · Cook
- 2024 margin
- Solid D (+42.0) · D 70.4% · R 28.4% · Other 1.2%
- 2008→2024 swing
- -11.4pp toward R · 2008: 53.4pp · 2024: 42.0pp
- All cycles
- 2024: D+42.0 2020: D+50.3 2016: D+53.0 2012: D+49.4 2008: D+53.4
Not yet ingested
- Civics
- —
Market trends
- HPI YoY
- ▼ -58.87%
- Current HPI
- 219.9692
- Rent YoY
- —
- Metro
- Chicago-Naperville-Elgin, IL-IN-WI
- State GDP YoY
- ▲ 1.59%
- F500 in state
- 60
Industry mix (Fortune 500 HQ in IL)
| Industry | F500 HQs | Revenue |
|---|---|---|
| Insurance | 4 | $201B |
|
||
| Consumer Goods | 4 | $87B |
|
||
| Industrial Machinery | 3 | $64B |
|
||
| Healthcare | 2 | $55B |
|
||
| Retail / Pharmacy | 1 | $148B |
|
||
| Agriculture / Food | 1 | $86B |
|
||
Price history
+98.4% since first listed32 events — show timeline
- 2026-02-27 Listing Removed — MRED as Distributed by MLS Grid
- 2026-02-27 Listed $125,000 MRED as Distributed by MLS Grid
- 2025-07-18 Listed — MRED as Distributed by MLS Grid
- 2025-07-17 Listing Removed — MRED as Distributed by MLS Grid
- 2025-01-10 Listing Removed — MRED as Distributed by MLS Grid
- 2025-01-10 Listed — MRED as Distributed by MLS Grid
- 2025-01-10 Listed — MRED as Distributed by MLS Grid
- 2021-07-28 Sold (Public Records) $70,000 Public Records
- 2021-07-16 Sold (MLS) $70,000 MRED as Distributed by MLS Grid
- 2021-07-14 Relisted — MRED as Distributed by MLS Grid
- 2021-07-13 Listing Removed — MRED as Distributed by MLS Grid
- 2021-07-12 Listed — MRED as Distributed by MLS Grid
- 2021-04-10 Pending — MRED as Distributed by MLS Grid
- 2021-03-31 Listing Removed — MRED as Distributed by MLS Grid
- 2021-02-12 Price Changed $88,000 MRED as Distributed by MLS Grid
- 2020-12-27 Price Changed $93,000 MRED as Distributed by MLS Grid
- 2020-11-17 Listed $98,000 MRED as Distributed by MLS Grid
- 2014-09-06 Listing Removed — MRED as Distributed by MLS Grid
- 2014-06-19 Price Changed — MRED as Distributed by MLS Grid
- 2014-03-22 Price Changed — MRED as Distributed by MLS Grid
- 2014-03-06 Listed — MRED as Distributed by MLS Grid
- 2009-12-04 Sold (MLS) $25,000 MRED as Distributed by MLS Grid
- 2009-10-12 Contingent — MRED as Distributed by MLS Grid
- 2009-10-06 Price Changed $30,000 MRED as Distributed by MLS Grid
- 2009-10-02 Listed $37,900 MRED as Distributed by MLS Grid
- 2009-09-29 Listing Removed — MRED as Distributed by MLS Grid
- 2009-09-24 Relisted — MRED as Distributed by MLS Grid
- 2009-09-11 Contingent — MRED as Distributed by MLS Grid
- 2009-08-18 Listed — MRED as Distributed by MLS Grid
- 2003-10-24 Sold (Public Records) $127,000 Public Records
- 2002-06-07 Sold (Public Records) $82,500 Public Records
- 1991-08-07 Sold (Public Records) $63,000 Public Records
Property tax history
+5.0%/yrLatest (2023): $8,051 · +8.6% YoY. Source: county tax records.
Cash-flow waterfall
monthlySold comps — $/sqft
last 12 mo · ≤1 miLoading sold comps…