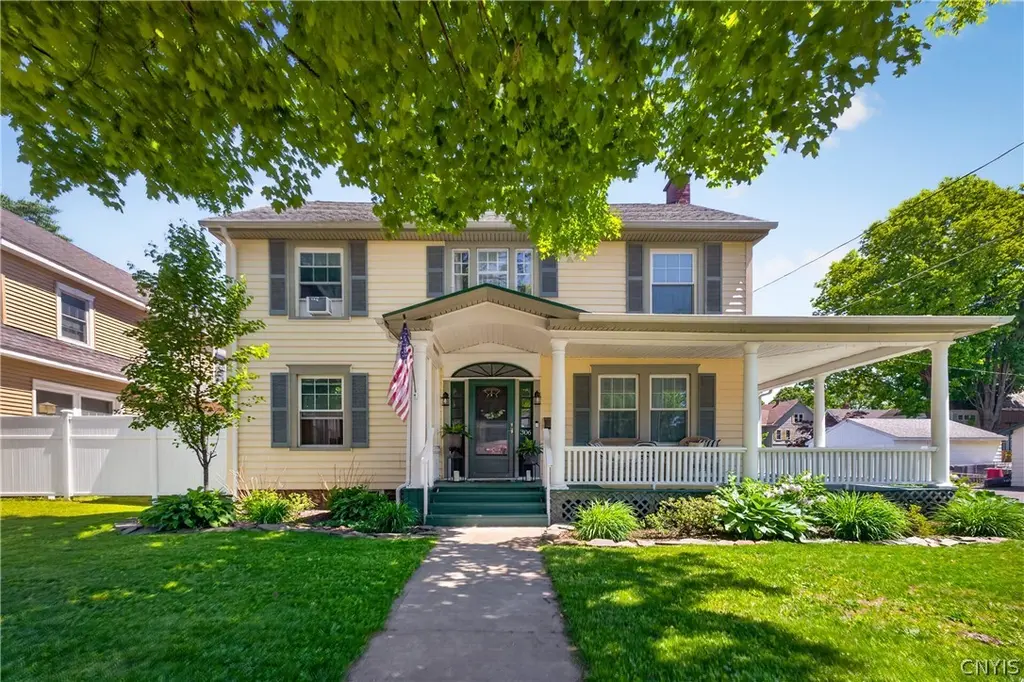
306 Elm St · Rome, NY
Flood risk 1/10 · Minimal
- FEMA flood zone
- X (unshaded)
- Chance of flooding over 30 yrs
- 0.0%
- Est. flood insurance / yr
- $473 – $860
Fire risk 2/10 · Minimal
- Est. fire insurance / yr
- $691 – $1,283
Heat risk 3/10 · Minor
- Hot days now (above 94°F)
- 7 days/yr
- Hot days in 30 yrs
- 17 days/yr
Wind risk 1/10 · Minimal
- Chance of severe wind over 30 yrs
- 0.0%
Air-quality risk 2/10 · Minimal
- Unhealthy air days now
- 0 days/yr
- Unhealthy air days in 30 yrs
- 1 days/yr
Risk factors via First Street. Map © Google.
Why this score? — see what drove the D+ grade
The composite is a weighted blend of 9 inputs, each scored 0–100. Each bar is that input's sub-score; the figure is the points it added to the 100-point composite (weight × sub-score).
- Cash flow +20.6/30.0
- DSCR +6.5/10.0
- ARV discount +5.7/15.0
- 1% rule +5.2/10.0
- Schools +3.5/10.0
- Livability +3.2/5.0
- Rent growth +2.5/5.0
- Condition / age +2.5/5.0
- Appreciation +0.0/10.0
$269,900
🖨 Deal sheet 📄 Offer letter ✓ Due diligence
Listing remarks MLS
A GREAT BUY with nearly 2400 sq ft of living space, PLUS finished 3rd floor and basement space!! Roof & Vinyl siding (2010), BRAND NEW GUTTERS (Sept 2019), Updated 200 amp service (2018), updated high efficiency forced air gas furnace, updated bath, many vinyl replacement windows throughout, fresh interior paint! Hardwoods under all existing flooring. Gorgeous leaded glass built-ins & SO MUCH character throughout the home. Charming wrap around front porch & new deck out back. 2 stall garage!
Key facts
- New flooring
- Recessed lighting
- 5,663 sq ft lot
Tags
Property features AI
Exterior
- Parking: Detached garage with electricity; 2 garage spaces
- Utilities: Electricity connected (circuit breakers); Public water connected; Sewer connected; High-speed internet available
- Home design: 2 stories; Resale property
- Construction: Vinyl siding; Blown-in insulation; Asphalt shingle roof; Stone foundation; Built existing (year built details: existing)
- Exterior features: Blacktop driveway; Fully fenced yard; Covered porch
Interior
- Kitchen: Gas cooktop; Microwave; Dishwasher; Refrigerator
- Bedrooms: Total rooms: 9 (includes recreation, bonus room, basement)
- Flooring: Carpet; Hardwood; Varies
- Bathrooms: 1 full bathroom; 1 half bathroom; 1 main-level bathroom
- Heating & cooling: Gas forced-air heating
- Interior features: Leaded glass and thermal windows; Attic; Separate/formal dining room; Country kitchen; Natural woodwork
- Laundry & utility: Washer; Dryer; Gas water heater
Neighborhood map
What this means for you Summary
Snapshot
- This is a 4-bed/2.0-bath single-family listed at $270k.
Deal economics
- At list price, monthly cash flow is $359 ($4k/yr) — positive.
- The deal already cash-flows at list — no discount required.
- Meets the 1% rule at list price ($3k rent vs $270k).
- Cap rate 7.9% vs local median 5.6% in Rome — top-decile yield for the area; either an underpriced asset or a hidden risk that comps aren't pricing in. Stress-test before assuming the spread holds.
Location & tenants
- Location reads 64/100 on livability (#722 in NY) — a middle-class / working-renter tenant base. Strengths: cost of living A+, housing A+; Watch: health & safety C-, schools F, amenities F.
- Rome City School District (town): math 35% / reading 46% proficiency, ranked #516 of 590 in NY (top 88%) — families likely to look elsewhere, expect single-tenant / working-renter base with shorter leases.
- Market conditions: 272 active listings in the ZIP; 1 comparable units currently listed for rent nearby; 204 units permitted in Oneida County in 2024 (68 in 5+ unit buildings).
Forward outlook
- Local home prices are declining (-3.0%/yr); year-one equity from $2k of loan paydown is wiped out by about $8k of value loss. Plan a longer hold.
- Oneida County population projected at -12% by 2050 — secular population decline; favor cash flow + early exit over multi-decade hold.
Negotiation context
- Only 12 days on market — expect competitive offers; lowballing is unlikely to land.
- 4 sale attempts since 25y ago with the ask held roughly flat each time — persistent listings suggest the price (not the market) is what's stuck; bring a comps-based counter.
- Current owner paid $132k; list at $270k implies a 104% gain — meaningful room to come down on a strong offer.
Risks & watch-outs
- Watch-outs: built in 1900 — expect roof / HVAC / electrical / plumbing capex.
Questions for the listing agent
- Built in 1900 — when were the roof, HVAC, electrical panel, plumbing, and water heater last replaced?
- Is there a deadline driving the sale (1031 exchange, divorce, estate, relocation)? That informs how much negotiation room exists.
- Schools are F-rated, which usually means shorter tenancies and higher turnover. Who's the typical renter profile here, and what's been the actual vacancy rate?
- The area grade is low — what's the realistic commute time and amenity access for the typical tenant pool here? Any planned neighborhood developments (good or bad) we should know about?
- What's the average days-on-market for RENTAL listings here right now (not sales)? A rising rental-DOM trend means longer vacancies and softer asking-rent achievability than the comps imply.
- What's the recent tenant-quality profile in this submarket — average credit score on applications, eviction rate, late-payment / NSF rate, and stable-employment percentage? A property-management company in the area should have these aggregated.
- How much new for-sale + rental construction is in the pipeline within 1–3 miles? Heavy new supply typically softens prices + rents 12–24 months out; constrained supply supports both.
Investment metrics
- 1% rule
- 1.02% ✓
- Cap rate
- 7.89%
- Cash-on-cash
- 5.70%
- DSCR
- 1.25
- GRM
- 8.2
CMA / ARV
- ARV (on-the-fly)
- $259,420
- Comps found
- 12
Show comp detail 12 sales within ~0.75 mi
| Address | Dist | Beds/Ba | Sqft | Sold | Price | $/sf | Match |
|---|---|---|---|---|---|---|---|
| 105 W Garden St | 0.23mi | 4/2.0 | 2,368 (-0%) | 5mo | $235,000 | $99 | 84 |
| 702 N Madison St | 0.07mi | 5/2.5 (+1) | 2,502 (+5%) | 11mo | $212,000 | $85 | 72 |
| 528 William St | 0.37mi | 4/2.0 | 2,184 (-8%) | 6mo | $115,000 | $53 | 64 |
| 207 W Sycamore St | 0.57mi | 4/2.5 | 2,362 (-1%) | 15mo | $430,000 | $182 | 58 |
| 710 N James St | 0.29mi | 4/1.5 | 2,208 (-7%) | 17mo | $110,000 | $50 | 58 |
| 1008 N Madison St | 0.36mi | 3/1.5 (-1) | 2,086 (-12%) | 3mo | $300,000 | $144 | 53 |
| 605 W Liberty St | 0.68mi | 5/2.0 (+1) | 2,445 (+3%) | 7mo | $90,000 | $37 | 53 |
| 1407 N George St | 0.73mi | 4/2.5 | 2,261 (-5%) | 12mo | $450,000 | $199 | 45 |
| 722 Laurel St | 0.57mi | 4/2.0 | 2,173 (-9%) | 16mo | $280,000 | $129 | 45 |
| 1407 N James St | 0.66mi | 4/2.0 | 2,100 (-12%) | 10mo | $227,900 | $109 | 41 |
| 911 Franklyn St | 0.38mi | 5/1.0 (+1) | 2,080 (-13%) | 15mo | $160,000 | $77 | 40 |
| 1205 N James St | 0.56mi | 3/1.5 (-1) | 2,037 (-14%) | 6mo | $257,500 | $126 | 38 |
Match score weights: distance 35% · size 25% · config 20% · recency 20%. Top-matched comps best support the ARV.
Projected returns pro-forma
-3.0% appreciation · 3.0% rent growth · sell at horizon
- IRR
- -7.5%
- Equity multiple
- 0.72×
- Total profit
- $-20,868
- Equity at exit
- $40,243
- IRR
- 2.1%
- Equity multiple
- 1.15×
- Total profit
- $11,301
- Equity at exit
- $23,336
Cash invested: $75,572 (down + closing). Projections, not guarantees.
Landlord ↔ Tenant lean methodology
- Overall (STATE)
- 15 Strongly Tenant-Friendly
- State New York
- 15 Strongly Tenant-Friendly · D+10
- County
- — inherits STATE
- City
- — inherits STATE
ZIP-level market 13440
- Home prices YoY
- -8.0%
- Active inventory
- 272
- Price-to-rent
- 8.2×
Monthly cashflow live
- Estimated rent
- $2,750 medium interval (Pro) →
- Mortgage (P&I)
- −$1,415
- Tax from tax record
- −$286 /mo · $3,429/yr
- Insurance
- −$112
- HOA
- −$0
- Vacancy / Maint / Mgmt
- −$578
- Net cashflow
- $359
Break-even live
UW: 25.0% down · 7.5% · 30yr · 1.5% tax · 5.0% vac · 8.0% maint · 8.0% mgmt
Financing live
Cash to close
- Down payment
- $67,475
- Closing costs
- $8,097
- Reserves months
- —
- Total cash needed
- —
Loan-product check · same deal, 3 products live
Conventional
25% down · 7.5% · 30yr
- Down + closing
- —
- Monthly P&I
- —
- Monthly cashflow
- —
- DSCR
- —
- Eligible?
- —
Personal DTI + credit; lowest rate.
DSCR
20% down · 8.5% · 30yr
- Down + closing
- —
- Monthly P&I
- —
- Monthly cashflow
- —
- DSCR
- —
- Eligible?
- —
No personal income docs; deal must DSCR.
Hard money
10% down · 12.0% · 12mo
- Down + closing
- —
- Monthly P&I
- —
- Monthly cashflow
- —
- DSCR
- —
- Eligible?
- —
Short-term bridge; refi at stabilization.
Rent comps 1 comps
| Address | Beds | Baths | Sqft | Rent | $/sqft | DOM | Units | Dist |
|---|---|---|---|---|---|---|---|---|
| 251 Liam Ln Unit 251 Rome, NY | 3.0 | 2.0 | 1577 | $2,750 | $1.74 | 44d | 1 | 1.26mi |
Listing history 11 events
-
2026-06-17status $269,900 Pending 12 DOM
-
2026-06-17days on market $269,900 Active Under Contract 12 DOM
-
2026-06-16days on market $269,900 Active Under Contract 11 DOM
-
2026-06-15days on market $269,900 Active Under Contract 10 DOM
-
2026-06-13days on market $269,900 Active Under Contract 8 DOM
-
2026-06-12statusdays on market $269,900 Active Under Contract 7 DOM
-
2026-06-09days on market $269,900 Active 4 DOM
-
2026-06-08days on market $269,900 Active 3 DOM
-
2026-06-07days on market $269,900 Active 2 DOM
-
2026-06-07remarks 699-char remark
-
2026-06-07$269,900 Active 1 DOM
ⓘ Source: listings_history table (triggers on properties + properties_extension) + one-shot
backfill from property_details.listing_events for pre-trigger history.
Tax reassessment forecast NY · Partial reset (capped growth)
- Current annual tax
- $3,429 · $286/mo
- Projected year-2 tax
- $3,995 · $333/mo
- Expected delta
- +$566/yr (+$47/mo · 16.5%)
ⓘ Screening estimate from a state-policy table — verify with the county assessor before closing.
Climate risk First Street
- Flood 1/10 Low FEMA zone X (unshaded) · 0% chance over 30 yrs
- Wildfire 2/10 Low
- Heat 3/10 Moderate 7 d/yr ≥94°F today · 17 d/yr by 30 yrs out
- Wind 1/10 Low 0% chance of damaging wind over 30 yrs
- Air quality 2/10 Low 0 unhealthy d/yr today · 1 by 30 yrs out
Nearby sold comps map
Loading sold comps map…
Walkable amenities ~0.75 mi
Loading nearby amenities…
Taxation est. · year 1
- Rental income
- $33,000
- − Mortgage interest
- −$15,119
- − Property taxes
- −$3,429
- − Insurance
- −$1,350
- − Repairs & maintenance
- −$2,640
- − Management
- −$2,640
- − Depreciation
- −$7,852
- Taxable loss
- −$29
- Est. tax savings @ 24.0%
- +$7
- After-tax cash flow
- $4,314/yr
For passive investors: Depreciation is non-cash, so a rental often shows a tax loss while cash-flowing — sheltering income. Rental losses are passive: they offset passive income freely, and up to $25,000/yr can offset ordinary (W-2) income if you actively participate and your MAGI is under $100k (phasing out to $0 by $150k); unused losses carry forward. On sale, claimed depreciation is recaptured at up to 25%, and gains may owe capital-gains tax (a 1031 exchange can defer both). Figures are a year-1 estimate at your 24.0% rate — not tax advice; consult a CPA.
Schools (NCES district)
- District
- Rome City School District
- NCES district ID
- 3624900
- Math proficiency
- 35% ▼ -4.00%
- Reading proficiency
- 46% ▲ 10.00%
- Median HH income
- $46,406
- Composite
- 34.52/100
- National rank
- #5178
- State rank
- #516 of 590 in NY
Livability — Rome
- Score
- 64/100
- State rank
- #722
- US rank
- #13676
Category grades
Schools grade is shown separately in the Schools card above.
Census & demographics
- Census place
- Rome, NY
- City population
- 41,418
- Population (ZIP)
- 41,273
Population outlook (Oneida County) Hauer SSP2
- Today (2025)
- 225,223 people
- By 2030
- 220,384 · -2.1%
- By 2040
- 209,071 · -7.2%
- By 2050
- 197,920 · -12.1%
- By 2075
- 175,541 · -22.1%
- By 2100
- 148,491 · -34.1%
Race, ethnicity, and origin ACS 2023
- Neighborhood character
- Predominantly White (82%)
- Race & ethnicity
- White 82% Hispanic / Latino 7% Two or more races 6% Black 4% Asian 1%
- Hispanic origin (detail)
- Mexican 1% Puerto Rican 4%
- Common ancestry
- Romanian 9% Lithuanian 4% Slovak 1%
- Foreign-born
- 3% · Canada, China
- Languages at home
- 94% English-only · Spanish 3% Other Indo-European 1%
Political lean MEDSL · Oneida
- 2024 margin
- Strong R (+21.3) · D 39.4% · R 60.6%
- 2008→2024 swing
- -15.2pp toward R · 2008: -6.1pp · 2024: -21.3pp
- All cycles
- 2024: R+21.3 2020: R+15.5 2016: R+21.1 2012: R+5.3 2008: R+6.1
Not yet ingested
- Civics
- —
Market trends
- HPI YoY
- ▼ -29.58%
- Current HPI
- 339.3589
- Rent YoY
- —
- Metro
- —
- State GDP YoY
- ▲ 2.60%
- F500 in state
- 92
Industry mix (Fortune 500 HQ in NY)
| Industry | F500 HQs | Revenue |
|---|---|---|
| Financial Services | 10 | $950B |
|
||
| Consumer Goods | 9 | $162B |
|
||
| Insurance | 4 | $225B |
|
||
| Telecommunications | 2 | $144B |
|
||
| Pharmaceuticals | 2 | $112B |
|
||
| Media / Entertainment | 2 | $69B |
|
||
Price history
+184.1% since first listed10 events — show timeline
- 2026-06-05 Listed $269,900 CNYIS
- 2020-01-31 Sold (Public Records) $132,000 Public Records
- 2020-01-31 Sold (Public Records) $132,000 Public Records
- 2020-01-31 Sold (MLS) $132,000 CNYIS
- 2019-08-20 Listed $139,900 CNYIS
- 2002-07-01 Sold (MLS) $89,900 CNYIS
- 2002-06-27 Sold (Public Records) $89,900 Public Records
- 2002-04-05 Listed $89,900 CNYIS
- 2002-04-01 Listing Removed — CNYIS
- 2001-08-13 Listed $95,000 CNYIS
Property tax history
+2.2%/yrLatest (2025): $3,429 · +0.3% YoY. Source: county tax records.
Cash-flow waterfall
monthlySold comps — $/sqft
last 12 mo · ≤1 miLoading sold comps…