6406 Calhoun Rd · Houston, TX
Flood risk No data
- FEMA flood zone
- —
- Chance of flooding over 30 yrs
- —
- Est. flood insurance / yr
- —
Fire risk No data
- Est. fire insurance / yr
- —
Heat risk No data
- Hot days now (above threshold)
- —
- Hot days in 30 yrs
- —
Wind risk No data
- Chance of severe wind over 30 yrs
- —
Air-quality risk No data
- Unhealthy air days now
- —
- Unhealthy air days in 30 yrs
- —
Risk factors via First Street. Map © Google.
Why this score? — see what drove the D- grade
The composite is a weighted blend of 9 inputs, each scored 0–100. Each bar is that input's sub-score; the figure is the points it added to the 100-point composite (weight × sub-score).
- ARV discount +11.3/15.0
- Cash flow +7.3/30.0
- Condition / age +4.0/5.0
- Livability +3.7/5.0
- Rent growth +3.0/5.0
- Schools +2.7/10.0
- 1% rule +2.1/10.0
- DSCR +1.5/10.0
- Appreciation +0.0/10.0
$260,000
🖨 Deal sheet 📄 Offer letter ✓ Due diligence
Listing remarks MLS
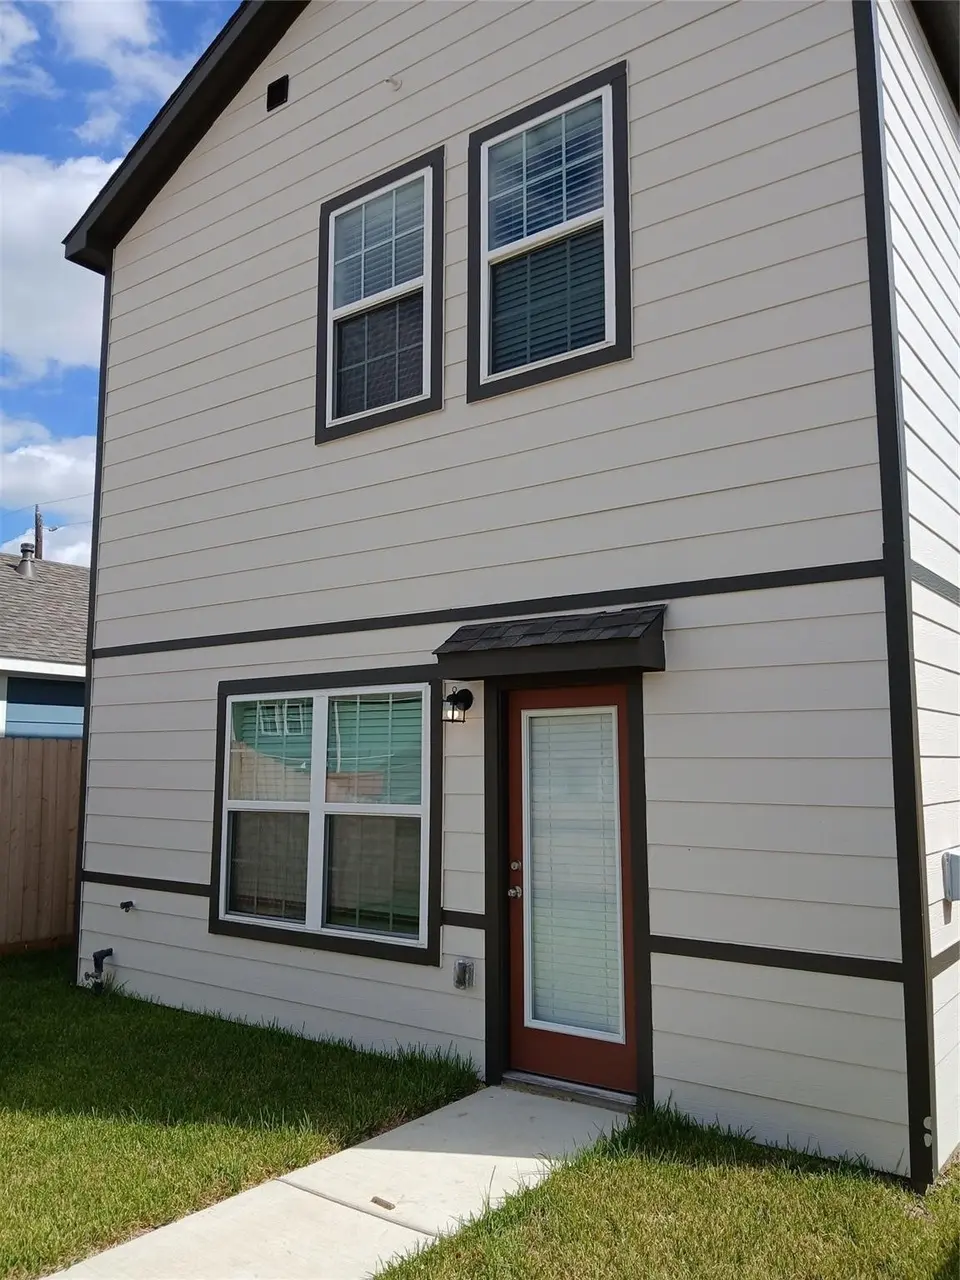
New Construction! Wonderful 2-story, 3-bedroom, 2 1/2 bath home with a covered front porch. Open-concept floor plan with luxury vinyl plank flooring throughout the 1st floor. The kitchen features painted shaker-style cabinetry, stainless steel appliances, tile backsplash, an undermount sink & an island with seating space. The primary suite has a dual-sink vanity & walk-in closet. Fenced front and back yard. Ideally located with easy access to the Med Center, Museum District, downtown & much more. This home is Energy Star Certified & has a 10-year warranty!
Key facts
- Covered front porch
- Undermount sink
- Tile backsplash
Tags
Neighborhood map
What this means for you Summary
Snapshot
- This is a 3-bed/2.5-bath single-family listed at $260k. Condition is rated good.
Deal economics
- At list price, monthly cash flow is $-343 ($-4k/yr) — negative.
- To cash-flow at today's rent, offer at most $210k (19.1% below list).
- To meet the 1% rule (rent ≥ 1% of price), the offer needs to be $185k (29.0% below list).
- Recommended offer: $185k (29.0% below list) — sets the bar for 1% rule.
- Cap rate 4.7% vs local median 3.2% in Houston — top-decile yield for the area; either an underpriced asset or a hidden risk that comps aren't pricing in. Stress-test before assuming the spread holds.
Location & tenants
- Location reads 74/100 on livability (#184 in TX, #4,771 nationally) — a middle-class / working-renter tenant base. Strengths: amenities A+, cost of living A+, housing A+; Watch: schools D, crime F.
- Houston ISD (urban): math 27% / reading 35% proficiency, ranked #593 of 826 in TX (top 72%) — families likely to look elsewhere, expect single-tenant / working-renter base with shorter leases; 71% free/reduced lunch — lower-income household profile, screen leases tightly.
- Market conditions: Rents rising (+2.2%/yr); 467 active listings in the ZIP; 40 comparable units currently listed for rent nearby; rentals at typical pace (median 22d on market — plan ~3-4 weeks tenant-placement turnaround); 40% of comp listings sitting > 30 days — soft ceiling on asking rent; 29,883 units permitted in Harris County in 2024 (8,621 in 5+ unit buildings).
- At $1,847/mo this rent would consume 49% of the median local household income ($46k/yr) (locally 2532% of renters already pay >50% of income on rent) — very limited rent-growth headroom before tenants either downsize or default.
Forward outlook
- Local home prices are declining (-3.0%/yr); year-one equity from $2k of loan paydown is wiped out by about $8k of value loss. Plan a longer hold.
- Harris County population projected at +47% by 2050 — long-run rental-demand tailwind backs the buy-and-hold thesis.
Negotiation context
- It's been on market 101 days — a 9% lower offer ($237k) is reasonable based on typical stale-listing flexibility.
Questions for the listing agent
- What do current leases actually rent for vs. the listed asking? Can we see a recent rent roll and the last 12 months of T-12 income?
- It's been on market 101 days. Have you received any prior offers? Is the seller open to a 29% concession, seller financing, or rate buy-down credit?
- What does the HOA fee cover, when was the last increase, and are there any pending special assessments or reserve-fund shortfalls?
- Why hasn't it sold? Are there any deal-killer items the seller is aware of (foundation, flood, title, zoning, code violations)?
- Is there a deadline driving the sale (1031 exchange, divorce, estate, relocation)? That informs how much negotiation room exists.
- Schools are D-rated, which usually means shorter tenancies and higher turnover. Who's the typical renter profile here, and what's been the actual vacancy rate?
- Crime grade is F in this area — have there been break-ins, vandalism, or insurance claims at this property in the last 3 years? What carrier currently insures it and at what premium?
- The area grade is low — what's the realistic commute time and amenity access for the typical tenant pool here? Any planned neighborhood developments (good or bad) we should know about?
- What's the average days-on-market for RENTAL listings here right now (not sales)? A rising rental-DOM trend means longer vacancies and softer asking-rent achievability than the comps imply.
- What's the recent tenant-quality profile in this submarket — average credit score on applications, eviction rate, late-payment / NSF rate, and stable-employment percentage? A property-management company in the area should have these aggregated.
- How much new for-sale + rental construction is in the pipeline within 1–3 miles? Heavy new supply typically softens prices + rents 12–24 months out; constrained supply supports both.
Investment metrics
- 1% rule
- 0.71% ✗
- Cap rate
- 4.71%
- Cash-on-cash
- -5.65%
- DSCR
- 0.75
- GRM
- 11.7
CMA / ARV
- ARV (median comp)
- $284,309
- List price
- $260,000
- Delta
- -8.55%
- Verdict
- FAIR
- Comps
- 20 within 1.0 mi
Show comp detail 12 sales within ~0.75 mi
| Address | Dist | Beds/Ba | Sqft | Sold | Price | $/sf | Match |
|---|---|---|---|---|---|---|---|
| 6326 Calhoun Rd | 0.03mi | 3/2.5 | 1,453 (0%) | 7mo | $299,000 | $206 | 93 |
| 4715 Ward St | 0.40mi | 3/2.5 | 1,454 (+0%) | 7mo | $230,000 | $158 | 76 |
| 6625 Goforth St | 0.40mi | 3/1.0 | 1,489 (+2%) | 4mo | $142,000 | $95 | 68 |
| 4902 Winfree Dr | 0.66mi | 3/2.0 | 1,511 (+4%) | 2mo | $169,500 | $112 | 59 |
| 4826 Culmore Dr | 0.69mi | 3/2.0 | 1,501 (+3%) | 3mo | $279,000 | $186 | 58 |
| 6832 Goforth St | 0.56mi | 3/1.0 | 1,392 (-4%) | 5mo | $98,000 | $70 | 56 |
| 5126 Hull St | 0.51mi | 3/2.0 | 1,306 (-10%) | 3mo | $220,000 | $168 | 55 |
| 5210 Enyart St | 0.62mi | 3/2.5 | 1,587 (+9%) | 5mo | $239,999 | $151 | 52 |
| 5006 Idaho St | 0.55mi | 4/2.0 (+1) | 1,308 (-10%) | 3mo | $225,000 | $172 | 48 |
| 6906 England St | 0.68mi | 3/2.5 | 1,600 (+10%) | 4mo | $309,900 | $194 | 48 |
| 6908 England St | 0.68mi | 3/2.5 | 1,600 (+10%) | 5mo | $309,900 | $194 | 47 |
| 4611 Idaho St | 0.48mi | 4/2.0 (+1) | 1,640 (+13%) | 4mo | $257,000 | $157 | 46 |
Match score weights: distance 35% · size 25% · config 20% · recency 20%. Top-matched comps best support the ARV.
Projected returns pro-forma
-3.0% appreciation · 2.17% rent growth · sell at horizon
- IRR
- -26.9%
- Equity multiple
- 0.10×
- Total profit
- $-65,464
- Equity at exit
- $38,767
- IRR
- -27.5%
- Equity multiple
- -0.25×
- Total profit
- $-91,168
- Equity at exit
- $22,480
Cash invested: $72,800 (down + closing). Projections, not guarantees.
Landlord ↔ Tenant lean methodology
- Overall (STATE)
- 87 Strongly Landlord-Friendly
- State Texas
- 87 Strongly Landlord-Friendly · R+5
- County
- — inherits STATE
- City
- — inherits STATE
ZIP-level market 77021
- Home prices YoY
- -23.6%
- Rents YoY
- 2.2%
- Active inventory
- 467
- Price-to-rent
- 11.7×
Monthly cashflow live
- Estimated rent
- $1,847 high interval (Pro) →
- Mortgage (P&I)
- −$1,363
- Tax est. 1.5%
- −$325 /mo · $3,900/yr
- Insurance
- −$108
- HOA
- −$5
- Vacancy / Maint / Mgmt
- −$388
- Net cashflow
- $-343
Break-even live
UW: 25.0% down · 7.5% · 30yr · 1.5% tax · 5.0% vac · 8.0% maint · 8.0% mgmt
Financing live
Cash to close
- Down payment
- $65,000
- Closing costs
- $7,800
- Reserves months
- —
- Total cash needed
- —
Loan-product check · same deal, 3 products live
Conventional
25% down · 7.5% · 30yr
- Down + closing
- —
- Monthly P&I
- —
- Monthly cashflow
- —
- DSCR
- —
- Eligible?
- —
Personal DTI + credit; lowest rate.
DSCR
20% down · 8.5% · 30yr
- Down + closing
- —
- Monthly P&I
- —
- Monthly cashflow
- —
- DSCR
- —
- Eligible?
- —
No personal income docs; deal must DSCR.
Hard money
10% down · 12.0% · 12mo
- Down + closing
- —
- Monthly P&I
- —
- Monthly cashflow
- —
- DSCR
- —
- Eligible?
- —
Short-term bridge; refi at stabilization.
Rent comps 40 comps
| Address | Beds | Baths | Sqft | Rent | $/sqft | DOM | Units | Dist |
|---|---|---|---|---|---|---|---|---|
| 6532 Weston St Unit A Houston, TX | 3.0 | 3.0 | 1484 | $2,200 | $1.48 | 18d | 1 | 0.24mi |
| 6528 Weston St Unit A Houston, TX | 3.0 | 3.0 | 1484 | $2,200 | $1.48 | 43d | 1 | 0.24mi |
| 4705 Idaho St Houston, TX | 3.0 | 2.5 | 1664 | $2,500 | $1.50 | 17d | 1 | 0.48mi |
| 5918 Schroeder Rd Houston, TX | 1.0–2.0 | 1.0 | 850 | $1,000 | $1.18 | 43d | 1 | 0.49mi |
| 5924 Schroeder Rd Houston, TX | 2.0 | 1.0 | 900 | $895 | $0.99 | 43d | 1 | 0.49mi |
| 5924 Schroeder Rd Houston, TX | 2.0 | 1.0 | 900 | $895 | $0.99 | 22d | 1 | 0.49mi |
| 5123 Dewberry St Houston, TX | 4.0 | 2.0 | 1391 | $2,400 | $1.73 | 43d | 1 | 0.60mi |
| 5813 England St Unit A Houston, TX | 3.0 | 2.5 | 1473 | $2,195 | $1.49 | 4d | 1 | 0.60mi |
| 5116 Griggs Rd Houston, TX | 3.0 | 2.0 | 1131 | $1,316 | $1.16 | 43d | 1 | 0.74mi |
| 5154 Griggs Rd Unit CAVE Houston, TX | 2.0 | 2.0 | 1322 | $1,420 | $1.07 | 3d | 1 | 0.78mi |
| 7032 Conley St Houston, TX | 3.0 | 2.0 | 1220 | $2,850 | $2.34 | 43d | 1 | 0.78mi |
| 4907 Culmore Dr Houston, TX | 4.0 | 2.0 | 1800 | $2,700 | $1.50 | 16d | 1 | 0.79mi |
| 4942 Bataan Rd Unit 77033 Houston, TX | 4.0 | 2.0 | 1350 | $1,800 | $1.33 | 43d | 1 | 0.83mi |
| 4722 Old Spanish Trl Unit B301 Houston, TX | 2.0 | 2.0 | 1027 | $1,695 | $1.65 | 44d | 1 | 0.92mi |
| 5317 Chennault Rd Unit A Houston, TX | 3.0 | 2.5 | 1608 | $1,999 | $1.24 | 43d | 1 | 0.96mi |
| 4907 Marietta Ln Unit 1494902P Houston, TX | 3.0 | 2.0 | 1593 | $3,278 | $2.06 | 13d | 1 | 0.97mi |
| 5610 Royal Palms St Houston, TX | 2.0 | 1.0 | 900 | $950 | $1.06 | 24d | 1 | 1.03mi |
| 5537 Bataan Rd Houston, TX | 2.0 | 1.0 | 880 | $1,300 | $1.48 | 43d | 1 | 1.04mi |
| 7321 Conley St Unit B Houston, TX | 3.0 | 2.0 | 1501 | $2,025 | $1.35 | 20d | 1 | 1.05mi |
| 7321 Conley St Unit A Houston, TX | 3.0 | 2.5 | 1869 | $2,025 | $1.08 | 20d | 1 | 1.05mi |
| 5514 Griggs Rd Unit 2162 Houston, TX | 2.0 | 2.0 | 1322 | $1,190 | $0.90 | 5d | 1 | 1.05mi |
| 5514 Griggs Rd Unit 422 Houston, TX | 2.0 | 2.0 | 1322 | $1,190 | $0.90 | 7d | 1 | 1.05mi |
| 5514 Griggs Rd Unit 5571 Houston, TX | 2.0 | 2.0 | 1322 | $1,214 | $0.92 | 10d | 1 | 1.05mi |
| 5514 Griggs Rd Unit 2187 Houston, TX | 2.0 | 2.0 | 1322 | $1,182 | $0.89 | 2d | 1 | 1.05mi |
| 5514 Griggs Rd Houston, TX | 2.0 | 2.0 | 1322 | $1,210 | $0.92 | 43d | 1 | 1.06mi |
| 5514 Griggs Rd Unit 2047 Houston, TX | 2.0 | 2.0 | 1322 | $1,214 | $0.92 | 3d | 1 | 1.07mi |
| 5514 Griggs Rd Unit 2047 Houston, TX | 2.0 | 2.0 | 1322 | $1,225 | $0.93 | 11d | 1 | 1.07mi |
| 7358 Guadalcanal Rd Houston, TX | 3.0 | 3.0 | 1768 | $2,195 | $1.24 | 43d | 1 | 1.08mi |
| 3644 Griggs Rd Unit 1047940P Houston, TX | 3.0 | 2.5 | 1399 | $2,161 | $1.54 | 2d | 1 | 1.10mi |
| 5520 Griggs Rd Houston, TX | 2.0 | 2.0 | 1322 | $1,241 | $0.94 | 43d | 1 | 1.13mi |
| 5520 Griggs Rd Houston, TX | 2.0 | 2.0 | 1322 | $1,241 | $0.94 | 22d | 1 | 1.13mi |
| 5101 Martin Luther King Blvd Unit MO54 Houston, TX | 2.0 | 2.0 | 1322 | $1,210 | $0.92 | 12d | 1 | 1.17mi |
| 5835 Southmont St Houston, TX | 3.0 | 2.0 | 1200 | $1,700 | $1.42 | 43d | 1 | 1.18mi |
| 3560 Dixie Dr Unit 3617 Houston, TX | 2.0 | 2.0 | 1322 | $1,435 | $1.09 | 43d | 1 | 1.18mi |
| 3560 Dixie Dr Unit 3597 Houston, TX | 2.0 | 2.0 | 1322 | $1,434 | $1.08 | 10d | 1 | 1.18mi |
| 3560 Dixie Dr Unit 2162 Houston, TX | 2.0 | 2.0 | 1322 | $1,410 | $1.07 | 5d | 1 | 1.18mi |
| 3560 Dixie Dr Apt 422 Houston, TX | 2.0 | 2.0 | 1322 | $1,410 | $1.07 | 7d | 1 | 1.18mi |
| 3560 Dixie Dr Unit 2165 Houston, TX | 2.0 | 2.0 | 1322 | $1,402 | $1.06 | 2d | 1 | 1.18mi |
| 3846 Seabrook St Houston, TX | 3.0 | 3.5 | 1833 | $2,300 | $1.25 | 43d | 1 | 1.21mi |
| 4977 Martin Luther King Blvd Houston, TX | 4.0 | 4.0 | 1396 | $870 | $0.62 | 24d | 1 | 1.22mi |
HOA detail
- Monthly dues
- $5 · $60/yr
Listing history 12 events
-
2026-06-18days on market $260,000 Active 101 DOM
-
2026-06-17days on market $260,000 Active 100 DOM
-
2026-06-16days on market $260,000 Active 99 DOM
-
2026-06-15days on market $260,000 Active 98 DOM
-
2026-06-13days on market $260,000 Active 96 DOM
-
2026-06-10days on market $260,000 Active 92 DOM
-
2026-06-08days on market $260,000 Active 91 DOM
-
2026-06-07days on market $260,000 Active 90 DOM
-
2026-06-04days on market $260,000 Active 87 DOM
-
2026-06-01days on market $260,000 Active 84 DOM
-
2026-05-31days on market $260,000 Active 83 DOM
-
2026-03-09$260,000 Active 578-char remark
Show marketing remark (578 chars)
New Construction! Wonderful 2-story, 3-bedroom, 2 1/2 bath home with a covered front porch. Open-concept floor plan with luxury vinyl plank flooring throughout the 1st floor. The kitchen features painted shaker-style cabinetry, stainless steel appliances, tile backsplash, an undermount sink & an island with seating space. The primary suite has a dual-sink vanity & walk-in closet. Fenced front and back yard. Ideally located with easy access to the Med Center, Museum District, downtown & much more. This home is Energy Star Certified & has a 10-year warranty!
ⓘ Source: listings_history table (triggers on properties + properties_extension) + one-shot
backfill from property_details.listing_events for pre-trigger history.
Nearby sold comps map
Loading sold comps map…
Walkable amenities ~0.75 mi
Loading nearby amenities…
Taxation est. · year 1
- Rental income
- $22,162
- − Mortgage interest
- −$14,564
- − Property taxes
- −$3,900
- − Insurance
- −$1,300
- − Repairs & maintenance
- −$1,773
- − Management
- −$1,773
- − HOA
- −$60
- − Depreciation
- −$7,564
- Taxable loss
- −$8,772
- Est. tax savings @ 24.0%
- +$2,105
- After-tax cash flow
- $-2,009/yr
For passive investors: Depreciation is non-cash, so a rental often shows a tax loss while cash-flowing — sheltering income. Rental losses are passive: they offset passive income freely, and up to $25,000/yr can offset ordinary (W-2) income if you actively participate and your MAGI is under $100k (phasing out to $0 by $150k); unused losses carry forward. On sale, claimed depreciation is recaptured at up to 25%, and gains may owe capital-gains tax (a 1031 exchange can defer both). Figures are a year-1 estimate at your 24.0% rate — not tax advice; consult a CPA.
Condition & rehab AI · 1 photo
This Energy Star Certified home is in excellent condition with no visible repairs needed. It offers a good return on investment with updates that can significantly increase its value.
Value-add opportunities
- Both Paint exterior siding — Enhances curb appeal and can increase both resale and rental value.
- Both Replace front door — Improves curb appeal and can increase both resale and rental value.
- Both Upgrade landscaping — Enhances curb appeal and can increase both resale and rental value.
Renovation cost estimate screening
Value-add ROI direction
- Both Paint exterior siding — Enhances curb appeal and can increase both resale and rental value. ↑
- Both Replace front door — Improves curb appeal and can increase both resale and rental value. ↑
- Both Upgrade landscaping — Enhances curb appeal and can increase both resale and rental value. ↑
ⓘ Cost ranges are severity-bucket heuristics (US national rule-of-thumb). Get contractor quotes + a written scope before underwriting a rehab budget.
Schools (NCES district)
- District
- Houston ISD
- NCES district ID
- 4823640
- Math proficiency
- 27% ▼ -18.00%
- Reading proficiency
- 35% ▼ -6.00%
- Median HH income
- $46,054
- Composite
- 26.63/100
- National rank
- #7173
- State rank
- #593 of 826 in TX
Livability — Houston
- Score
- 74/100
- State rank
- #184
- US rank
- #4771
Category grades
Schools grade is shown separately in the Schools card above.
Census & demographics
- Census place
- Houston, TX
- County
- Harris County · 4,702,590 people
- City population
- 3,226,434
- Metro
- Houston-The Woodlands-Sugar Land, TX
- Population (ZIP)
- 26,153
- Household income
- $45,574
- Rent vs Own
- Severe rent burden
- 2532.0
Population outlook (Harris County) Hauer SSP2
- Today (2025)
- 5,571,493 people
- By 2030
- 6,089,821 · +9.3%
- By 2040
- 7,142,806 · +28.2%
- By 2050
- 8,185,864 · +46.9%
- By 2075
- 10,574,329 · +89.8%
- By 2100
- 12,109,958 · +117.4%
Race, ethnicity, and origin ACS 2023
- Neighborhood character
- Diverse neighborhood (Simpson 0.55)
- Race & ethnicity
- Black 62% Hispanic / Latino 22% Two or more races 12% White 10% Asian 2%
- Hispanic origin (detail)
- Mexican 15%
- Common ancestry
- Italian 1% Romanian 1% Lithuanian 1%
- Foreign-born
- 11% · Canada
- Languages at home
- 77% English-only · Spanish 19% French/Haitian/Cajun 1% Other Indo-European 1%
Political lean MEDSL · Harris
- 2024 margin
- Lean D (+5.5) · D 52.0% · R 46.4% · Other 1.6%
- 2008→2024 swing
- +3.9pp toward D · 2008: 1.6pp · 2024: 5.5pp
- All cycles
- 2024: D+5.5 2020: D+13.3 2016: D+12.4 2012: D+0.1 2008: D+1.6
Not yet ingested
- Civics
- —
Market trends
- HPI YoY
- ▼ -71.22%
- Current HPI
- 230.2869
- Rent YoY
- ▲ 2.17%
- Metro
- Houston-The Woodlands-Sugar Land, TX
- State GDP YoY
- ▲ 3.95%
- F500 in state
- 110
Industry mix (Fortune 500 HQ in TX)
| Industry | F500 HQs | Revenue |
|---|---|---|
| Energy | 16 | $1,198B |
|
||
| Technology | 5 | $198B |
|
||
| Engineering / Construction | 4 | $72B |
|
||
| Energy Services | 3 | $60B |
|
||
| Utilities | 3 | $41B |
|
||
| Healthcare | 2 | $330B |
|
||
Price history
1 event — show timeline
- 2026-03-09 Listed $260,000 HARMLS
Cash-flow waterfall
monthlySold comps — $/sqft
last 12 mo · ≤1 miLoading sold comps…