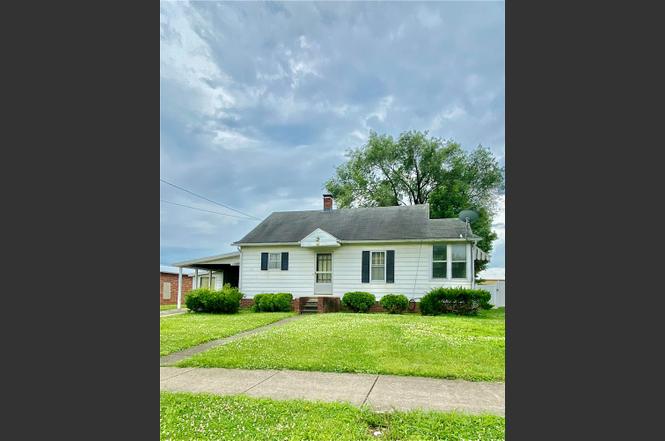
907 E Jefferson Ave · Effingham, IL
Flood risk 1/10 · Minimal
- FEMA flood zone
- X
- Chance of flooding over 30 yrs
- 0.0%
- Est. flood insurance / yr
- $473 – $860
Fire risk 1/10 · Minimal
- Est. fire insurance / yr
- $804 – $1,492
Heat risk 4/10 · Minor
- Hot days now (above 106°F)
- 7 days/yr
- Hot days in 30 yrs
- 21 days/yr
Wind risk 2/10 · Minimal
- Chance of severe wind over 30 yrs
- 1.0%
Air-quality risk 2/10 · Minimal
- Unhealthy air days now
- 1 days/yr
- Unhealthy air days in 30 yrs
- 2 days/yr
Risk factors via First Street. Map © Google.
Why this score? — see what drove the D- grade
The composite is a weighted blend of 9 inputs, each scored 0–100. Each bar is that input's sub-score; the figure is the points it added to the 100-point composite (weight × sub-score).
- Cash flow +13.2/30.0
- ARV discount +5.1/15.0
- DSCR +4.0/10.0
- Livability +3.9/5.0
- 1% rule +3.4/10.0
- Rent growth +2.5/5.0
- Condition / age +2.5/5.0
- Schools +1.9/10.0
- Appreciation +0.0/10.0
$137,500
🖨 Deal sheet 📄 Offer letter ✓ Due diligence
Listing remarks
Looking for a home to remodel to suit your needs, than this is the house for you. Hard wood flooring in all three bedrooms, living room and sun room gives this house character and a warm feeling. Add some paint to the walls and bring the feeling of cheer in. The sunroom is perfect for reading a good book with your morning coffee or unwinding in the evening with a cold drink. Carport is perfect for two vehicles. Garage has been converted into a shop. The back part of the shop needs repairs. There is a furnace in garage along with toilet and sink. Furnace in house is in working order. Water heater will need replaced and the compressor a/c condensing unit is out. Back yard has plenty of room f
Key facts
- Back yard
- Hard wood flooring
- Carport
Tags
Property features AI
Exterior
- Parking: Carport with 2 spaces
- Utilities: Public water; Public sewer
- Home design: Single-family residence; One story
- Construction: Aluminum siding construction; Shingle roof; One-level design
- Exterior features: Concrete road access; Shingle roof; Aluminum siding
Interior
- Kitchen: Range
- Bedrooms: Total of 6 rooms (includes bedrooms and living spaces)
- Bathrooms: 1 full bathroom
- Heating & cooling: Natural gas heating; Central air conditioning
- Interior features: Unfinished partial basement; Gas water heater
- Laundry & utility: Washer and Dryer
Neighborhood map
What this means for you Summary
Snapshot
- This is a 1-bed/1.0-bath single-family listed at $138k.
Deal economics
- At list price, monthly cash flow is $-1 ($-17/yr) — negative.
- To cash-flow at today's rent, offer at most $137k (0.2% below list).
- To meet the 1% rule (rent ≥ 1% of price), the offer needs to be $115k (16.0% below list).
- Recommended offer: $115k (16.0% below list) — sets the bar for 1% rule.
- Cap rate 6.3% vs local median 2.6% in Effingham — top-decile yield for the area; either an underpriced asset or a hidden risk that comps aren't pricing in. Stress-test before assuming the spread holds.
Location & tenants
- Location reads 78/100 on livability (#140 in IL, #2,564 nationally) — a middle-class / working-renter tenant base. Strengths: cost of living A+, housing A+, health & safety A+; Watch: schools D, amenities F.
- Effingham CUSD 40 (town): math 18% / reading 26% proficiency, ranked #387 of 620 in IL (top 62%) — low school quality limits family demand, transient renter base, plan for 1-2y turnover.
- Market conditions: 111 active listings in the ZIP; 27 units permitted in Effingham County in 2024 (0 in 5+ unit buildings).
Forward outlook
- Local home prices are declining (-3.0%/yr); year-one equity from $951 of loan paydown is wiped out by about $4k of value loss. Plan a longer hold.
- Effingham County population projected at -13% by 2050 — secular population decline; favor cash flow + early exit over multi-decade hold.
Negotiation context
- Only 4 days on market — expect competitive offers; lowballing is unlikely to land.
Risks & watch-outs
- Watch-outs: built in 1939 — expect roof / HVAC / electrical / plumbing capex.
Questions for the listing agent
- What do current leases actually rent for vs. the listed asking? Can we see a recent rent roll and the last 12 months of T-12 income?
- Built in 1939 — when were the roof, HVAC, electrical panel, plumbing, and water heater last replaced?
- Is there a deadline driving the sale (1031 exchange, divorce, estate, relocation)? That informs how much negotiation room exists.
- Schools are D-rated, which usually means shorter tenancies and higher turnover. Who's the typical renter profile here, and what's been the actual vacancy rate?
- The area grade is low — what's the realistic commute time and amenity access for the typical tenant pool here? Any planned neighborhood developments (good or bad) we should know about?
- What's the average days-on-market for RENTAL listings here right now (not sales)? A rising rental-DOM trend means longer vacancies and softer asking-rent achievability than the comps imply.
- What's the recent tenant-quality profile in this submarket — average credit score on applications, eviction rate, late-payment / NSF rate, and stable-employment percentage? A property-management company in the area should have these aggregated.
- How much new for-sale + rental construction is in the pipeline within 1–3 miles? Heavy new supply typically softens prices + rents 12–24 months out; constrained supply supports both.
Investment metrics
- 1% rule
- 0.84% ✗
- Cap rate
- 6.28%
- Cash-on-cash
- -0.04%
- DSCR
- 1.00
- GRM
- 9.9
CMA / ARV
- ARV (on-the-fly)
- $130,640
- Comps found
- 3
Show comp detail 3 sales within ~0.75 mi
| Address | Dist | Beds/Ba | Sqft | Sold | Price | $/sf | Match |
|---|---|---|---|---|---|---|---|
| 915 S Glenwood St | 0.58mi | 2/1.0 (+1) | 960 (+4%) | 12mo | $110,000 | $115 | 51 |
| 609 S 2nd St | 0.60mi | 2/1.0 (+1) | 844 (-8%) | 9mo | $120,000 | $142 | 46 |
| 509 E Gordon Ave | 0.43mi | 2/1.0 (+1) | 1,040 (+13%) | 10mo | $153,000 | $147 | 44 |
Match score weights: distance 35% · size 25% · config 20% · recency 20%. Top-matched comps best support the ARV.
Projected returns pro-forma
-3.0% appreciation · 3.0% rent growth · sell at horizon
- IRR
- -16.4%
- Equity multiple
- 0.42×
- Total profit
- $-22,374
- Equity at exit
- $20,502
- IRR
- -8.1%
- Equity multiple
- 0.49×
- Total profit
- $-19,617
- Equity at exit
- $11,888
Cash invested: $38,500 (down + closing). Projections, not guarantees.
Landlord ↔ Tenant lean methodology
- Overall (STATE)
- 43 Moderately Tenant-Leaning
- State Illinois
- 43 Moderately Tenant-Leaning · D+7
- County
- — inherits STATE
- City
- — inherits STATE
ZIP-level market 62401
- Home prices YoY
- -26.2%
- Active inventory
- 111
- Price-to-rent
- 9.9×
Monthly cashflow live
- Estimated rent
- $1,155 medium interval (Pro) →
- Mortgage (P&I)
- −$721
- Tax from tax record
- −$135 /mo · $1,622/yr
- Insurance
- −$57
- HOA
- −$0
- Vacancy / Maint / Mgmt
- −$242
- Net cashflow
- $-1
Break-even live
UW: 25.0% down · 7.5% · 30yr · 1.5% tax · 5.0% vac · 8.0% maint · 8.0% mgmt
Financing live
Cash to close
- Down payment
- $34,375
- Closing costs
- $4,125
- Reserves months
- —
- Total cash needed
- —
Loan-product check · same deal, 3 products live
Conventional
25% down · 7.5% · 30yr
- Down + closing
- —
- Monthly P&I
- —
- Monthly cashflow
- —
- DSCR
- —
- Eligible?
- —
Personal DTI + credit; lowest rate.
DSCR
20% down · 8.5% · 30yr
- Down + closing
- —
- Monthly P&I
- —
- Monthly cashflow
- —
- DSCR
- —
- Eligible?
- —
No personal income docs; deal must DSCR.
Hard money
10% down · 12.0% · 12mo
- Down + closing
- —
- Monthly P&I
- —
- Monthly cashflow
- —
- DSCR
- —
- Eligible?
- —
Short-term bridge; refi at stabilization.
Listing history 5 events
-
2026-06-18days on market $137,500 Active 4 DOM
-
2026-06-17days on market $137,500 Active 3 DOM
-
2026-06-16days on market $137,500 Active 2 DOM
-
2026-06-15remarks 699-char remark
-
2026-06-15$137,500 Active 1 DOM
ⓘ Source: listings_history table (triggers on properties + properties_extension) + one-shot
backfill from property_details.listing_events for pre-trigger history.
Tax reassessment forecast IL · Partial reset (capped growth)
- Current annual tax
- $1,622 · $135/mo
- Projected year-2 tax
- $2,372 · $198/mo
- Expected delta
- +$750/yr (+$62/mo · 46.2%)
ⓘ Screening estimate from a state-policy table — verify with the county assessor before closing.
Climate risk First Street
- Flood 1/10 Low FEMA zone X · 0% chance over 30 yrs
- Wildfire 1/10 Low
- Heat 4/10 Moderate 7 d/yr ≥106°F today · 21 d/yr by 30 yrs out
- Wind 2/10 Low 100% chance of damaging wind over 30 yrs
- Air quality 2/10 Low 1 unhealthy d/yr today · 2 by 30 yrs out
Nearby sold comps map
Loading sold comps map…
Walkable amenities ~0.75 mi
Loading nearby amenities…
Taxation est. · year 1
- Rental income
- $13,855
- − Mortgage interest
- −$7,702
- − Property taxes
- −$1,622
- − Insurance
- −$688
- − Repairs & maintenance
- −$1,108
- − Management
- −$1,108
- − Depreciation
- −$4,000
- Taxable loss
- −$2,373
- Est. tax savings @ 24.0%
- +$570
- After-tax cash flow
- $553/yr
For passive investors: Depreciation is non-cash, so a rental often shows a tax loss while cash-flowing — sheltering income. Rental losses are passive: they offset passive income freely, and up to $25,000/yr can offset ordinary (W-2) income if you actively participate and your MAGI is under $100k (phasing out to $0 by $150k); unused losses carry forward. On sale, claimed depreciation is recaptured at up to 25%, and gains may owe capital-gains tax (a 1031 exchange can defer both). Figures are a year-1 estimate at your 24.0% rate — not tax advice; consult a CPA.
Schools (NCES district)
- District
- Effingham CUSD 40
- NCES district ID
- 1713560
- Math proficiency
- 18% ▼ -5.00%
- Reading proficiency
- 26% ▼ -6.00%
- Median HH income
- $48,021
- Composite
- 19.35/100
- National rank
- #8789
- State rank
- #387 of 620 in IL
Livability — Effingham
- Score
- 78/100
- State rank
- #140
- US rank
- #2564
Category grades
Schools grade is shown separately in the Schools card above.
Census & demographics
- Census place
- Effingham, IL
- City population
- 19,371
- Population (ZIP)
- 19,371
Population outlook (Effingham County) Hauer SSP2
- Today (2025)
- 34,179 people
- By 2030
- 33,648 · -1.6%
- By 2040
- 32,066 · -6.2%
- By 2050
- 29,813 · -12.8%
- By 2075
- 24,101 · -29.5%
- By 2100
- 17,174 · -49.8%
Race, ethnicity, and origin ACS 2023
- Neighborhood character
- Predominantly White (94%)
- Race & ethnicity
- White 94% Hispanic / Latino 3% Two or more races 2%
- Common ancestry
- Lithuanian 2% Romanian 2% Italian 1%
- Foreign-born
- 3% · Canada
- Languages at home
- 96% English-only · Spanish 3% Other Indo-European 1%
Political lean MEDSL · Effingham
- 2024 margin
- Solid R (+60.4) · D 19.0% · R 79.3% · Other 1.7%
- 2008→2024 swing
- -24.4pp toward R · 2008: -36.0pp · 2024: -60.4pp
- All cycles
- 2024: R+60.4 2020: R+59.2 2016: R+60.5 2012: R+52.0 2008: R+36.0
Not yet ingested
- Civics
- —
Market trends
- HPI YoY
- ▼ -59.52%
- Current HPI
- 167.267
- Rent YoY
- —
- Metro
- —
- State GDP YoY
- ▲ 1.59%
- F500 in state
- 60
Industry mix (Fortune 500 HQ in IL)
| Industry | F500 HQs | Revenue |
|---|---|---|
| Insurance | 4 | $201B |
|
||
| Consumer Goods | 4 | $87B |
|
||
| Industrial Machinery | 3 | $64B |
|
||
| Healthcare | 2 | $55B |
|
||
| Retail / Pharmacy | 1 | $148B |
|
||
| Agriculture / Food | 1 | $86B |
|
||
Price history
1 event — show timeline
- 2026-06-14 Listed $137,500 CIBR
Property tax history
+12.2%/yrLatest (2024): $1,622 · +276.4% YoY. Source: county tax records.
Cash-flow waterfall
monthlySold comps — $/sqft
last 12 mo · ≤1 miLoading sold comps…