 🏗️ New Construction
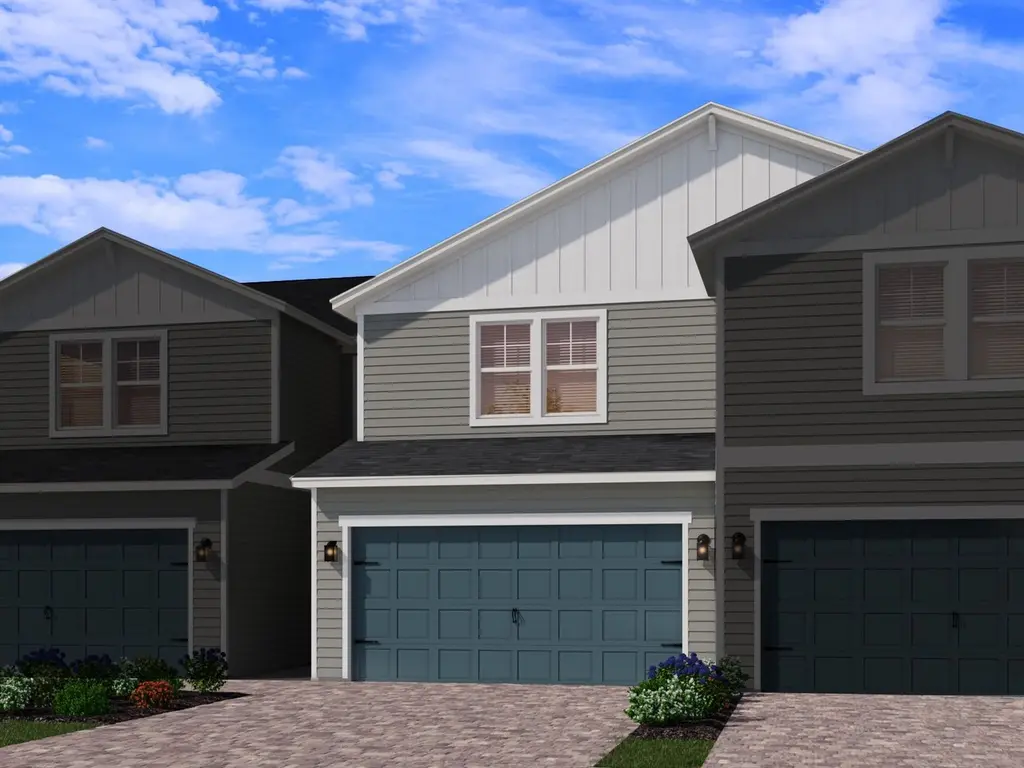
Camden Plan · Fruit Cove, FL
Flood risk No data
- FEMA flood zone
- —
- Chance of flooding over 30 yrs
- —
- Est. flood insurance / yr
- —
Fire risk No data
- Est. fire insurance / yr
- —
Heat risk No data
- Hot days now (above threshold)
- —
- Hot days in 30 yrs
- —
Wind risk No data
- Chance of severe wind over 30 yrs
- —
Air-quality risk No data
- Unhealthy air days now
- —
- Unhealthy air days in 30 yrs
- —
Risk factors via First Street. Map © Google.
Why this score? — see what drove the F grade
The composite is a weighted blend of 9 inputs, each scored 0–100. Each bar is that input's sub-score; the figure is the points it added to the 100-point composite (weight × sub-score).
- ARV discount +7.5/15.0
- Schools +6.4/10.0
- Cash flow +4.4/30.0
- Livability +3.5/5.0
- Rent growth +2.5/5.0
- Condition / age +2.5/5.0
- 1% rule +0.4/10.0
- DSCR +0.0/10.0
- Appreciation +0.0/10.0
$339,990
🖨 Deal sheet (PDF) 📄 Offer letter ✓ Due diligence
Listing remarks MLS
This townhome unit has an open first floor with a spacious kitchen and great room. Upstairs secondary bedrooms have direct access to the full bath. Primary suite has an oversized walk-in closet, standing shower and dual sinks in the bath.
Key facts
- Dual sinks
- Spacious kitchen
- Great room
Tags
Neighborhood map
What this means for you Summary
Snapshot
- This is a 3-bed/2.5-bath single-family listed at $340k.
Deal economics
- At list price, monthly cash flow is $-1k ($-15k/yr) — negative.
- To cash-flow at today's rent, offer at most $290k (14.7% below list).
- To meet the 1% rule (rent ≥ 1% of price), the offer needs to be $254k (25.4% below list).
- Recommended offer: $254k (25.4% below list) — sets the bar for 1% rule.
Location & tenants
- Location reads 69/100 on livability (#469 in FL) — a middle-class / working-renter tenant base. Strengths: crime A+, employment A+, housing A+; Watch: amenities F, commute F, cost of living F.
- St. Johns (rural): math 75% / reading 73% proficiency, ranked #2 of 73 in FL (top 3%) — strong family-tenant draw, lease renewals of 3-5y typical; only 20% free/reduced lunch — higher-income household profile.
- Zoned schools: Timberlin Creek Elementary School (math 81% / reading 85%, grade A+, #65 of 2,144 statewide, top 3%, 1,311 students, 9% FRL); Switzerland Point Middle School (math 80% / reading 72%, grade A, #34 of 571 statewide, top 6%, 1,430 students, 5% FRL); Bartram Trail High School (math 68% / reading 75%, grade B+, #49 of 667 statewide, top 8%, 2,493 students, 4% FRL).
- Market conditions: Rents flat; 1335 active listings in the ZIP; 5 comparable units currently listed for rent nearby; rentals at typical pace (median 26d on market — plan ~3-4 weeks tenant-placement turnaround); high-income renter base; 5,575 units permitted in St. Johns County in 2024 (584 in 5+ unit buildings).
Forward outlook
- Local home prices are declining (-3.0%/yr); year-one equity from $3k of loan paydown is wiped out by about $14k of value loss. Plan a longer hold.
- St. Johns County population projected at +60% by 2050 — long-run rental-demand tailwind backs the buy-and-hold thesis.
Negotiation context
- It's been on market 131 days — a 12% lower offer ($299k) is reasonable based on typical stale-listing flexibility.
Questions for the listing agent
- What do current leases actually rent for vs. the listed asking? Can we see a recent rent roll and the last 12 months of T-12 income?
- It's been on market 131 days. Have you received any prior offers? Is the seller open to a 25% concession, seller financing, or rate buy-down credit?
- Why hasn't it sold? Are there any deal-killer items the seller is aware of (foundation, flood, title, zoning, code violations)?
- Is there a deadline driving the sale (1031 exchange, divorce, estate, relocation)? That informs how much negotiation room exists.
- Schools are A-rated — typically a magnet for longer-tenancy family renters. What's the average tenant stay here, and is there a school-zone premium baked into asking?
- The area grade is low — what's the realistic commute time and amenity access for the typical tenant pool here? Any planned neighborhood developments (good or bad) we should know about?
- What's the average days-on-market for RENTAL listings here right now (not sales)? A rising rental-DOM trend means longer vacancies and softer asking-rent achievability than the comps imply.
- What's the recent tenant-quality profile in this submarket — average credit score on applications, eviction rate, late-payment / NSF rate, and stable-employment percentage? A property-management company in the area should have these aggregated.
- How much new for-sale + rental construction is in the pipeline within 1–3 miles? Heavy new supply typically softens prices + rents 12–24 months out; constrained supply supports both.
Investment metrics
- 1% rule
- 0.54% ✗
- Cap rate
- 3.15%
- Cash-on-cash
- -11.23%
- DSCR
- 0.50
- GRM
- 15.3
CMA / ARV
- ARV (median comp)
- $467,121
- List price
- $339,990
- Delta
- -27.22%
- Verdict
- UNDERPRICED
- Comps
- 20 within 1.0 mi
Show comp detail 12 sales within ~0.75 mi
| Address | Dist | Beds/Ba | Sqft | Sold | Price | $/sf | Match |
|---|---|---|---|---|---|---|---|
| 73 Bluebonnet Way | 0.66mi | 3/2.0 | 1,660 (+4%) | 0mo | $352,500 | $212 | 61 |
| 100 Alston Dr | 0.62mi | 3/2.0 | 1,675 (+4%) | 2mo | $380,000 | $227 | 60 |
| 34 Gilchrist Way | 0.68mi | 3/2.0 | 1,610 (+0%) | 11mo | $374,500 | $233 | 56 |
| 39 Gilchrist Way | 0.71mi | 3/2.0 | 1,675 (+4%) | 6mo | $375,000 | $224 | 52 |
| 251 Windswept Way | 0.55mi | 3/2.0 | 1,790 (+12%) | 2mo | $340,000 | $190 | 51 |
| 48 Gilchrist Way | 0.68mi | 3/2.0 | 1,675 (+4%) | 9mo | $392,000 | $234 | 51 |
| 130 Alston Dr | 0.65mi | 3/2.0 | 1,674 (+4%) | 12mo | $426,600 | $255 | 51 |
| 237 Windswept Way | 0.55mi | 3/2.0 | 1,790 (+12%) | 4mo | $420,000 | $235 | 49 |
| 47 Buffalo Ct | 0.51mi | 4/2.0 (+1) | 1,798 (+12%) | 1mo | $441,990 | $246 | 48 |
| 56 Gilchrist Way | 0.68mi | 3/2.0 | 1,752 (+9%) | 4mo | $390,000 | $223 | 48 |
| 26 Gilchrist Way | 0.69mi | 3/2.0 | 1,800 (+12%) | 4mo | $390,000 | $217 | 42 |
| 205 Windswept Way | 0.57mi | 3/2.0 | 1,804 (+12%) | 12mo | $440,000 | $244 | 40 |
Match score weights: distance 35% · size 25% · config 20% · recency 20%. Top-matched comps best support the ARV.
Projected returns pro-forma
-3.0% appreciation · 0.08% rent growth · sell at horizon
- IRR
- -40.0%
- Equity multiple
- -0.23×
- Total profit
- $-160,858
- Equity at exit
- $69,649
- IRR
- -85.2%
- Equity multiple
- -1.05×
- Total profit
- $-268,334
- Equity at exit
- $40,388
Cash invested: $130,794 (down + closing). Projections, not guarantees.
Landlord ↔ Tenant lean methodology
- Overall (STATE)
- 87 Strongly Landlord-Friendly
- State Florida
- 87 Strongly Landlord-Friendly · R+3
- County
- — inherits STATE
- City
- — inherits STATE
ZIP-level market 32092
- Home prices YoY
- -32.2%
- Rents YoY
- 0.1%
- Active inventory
- 1335
- Price-to-rent
- 11.2×
Monthly cashflow live
- Estimated rent
- $2,537 high interval (Pro) →
- Mortgage (P&I)
- −$2,450
- Tax est. 1.5%
- −$584 /mo · $7,007/yr
- Insurance
- −$195
- HOA
- −$0
- Vacancy / Maint / Mgmt
- −$533
- Net cashflow
- $-1,224
Break-even live
Sensitivity live
| Price | -10% $-901 | -5% $-1,063 | +0% $-1,224 | +5% $-1,385 | +10% $-1,547 |
|---|---|---|---|---|---|
| Rent | -10% $-1,424 | -5% $-1,324 | +0% $-1,224 | +5% $-1,124 | +10% $-1,024 |
| Rate | -1.0pp $-989 | -0.5pp $-1,105 | base $-1,224 | +0.5pp $-1,345 | +1.0pp $-1,468 |
UW: 25.0% down · 7.5% · 30yr · 1.5% tax · 5.0% vac · 8.0% maint · 8.0% mgmt
Financing live
Cash to close
- Down payment
- $116,780
- Closing costs
- $14,014
- Reserves months
- —
- Total cash needed
- —
Loan-product check · same deal, 3 products live
Conventional
25% down · 7.5% · 30yr
- Down + closing
- —
- Monthly P&I
- —
- Monthly cashflow
- —
- DSCR
- —
- Eligible?
- —
Personal DTI + credit; lowest rate.
DSCR
20% down · 8.5% · 30yr
- Down + closing
- —
- Monthly P&I
- —
- Monthly cashflow
- —
- DSCR
- —
- Eligible?
- —
No personal income docs; deal must DSCR.
Hard money
10% down · 12.0% · 12mo
- Down + closing
- —
- Monthly P&I
- —
- Monthly cashflow
- —
- DSCR
- —
- Eligible?
- —
Short-term bridge; refi at stabilization.
Rent comps 5 comps
| Address | Beds | Baths | Sqft | Rent | $/sqft | DOM | Units | Dist |
|---|---|---|---|---|---|---|---|---|
| 78 Gaston Ct Saint Augustine, FL | 3.0 | 2.5 | 1635 | $2,250 | $1.38 | 25d | 1 | 0.05mi |
| 380 Belfort Ct Saint Augustine, FL | 3.0 | 2.5 | 1782 | $2,500 | $1.40 | 25d | 1 | 0.46mi |
| 413 Rosemont Dr Saint Augustine, FL | 3.0 | 2.5 | 1782 | $2,125 | $1.19 | 25d | 1 | 0.49mi |
| 36 Viceroy Ct Saint Augustine, FL | 3.0 | 2.5 | 1631 | $2,850 | $1.75 | 19d | 1 | 0.75mi |
| 18 Longtail Dr Saint Augustine, FL | 2.0–3.0 | 2.0–2.5 | 1714 | $3,142 | $1.83 | 3d | 9 | 0.89mi |
Listing history 19 events
-
2026-06-21days on market $339,990 Active 131 DOM
-
2026-06-18days on market $339,990 Active 128 DOM
-
2026-06-17days on market $339,990 Active 127 DOM
-
2026-06-16days on market $339,990 Active 126 DOM
-
2026-06-15days on market $339,990 Active 125 DOM
-
2026-06-13days on market $339,990 Active 123 DOM
-
2026-06-13days on market $339,990 Active 122 DOM
-
2026-06-10days on market $339,990 Active 119 DOM
-
2026-06-08days on market $339,990 Active 118 DOM
-
2026-06-07days on market $339,990 Active 117 DOM
-
2026-06-03days on market $339,990 Active 113 DOM
-
2026-06-02days on market $339,990 Active 112 DOM
-
2026-06-01days on market $339,990 Active 111 DOM
-
2026-05-31days on market $339,990 Active 110 DOM
-
2026-04-23price $344,990 238-char remark
Show marketing remark (238 chars)
This townhome unit has an open first floor with a spacious kitchen and great room. Upstairs secondary bedrooms have direct access to the full bath. Primary suite has an oversized walk-in closet, standing shower and dual sinks in the bath.
-
2026-04-10price $347,990 238-char remark
Show marketing remark (238 chars)
This townhome unit has an open first floor with a spacious kitchen and great room. Upstairs secondary bedrooms have direct access to the full bath. Primary suite has an oversized walk-in closet, standing shower and dual sinks in the bath.
-
2026-03-12price $349,990 238-char remark
Show marketing remark (238 chars)
This townhome unit has an open first floor with a spacious kitchen and great room. Upstairs secondary bedrooms have direct access to the full bath. Primary suite has an oversized walk-in closet, standing shower and dual sinks in the bath.
-
2026-03-04price $350,990 238-char remark
Show marketing remark (238 chars)
This townhome unit has an open first floor with a spacious kitchen and great room. Upstairs secondary bedrooms have direct access to the full bath. Primary suite has an oversized walk-in closet, standing shower and dual sinks in the bath.
-
2026-02-10$352,990 Active 238-char remark
Show marketing remark (238 chars)
This townhome unit has an open first floor with a spacious kitchen and great room. Upstairs secondary bedrooms have direct access to the full bath. Primary suite has an oversized walk-in closet, standing shower and dual sinks in the bath.
ⓘ Source: listings_history table (triggers on properties + properties_extension) + one-shot
backfill from property_details.listing_events for pre-trigger history.
Nearby sold comps map
Loading sold comps map…
Walkable amenities ~0.75 mi
Loading nearby amenities…
Taxation est. · year 1
- Rental income
- $30,442
- − Mortgage interest
- −$26,166
- − Property taxes
- −$7,007
- − Insurance
- −$2,336
- − Repairs & maintenance
- −$2,435
- − Management
- −$2,435
- − Depreciation
- −$13,589
- Taxable loss
- −$23,526
- Est. tax savings @ 24.0%
- +$5,646
- After-tax cash flow
- $-9,042/yr
For passive investors: Depreciation is non-cash, so a rental often shows a tax loss while cash-flowing — sheltering income. Rental losses are passive: they offset passive income freely, and up to $25,000/yr can offset ordinary (W-2) income if you actively participate and your MAGI is under $100k (phasing out to $0 by $150k); unused losses carry forward. On sale, claimed depreciation is recaptured at up to 25%, and gains may owe capital-gains tax (a 1031 exchange can defer both). Figures are a year-1 estimate at your 24.0% rate — not tax advice; consult a CPA.
Schools (NCES district)
- District
- St. Johns
- NCES district ID
- 1201740
- Math proficiency
- 75% ▼ -5.00%
- Reading proficiency
- 73% ▼ -2.00%
- Median HH income
- $66,842
- Composite
- 64.31/100
- National rank
- #556
- State rank
- #2 of 73 in FL
Livability — Fruit Cove
- Score
- 69/100
- State rank
- #469
- US rank
- #8490
Category grades
Schools grade is shown separately in the Schools card above.
Census & demographics
- County
- Saint Johns County · 301,599 people
- Metro
- Jacksonville, FL
- Population (ZIP)
- 53,071
- Household income
- $131,020
- Rent vs Own
- Severe rent burden
- 706.0
Population outlook (St. Johns County) Hauer SSP2
- Today (2025)
- 303,941 people
- By 2030
- 342,590 · +12.7%
- By 2040
- 417,328 · +37.3%
- By 2050
- 487,011 · +60.2%
- By 2075
- 635,395 · +109.1%
- By 2100
- 717,469 · +136.1%
Race, ethnicity, and origin ACS 2023
- Neighborhood character
- Predominantly White (75%)
- Race & ethnicity
- White 75% Two or more races 11% Hispanic / Latino 9% Black 6% Asian 3%
- Hispanic origin (detail)
- Mexican 1% Puerto Rican 2% Cuban 2%
- Common ancestry
- Lithuanian 3% Scotch-Irish 3% Slovak 3%
- Foreign-born
- 10% · Canada, Vietnam
- Languages at home
- 87% English-only · Spanish 6% Russian/Polish/Slavic 2% Other Indo-European 2%
Political lean MEDSL · St. Johns
- 2024 margin
- Solid R (+31.4) · D 33.9% · R 65.2%
- 2008→2024 swing
- +0.2pp no change · 2008: -31.6pp · 2024: -31.4pp
- All cycles
- 2024: R+31.4 2020: R+26.7 2016: R+33.4 2012: R+37.8 2008: R+31.6
Not yet ingested
- Civics
- —
Market trends
- HPI YoY
- ▼ -123.26%
- Current HPI
- 259.732
- Rent YoY
- ▲ 0.08%
- Metro
- Jacksonville, FL
- State GDP YoY
- ▲ 3.28%
- F500 in state
- 36
Industry mix (Fortune 500 HQ in FL)
| Industry | F500 HQs | Revenue |
|---|---|---|
| Industrial Technology | 2 | $29B |
|
||
| Insurance | 2 | $17B |
|
||
| Retail | 1 | $60B |
|
||
| Technology Distribution | 1 | $58B |
|
||
| Homebuilding | 1 | $35B |
|
||
| Technology Manufacturing | 1 | $35B |
|
||
Price history
-2.3% since first listed5 events — show timeline
- 2026-04-23 Price Changed $344,990 Zillow
- 2026-04-10 Price Changed $347,990 Zillow
- 2026-03-12 Price Changed $349,990 Zillow
- 2026-03-04 Price Changed $350,990 Zillow
- 2026-02-10 Listed $352,990 Zillow
Cash-flow waterfall
monthlySold comps — $/sqft
last 12 mo · ≤1 miLoading sold comps…