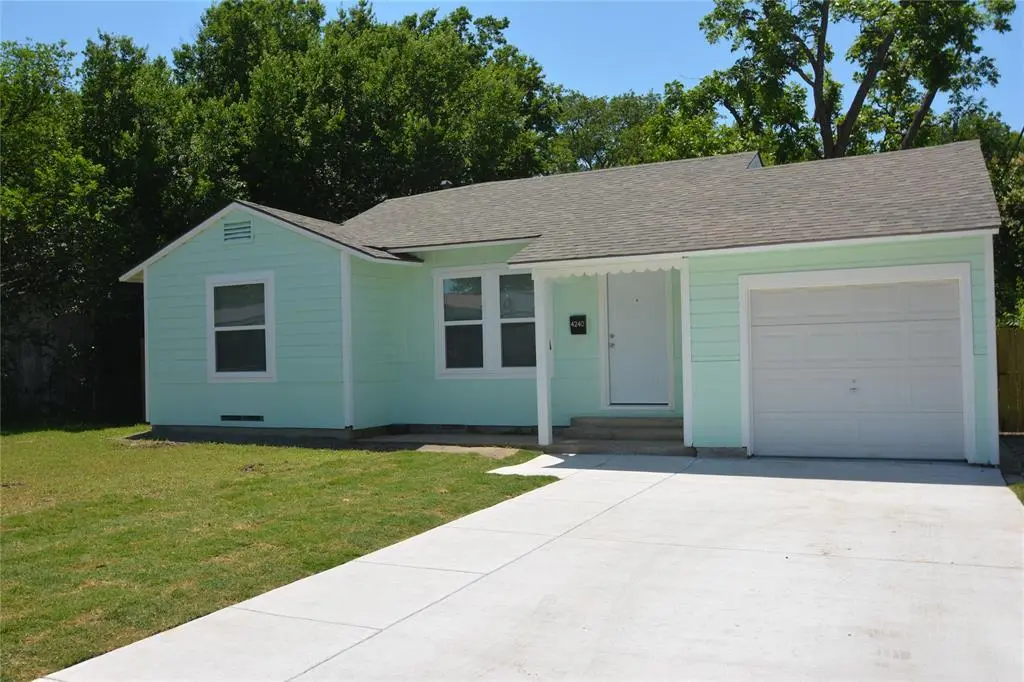
4240 Standish Rd · Fort Worth, TX
Flood risk 1/10 · Minimal
- FEMA flood zone
- X (unshaded)
- Chance of flooding over 30 yrs
- 0.0%
- Est. flood insurance / yr
- $507 – $1,088
Fire risk 1/10 · Minimal
- Est. fire insurance / yr
- $1,222 – $2,270
Heat risk 7/10 · Major
- Hot days now (above 109°F)
- 7 days/yr
- Hot days in 30 yrs
- 22 days/yr
Wind risk 4/10 · Minor
- Chance of severe wind over 30 yrs
- 21.0%
Air-quality risk 3/10 · Minor
- Unhealthy air days now
- 2 days/yr
- Unhealthy air days in 30 yrs
- 3 days/yr
Risk factors via First Street. Map © Google.
Why this score? — see what drove the C+ grade
The composite is a weighted blend of 9 inputs, each scored 0–100. Each bar is that input's sub-score; the figure is the points it added to the 100-point composite (weight × sub-score).
- Cash flow +23.0/30.0
- ARV discount +13.1/15.0
- DSCR +7.4/10.0
- 1% rule +5.7/10.0
- Livability +4.0/5.0
- Rent growth +2.5/5.0
- Condition / age +2.5/5.0
- Schools +2.0/10.0
- Appreciation +0.0/10.0
$199,000
🖨 Deal sheet (PDF) 📄 Offer letter ✓ Due diligence
Listing remarks
Cute 3 bedroom, 1 bath, 1 car garage home located in south Fort Worth. There are lots of new things inside and out, like new paint, stove, dishwasher, etc. See pictures. The home is owned by a real estate broker and has been in the same family for years and years. .. it's time to sell it, so please call your real estate agent to ask a question, or to take a look at the property! Please note: the garage will not fit a full sized car or truck. .. it is smaller than a normal garage. .
Key facts
- 6,011 sq ft lot
- Garage
- Built 1949
Property features AI
Finance
- Other: Mineral rights excluded
- Financial info: Listing accepts Cash, Conventional, FHA, and VA financing
- HOA & community: No association
Exterior
- Parking: Covered parking space (concrete); Attached garage with 1 garage space
- Utilities: City water; City sewer; No municipal utility district
- Home design: Single family residence; One story; Residential property, not attached
- Construction: Built in 1949; Wood construction
- Exterior features: Lot less than 0.5 acre; Subdivision: Kellis Park Add
Interior
- Kitchen: Dishwasher; Disposal; Gas range
- Bedrooms: Three bedrooms (primary bedroom on main level)
- Bathrooms: One full bathroom
- Interior features: One living area; One dining area; Other interior features; Two total rooms
- Laundry & utility: Gas water heater
Neighborhood map
What this means for you Summary
Snapshot
- This is a 3-bed/1.0-bath single-family listed at $199k.
Deal economics
- At list price, monthly cash flow is $353 ($4k/yr) — positive.
- The deal already cash-flows at list — no discount required.
- Meets the 1% rule at list price ($2k rent vs $199k).
- Cap rate 8.4% vs local median 3.9% in Fort Worth — top-decile yield for the area; either an underpriced asset or a hidden risk that comps aren't pricing in. Stress-test before assuming the spread holds.
Location & tenants
- Location reads 80/100 on livability (#49 in TX, #1,954 nationally) — a professional / high-income tenant draw. Strengths: amenities A+, cost of living A+, housing A+; Watch: crime F.
- Fort Worth ISD (urban): math 18% / reading 28% proficiency, ranked #742 of 826 in TX (top 90%) — low school quality limits family demand, transient renter base, plan for 1-2y turnover; 73% free/reduced lunch — lower-income household profile, screen leases tightly.
- Zoned schools: Westcliff El (math 39% / reading 50%, grade F, #1,155 of 4,322 statewide, top 29%, 560 students, 79% FRL).
- Zoned-school proficiency averages 44% at this address vs 23% district-wide (+22 pts) — the actual schools serving this property are materially stronger than the Fort Worth ISD average implies; a family-tenant draw the district grade alone would hide.
- Market conditions: Rents soft (-0.2%/yr); 205 active listings in the ZIP; 40 comparable units currently listed for rent nearby; rentals at typical pace (median 20d on market — plan ~3-4 weeks tenant-placement turnaround); solid renter incomes; 18,938 units permitted in Tarrant County in 2024 (8,336 in 5+ unit buildings).
- This rent runs 34% of the median local income ($76k/yr) — at the standard rent-burdened threshold; future hikes will face affordability resistance.
Forward outlook
- Local home prices are declining (-3.0%/yr); year-one equity from $1k of loan paydown is wiped out by about $6k of value loss. Plan a longer hold.
- Tarrant County population projected at +41% by 2050 — long-run rental-demand tailwind backs the buy-and-hold thesis.
Negotiation context
- Only 10 days on market — expect competitive offers; lowballing is unlikely to land.
Risks & watch-outs
- Watch-outs: built in 1949 — expect roof / HVAC / electrical / plumbing capex.
- Climate carrying-cost: extreme-heat days projected 7→22/yr by 2055 (HVAC capex compounding) — expect insurance premiums to compound above CPI over the hold.
Questions for the listing agent
- Built in 1949 — when were the roof, HVAC, electrical panel, plumbing, and water heater last replaced?
- Is there a deadline driving the sale (1031 exchange, divorce, estate, relocation)? That informs how much negotiation room exists.
- Schools are D-rated, which usually means shorter tenancies and higher turnover. Who's the typical renter profile here, and what's been the actual vacancy rate?
- Crime grade is F in this area — have there been break-ins, vandalism, or insurance claims at this property in the last 3 years? What carrier currently insures it and at what premium?
- What's the average days-on-market for RENTAL listings here right now (not sales)? A rising rental-DOM trend means longer vacancies and softer asking-rent achievability than the comps imply.
- What's the recent tenant-quality profile in this submarket — average credit score on applications, eviction rate, late-payment / NSF rate, and stable-employment percentage? A property-management company in the area should have these aggregated.
- How much new for-sale + rental construction is in the pipeline within 1–3 miles? Heavy new supply typically softens prices + rents 12–24 months out; constrained supply supports both.
Investment metrics
- 1% rule
- 1.07% ✓
- Cap rate
- 8.42%
- Cash-on-cash
- 7.60%
- DSCR
- 1.34
- GRM
- 7.8
CMA / ARV
- ARV (on-the-fly)
- $227,258
- Comps found
- 12
Show comp detail 12 sales within ~0.75 mi
| Address | Dist | Beds/Ba | Sqft | Sold | Price | $/sf | Match |
|---|---|---|---|---|---|---|---|
| 4240 Standish Rd | 0.00mi | 3/1.0 | 1,142 (0%) | 0mo | $199,000 | $174 | 100 |
| 4240 Cherokee Trl | 0.11mi | 3/1.0 | 1,130 (-1%) | 4mo | $199,000 | $176 | 90 |
| 4416 Surrey St | 0.20mi | 3/1.0 | 1,034 (-10%) | 9mo | $199,750 | $193 | 68 |
| 3501 W Gambrell St | 0.25mi | 3/2.0 | 1,064 (-7%) | 8mo | $180,000 | $169 | 66 |
| 4505 Stadium Dr | 0.29mi | 3/1.0 | 1,042 (-9%) | 9mo | $207,900 | $200 | 65 |
| 4429 Rutland Ave | 0.38mi | 2/2.0 (-1) | 1,186 (+4%) | 4mo | $195,000 | $164 | 63 |
| 4417 Odessa Ave | 0.32mi | 4/2.0 (+1) | 1,231 (+8%) | 3mo | $245,000 | $199 | 60 |
| 3512 Binyon Ave | 0.44mi | 3/1.0 | 1,275 (+12%) | 0mo | $257,500 | $202 | 60 |
| 3458 Brady Ave | 0.45mi | 2/1.0 (-1) | 1,046 (-8%) | 4mo | $235,000 | $225 | 57 |
| 3425 Cloer Dr | 0.36mi | 3/2.0 | 1,306 (+14%) | 2mo | $480,000 | $368 | 54 |
| 3717 Carolyn Rd | 0.68mi | 3/2.0 | 1,183 (+4%) | 9mo | $319,000 | $270 | 51 |
| 4809 S Ridge Ter | 0.68mi | 2/1.5 (-1) | 1,238 (+8%) | 2mo | $129,000 | $104 | 45 |
Match score weights: distance 35% · size 25% · config 20% · recency 20%. Top-matched comps best support the ARV.
Projected returns pro-forma
-3.0% appreciation · 0.0% rent growth · sell at horizon
- IRR
- -8.0%
- Equity multiple
- 0.71×
- Total profit
- $-15,998
- Equity at exit
- $29,672
- IRR
- -2.8%
- Equity multiple
- 0.84×
- Total profit
- $-9,061
- Equity at exit
- $17,206
Cash invested: $55,720 (down + closing). Projections, not guarantees.
Landlord ↔ Tenant lean methodology
- Overall (STATE)
- 87 Strongly Landlord-Friendly
- State Texas
- 87 Strongly Landlord-Friendly · R+5
- County
- — inherits STATE
- City
- — inherits STATE
ZIP-level market 76133
- Rents YoY
- -0.2%
- Active inventory
- 205
- Price-to-rent
- 7.8×
Monthly cashflow live
- Estimated rent
- $2,127 high interval (Pro) →
- Mortgage (P&I)
- −$1,044
- Tax from tax record
- −$201 /mo · $2,408/yr
- Insurance
- −$83
- HOA
- −$0
- Vacancy / Maint / Mgmt
- −$447
- Net cashflow
- $353
Break-even live
Sensitivity live
| Price | -10% $466 | -5% $409 | +0% $353 | +5% $297 | +10% $240 |
|---|---|---|---|---|---|
| Rent | -10% $185 | -5% $269 | +0% $353 | +5% $437 | +10% $521 |
| Rate | -1.0pp $453 | -0.5pp $404 | base $353 | +0.5pp $301 | +1.0pp $249 |
UW: 25.0% down · 7.5% · 30yr · 1.5% tax · 5.0% vac · 8.0% maint · 8.0% mgmt
Financing live
Cash to close
- Down payment
- $49,750
- Closing costs
- $5,970
- Reserves months
- —
- Total cash needed
- —
Loan-product check · same deal, 3 products live
Conventional
25% down · 7.5% · 30yr
- Down + closing
- —
- Monthly P&I
- —
- Monthly cashflow
- —
- DSCR
- —
- Eligible?
- —
Personal DTI + credit; lowest rate.
DSCR
20% down · 8.5% · 30yr
- Down + closing
- —
- Monthly P&I
- —
- Monthly cashflow
- —
- DSCR
- —
- Eligible?
- —
No personal income docs; deal must DSCR.
Hard money
10% down · 12.0% · 12mo
- Down + closing
- —
- Monthly P&I
- —
- Monthly cashflow
- —
- DSCR
- —
- Eligible?
- —
Short-term bridge; refi at stabilization.
Rent comps 40 comps
| Address | Beds | Baths | Sqft | Rent | $/sqft | DOM | Units | Dist |
|---|---|---|---|---|---|---|---|---|
| 4256 Standish Rd Fort Worth, TX | 3.0 | 2.0 | 1392 | $1,650 | $1.19 | 25d | 1 | 0.08mi |
| 4129 Winfield Ave Fort Worth, TX | 3.0 | 2.0 | 1465 | $2,580 | $1.76 | 3d | 1 | 0.17mi |
| 4228 Winfield Ave Fort Worth, TX | 4.0 | 2.0 | 1486 | $3,500 | $2.36 | 19d | 1 | 0.23mi |
| 4152 Anita Ave Fort Worth, TX | 2.0 | 1.0 | 1112 | $1,995 | $1.79 | 19d | 1 | 0.29mi |
| 4317 Clay Ave Fort Worth, TX | 3.0 | 1.0 | 1240 | $1,995 | $1.61 | 25d | 1 | 0.31mi |
| 3259 Binyon Ave Fort Worth, TX | 3.0 | 1.0 | 1260 | $2,200 | $1.75 | 14d | 1 | 0.54mi |
| 3104 Medina Ave Fort Worth, TX | 3.0 | 2.0 | 1355 | $1,850 | $1.37 | 22d | 1 | 0.63mi |
| 3559 Norfolk Rd Fort Worth, TX | 2.0 | 1.0 | 1223 | $2,100 | $1.72 | 44d | 1 | 0.64mi |
| 2908 Binyon Ave Fort Worth, TX | 3.0 | 1.0 | 1249 | $1,775 | $1.42 | 25d | 1 | 0.67mi |
| 2800 W Fuller Ave Fort Worth, TX | 3.0 | 1.5 | 1161 | $1,650 | $1.42 | 44d | 1 | 0.70mi |
| 4904 Odessa Ave Fort Worth, TX | 3.0 | 2.0 | 1360 | $2,050 | $1.51 | 25d | 1 | 0.77mi |
| 4113 McCart Ave Fort Worth, TX | 2.0 | 1.0 | 807 | $1,375 | $1.70 | 44d | 1 | 0.84mi |
| 3745 Willomet Ave Fort Worth, TX | 3.0 | 2.0 | 1302 | $1,795 | $1.38 | 7d | 1 | 0.91mi |
| 3401 Leith Ave Fort Worth, TX | 3.0 | 2.0 | 1425 | $1,800 | $1.26 | 5d | 1 | 0.97mi |
| 3827 Cornish Ave Fort Worth, TX | 3.0 | 2.0 | 1428 | $1,299 | $0.91 | 5d | 1 | 0.98mi |
| 2809 South Hills Ave Fort Worth, TX | 3.0 | 2.0 | 1203 | $1,650 | $1.37 | 19d | 1 | 1.05mi |
| 2809 South Hills Ave Fort Worth, TX | 3.0 | 2.0 | 1203 | $1,650 | $1.37 | 44d | 1 | 1.05mi |
| 3417 S University Dr Unit A Fort Worth, TX | 2.0 | 1.0 | 1059 | $1,095 | $1.03 | 5d | 1 | 1.06mi |
| 3417 S University Dr Unit D Fort Worth, TX | 2.0 | 1.0 | 900 | $1,235 | $1.37 | 44d | 1 | 1.06mi |
| 3419 S University Dr Unit D Fort Worth, TX | 2.0 | 1.0 | 900 | $1,095 | $1.22 | 17d | 1 | 1.07mi |
| 3324 S University Dr Unit Down Fort Worth, TX | 2.0 | 2.0 | 1312 | $1,600 | $1.22 | 5d | 1 | 1.09mi |
| 4201 William Fleming Ct W Fort Worth, TX | 2.0 | 1.5–2.0 | 865 | $1,450 | $1.68 | 2d | 104 | 1.12mi |
| 3301 S University Dr Unit C Fort Worth, TX | 2.0 | 1.0 | 800 | $1,500 | $1.88 | 25d | 1 | 1.15mi |
| 3241 Odessa Ave Fort Worth, TX | 2.0 | 1.5 | 1180 | $2,600 | $2.20 | 5d | 1 | 1.16mi |
| 3259 S University Dr Unit A Fort Worth, TX | 3.0 | 3.0 | 1490 | $2,495 | $1.67 | 44d | 1 | 1.18mi |
| 3245 Cockrell Ave Fort Worth, TX | 2.0 | 1.0 | 1402 | $2,500 | $1.78 | 44d | 1 | 1.22mi |
| 5352 Wonder Dr Fort Worth, TX | 2.0 | 2.0 | 1244 | $1,495 | $1.20 | 44d | 1 | 1.23mi |
| 4151 SW Loop 820 Fort Worth, TX | 1.0–3.0 | 1.0–2.5 | 1068 | $1,564 | $1.46 | 2d | 40 | 1.23mi |
| 3232 Cockrell Ave Fort Worth, TX | 2.0 | 1.0 | 1128 | $2,100 | $1.86 | 44d | 1 | 1.24mi |
| 3205 Wabash Ave Fort Worth, TX | 2.0 | 1.5 | 1050 | $1,950 | $1.86 | 44d | 1 | 1.26mi |
| 3211 Rogers Ave Fort Worth, TX | 2.0 | 1.0 | 1015 | $1,695 | $1.67 | 15d | 1 | 1.26mi |
| 3208 S University Dr Unit The Carter 204B Fort Worth, TX | 3.0 | 2.0 | 1099 | $3,600 | $3.28 | 19d | 1 | 1.27mi |
| 3208 S University Dr Unit The Carter 306B Fort Worth, TX | 4.0 | 2.0 | 1385 | $4,800 | $3.47 | 19d | 1 | 1.27mi |
| 3208 S University Dr Unit The Carter 106B Fort Worth, TX | 3.0 | 2.0 | 1121 | $3,600 | $3.21 | 7d | 1 | 1.27mi |
| 2505 Benbrook Blvd Unit 503 Fort Worth, TX | 3.0 | 3.0 | 1367 | $2,495 | $1.83 | 44d | 1 | 1.33mi |
| 4806 South Dr Fort Worth, TX | 3.0 | 2.0 | 1436 | $1,900 | $1.32 | 44d | 1 | 1.36mi |
| 3136 Cockrell Ave Unit 102 Fort Worth, TX | 3.0 | 3.0 | 1376 | $3,900 | $2.83 | 6d | 1 | 1.36mi |
| 3241 Sandage Ave Fort Worth, TX | 3.0 | 2.0 | 1115 | $3,000 | $2.69 | 19d | 1 | 1.37mi |
| 3145 Waits Ave #302 Fort Worth, TX | 3.0 | 3.0 | 1245 | $3,000 | $2.41 | 25d | 1 | 1.40mi |
| 2720 W Devitt St Fort Worth, TX | 2.0 | 2.0 | 740 | $2,750 | $3.72 | 19d | 1 | 1.41mi |
Listing history 7 events
-
2026-05-23status Pending
-
2026-05-15historical Active Option Contract
-
2026-05-13$199,000 Active
-
2020-11-17soldstatus
-
2004-10-01soldstatus
-
2004-10-01soldstatus
-
1985-09-27soldstatus
ⓘ Source: listings_history table (triggers on properties + properties_extension) + one-shot
backfill from property_details.listing_events for pre-trigger history.
Tax reassessment forecast TX · Resets to sale price
- Current annual tax
- $2,408 · $201/mo
- Projected year-2 tax
- $3,642 · $303/mo
- Expected delta
- +$1,234/yr (+$103/mo · 51.2%)
ⓘ Screening estimate from a state-policy table — verify with the county assessor before closing.
Climate risk First Street
- Flood 1/10 Low FEMA zone X (unshaded) · 0% chance over 30 yrs
- Wildfire 1/10 Low
- Heat 7/10 Severe 7 d/yr ≥109°F today · 22 d/yr by 30 yrs out
- Wind 4/10 Moderate 21% chance of damaging wind over 30 yrs
- Air quality 3/10 Moderate 2 unhealthy d/yr today · 3 by 30 yrs out
Nearby sold comps map
Loading sold comps map…
Walkable amenities ~0.75 mi
Loading nearby amenities…
Taxation est. · year 1
- Rental income
- $25,521
- − Mortgage interest
- −$11,147
- − Property taxes
- −$2,408
- − Insurance
- −$995
- − Repairs & maintenance
- −$2,042
- − Management
- −$2,042
- − Depreciation
- −$5,789
- Taxable income
- $1,098
- Est. tax owed @ 24.0%
- −$264
- After-tax cash flow
- $3,972/yr
For passive investors: Depreciation is non-cash, so a rental often shows a tax loss while cash-flowing — sheltering income. Rental losses are passive: they offset passive income freely, and up to $25,000/yr can offset ordinary (W-2) income if you actively participate and your MAGI is under $100k (phasing out to $0 by $150k); unused losses carry forward. On sale, claimed depreciation is recaptured at up to 25%, and gains may owe capital-gains tax (a 1031 exchange can defer both). Figures are a year-1 estimate at your 24.0% rate — not tax advice; consult a CPA.
Schools (NCES district)
- District
- Fort Worth ISD
- NCES district ID
- 4819700
- Math proficiency
- 18% ▼ -16.00%
- Reading proficiency
- 28% ▼ -6.00%
- Median HH income
- $42,109
- Composite
- 19.61/100
- National rank
- #8753
- State rank
- #742 of 826 in TX
Livability — Fort Worth
- Score
- 80/100
- State rank
- #49
- US rank
- #1954
Category grades
Schools grade is shown separately in the Schools card above.
Census & demographics
- Census place
- Fort Worth, TX
- County
- Tarrant County · 2,033,669 people
- City population
- 911,619
- Metro
- Dallas-Fort Worth-Arlington, TX
- Population (ZIP)
- 53,958
- Household income
- $75,523
- Rent vs Own
- Severe rent burden
- 2000.0
Population outlook (Tarrant County) Hauer SSP2
- Today (2025)
- 2,380,417 people
- By 2030
- 2,578,900 · +8.3%
- By 2040
- 2,974,995 · +25.0%
- By 2050
- 3,350,489 · +40.8%
- By 2075
- 4,216,909 · +77.2%
- By 2100
- 4,741,527 · +99.2%
Race, ethnicity, and origin ACS 2023
- Neighborhood character
- Diverse neighborhood (Simpson 0.69)
- Race & ethnicity
- Hispanic / Latino 39% White 34% Black 21% Two or more races 19% Asian 3% Native American 1%
- Hispanic origin (detail)
- Mexican 34%
- Common ancestry
- Italian 3% Slovak 2% Lithuanian 1%
- Foreign-born
- 15% · Canada, China, Philippines
- Languages at home
- 70% English-only · Spanish 25% Other Asian/Pacific 1% French/Haitian/Cajun 1%
Political lean MEDSL · Tarrant
- 2024 margin
- Lean R (+5.1) · D 46.7% · R 51.9% · Other 1.4%
- 2008→2024 swing
- +6.6pp toward D · 2008: -11.7pp · 2024: -5.1pp
- All cycles
- 2024: R+5.1 2020: D+0.2 2016: R+8.7 2012: R+15.7 2008: R+11.7
Not yet ingested
- Civics
- —
Market trends
- HPI YoY
- ▼ -196.95%
- Current HPI
- 293.8679
- Rent YoY
- ▼ -0.20%
- Metro
- Dallas-Fort Worth-Arlington, TX
- State GDP YoY
- ▲ 3.95%
- F500 in state
- 110
Industry mix (Fortune 500 HQ in TX)
| Industry | F500 HQs | Revenue |
|---|---|---|
| Energy | 16 | $1,198B |
|
||
| Technology | 5 | $198B |
|
||
| Engineering / Construction | 4 | $72B |
|
||
| Energy Services | 3 | $60B |
|
||
| Utilities | 3 | $41B |
|
||
| Healthcare | 2 | $330B |
|
||
Price history
7 events — show timeline
- 2026-05-23 Pending — NTREIS
- 2026-05-15 Contingent — NTREIS
- 2026-05-13 Listed $199,000 NTREIS
- 2020-11-17 Sold (Public Records) — Public Records
- 2004-10-01 Sold (Public Records) — Public Records
- 2004-10-01 Sold (Public Records) — Public Records
- 1985-09-27 Sold (Public Records) — Public Records
Property tax history
+3.4%/yrLatest (2025): $2,408 · -9.9% YoY. Source: county tax records.
Cash-flow waterfall
monthlySold comps — $/sqft
last 12 mo · ≤1 miLoading sold comps…