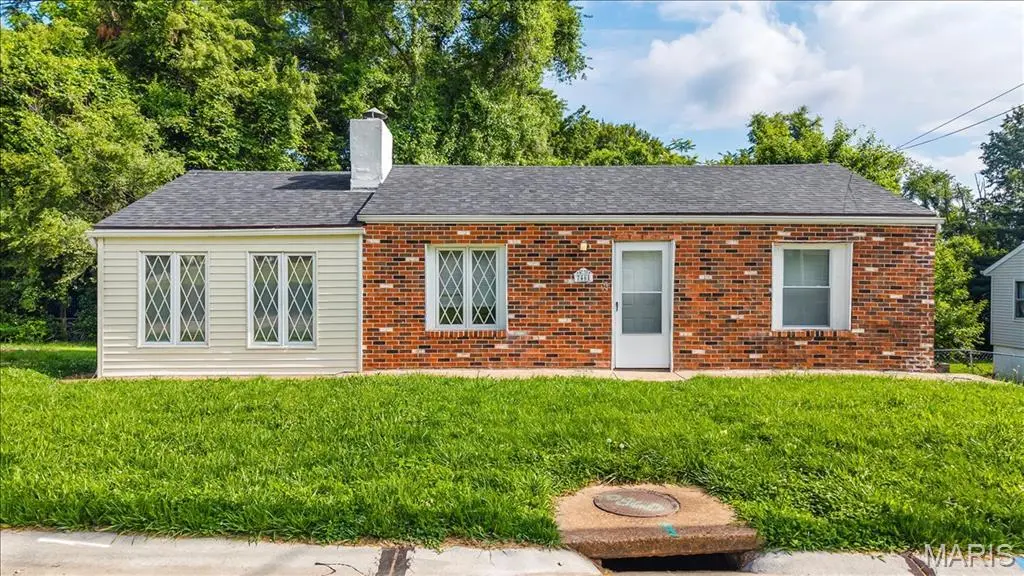
7461 Castro Dr · Ferguson, MO
Flood risk 1/10 · Minimal
- FEMA flood zone
- X (unshaded)
- Chance of flooding over 30 yrs
- 0.0%
- Est. flood insurance / yr
- $473 – $860
Fire risk 1/10 · Minimal
- Est. fire insurance / yr
- $1,054 – $1,958
Heat risk 5/10 · Moderate
- Hot days now (above 107°F)
- 7 days/yr
- Hot days in 30 yrs
- 20 days/yr
Wind risk 2/10 · Minimal
- Chance of severe wind over 30 yrs
- 2.0%
Air-quality risk 4/10 · Minor
- Unhealthy air days now
- 4 days/yr
- Unhealthy air days in 30 yrs
- 5 days/yr
Risk factors via First Street. Map © Google.
Why this score? — see what drove the C+ grade
The composite is a weighted blend of 9 inputs, each scored 0–100. Each bar is that input's sub-score; the figure is the points it added to the 100-point composite (weight × sub-score).
- Cash flow +29.4/30.0
- DSCR +10.0/10.0
- 1% rule +7.6/10.0
- ARV discount +6.3/15.0
- Rent growth +4.8/5.0
- Livability +2.9/5.0
- Condition / age +2.5/5.0
- Schools +1.2/10.0
- Appreciation +0.0/10.0
$105,000
🖨 Deal sheet 📄 Offer letter ✓ Due diligence
Listing remarks MLS
TURN KEY RENTAL PROPERTY FOR YOUR PORTFOLIO! Cute ranch style home featuring living room, kitchen, possible dining area, three bedrooms and full bath on main level. Property sold as-is...Do not disturb tenants.
Key facts
- Large yard
- Spacious layout
- 0.34 acre lot
Tags
Property features AI
Finance
- Other: Living area reported as 1,175 (above-grade, assessor source)
- Financial info: Lease not considered; No second mortgage reported
Exterior
- Utilities: Public water; Public sewer; Electricity available (single phase, 220 volts); Natural gas available
- Home design: Single-family residence; One level
- Construction: Brick construction
- Exterior features: Open lot
Interior
- Bedrooms: 4 bedrooms (all on the main level)
- Bathrooms: 1 full bathroom (main level)
- Heating & cooling: Natural gas heating; Central air conditioning
- Interior features: Full basement
Neighborhood map
What this means for you Summary
Snapshot
- This is a 3-bed/1.0-bath single-family listed at $105k.
Deal economics
- At list price, monthly cash flow is $373 ($4k/yr) — positive.
- The deal already cash-flows at list — no discount required.
- Meets the 1% rule at list price ($1k rent vs $105k).
Location & tenants
- Location reads 58/100 on livability (#586 in MO) — a working-class tenant base; expect higher turnover. Strengths: cost of living A+, housing B+; Watch: health & safety C-, crime F, amenities F.
- Ferguson-Florissant R-II (suburban): math 7% / reading 20% proficiency, ranked #311 of 324 in MO (top 96%) — low school quality limits family demand, transient renter base, plan for 1-2y turnover; 70% free/reduced lunch — lower-income household profile, screen leases tightly.
- Zoned schools: Bermuda Elementary (143 students, 98% FRL); Mccluer High (math 0% / reading 17%, grade F, #511 of 521 statewide, top 98%, 1,181 students, 100% FRL) — zoned schools average 99% FRL vs 70% district-wide (29 pts higher); higher-poverty schools than district average — tighter screening recommended.
- Market conditions: Rents rising fast (+9.0%/yr); 162 active listings in the ZIP; 40 comparable units currently listed for rent nearby; rentals at typical pace (median 24d on market — plan ~3-4 weeks tenant-placement turnaround); 48% of comp listings sitting > 30 days — soft ceiling on asking rent; 920 units permitted in St. Louis County in 2024 (250 in 5+ unit buildings).
- This rent runs 30% of the median local income ($52k/yr) — at the standard rent-burdened threshold; future hikes will face affordability resistance.
Forward outlook
- Local home prices are declining (-3.0%/yr); year-one equity from $726 of loan paydown is wiped out by about $3k of value loss. Plan a longer hold.
- At projected returns (-3.0% appreciation + 8.0% rent growth), your $29k cash investment doubles in ~6 years — after that, you're playing with house money.
Negotiation context
- Only 7 days on market — expect competitive offers; lowballing is unlikely to land.
- 3 sale attempts since 13y ago with the ask held roughly flat each time — persistent listings suggest the price (not the market) is what's stuck; bring a comps-based counter.
- Current owner paid $35k; list at $105k implies a 200% gain — meaningful room to come down on a strong offer.
Risks & watch-outs
- Watch-outs: built in 1948 — expect roof / HVAC / electrical / plumbing capex.
- Climate carrying-cost: extreme-heat days projected 7→20/yr by 2055 (HVAC capex compounding) — expect insurance premiums to compound above CPI over the hold.
Questions for the listing agent
- Built in 1948 — when were the roof, HVAC, electrical panel, plumbing, and water heater last replaced?
- Is there a deadline driving the sale (1031 exchange, divorce, estate, relocation)? That informs how much negotiation room exists.
- Schools are F-rated, which usually means shorter tenancies and higher turnover. Who's the typical renter profile here, and what's been the actual vacancy rate?
- Crime grade is F in this area — have there been break-ins, vandalism, or insurance claims at this property in the last 3 years? What carrier currently insures it and at what premium?
- What's the average days-on-market for RENTAL listings here right now (not sales)? A rising rental-DOM trend means longer vacancies and softer asking-rent achievability than the comps imply.
- What's the recent tenant-quality profile in this submarket — average credit score on applications, eviction rate, late-payment / NSF rate, and stable-employment percentage? A property-management company in the area should have these aggregated.
- How much new for-sale + rental construction is in the pipeline within 1–3 miles? Heavy new supply typically softens prices + rents 12–24 months out; constrained supply supports both.
Investment metrics
- 1% rule
- 1.26% ✓
- Cap rate
- 10.56%
- Cash-on-cash
- 15.23%
- DSCR
- 1.68
- GRM
- 6.6
CMA / ARV
- ARV (on-the-fly)
- $102,225
- Comps found
- 12
Show comp detail 12 sales within ~0.75 mi
| Address | Dist | Beds/Ba | Sqft | Sold | Price | $/sf | Match |
|---|---|---|---|---|---|---|---|
| 5614 Sanborn Dr | 0.36mi | 3/1.0 | 1,120 (-5%) | 1mo | $104,999 | $94 | 75 |
| 6016 Dupree Ave | 0.21mi | 2/1.0 (-1) | 1,020 (-13%) | 3mo | $34,900 | $34 | 61 |
| 5545 Norway Dr | 0.66mi | 2/1.0 (-1) | 1,148 (-2%) | 0mo | $119,900 | $104 | 60 |
| 5616 Parchester Dr | 0.63mi | 3/1.0 | 1,102 (-6%) | 1mo | $84,900 | $77 | 59 |
| 1213 Haley Ave | 0.64mi | 3/2.5 | 1,196 (+2%) | 5mo | $95,000 | $79 | 57 |
| 7832 Dartmoor Dr | 0.47mi | 4/1.0 (+1) | 1,296 (+10%) | 3mo | $78,900 | $61 | 54 |
| 5547 Holborn Dr | 0.60mi | 3/1.0 | 1,032 (-12%) | 3mo | $69,900 | $68 | 49 |
| 7601 Bermuda Ct | 0.67mi | 3/2.0 | 1,092 (-7%) | 6mo | $165,000 | $151 | 48 |
| 5515 Holborn Dr | 0.68mi | 3/1.0 | 1,320 (+12%) | 3mo | $115,000 | $87 | 46 |
| 7735 Brand Ave | 0.38mi | 4/2.0 (+1) | 998 (-15%) | 6mo | $95,000 | $95 | 43 |
| 5520 Holborn Dr | 0.64mi | 2/2.0 (-1) | 1,032 (-12%) | 3mo | $124,000 | $120 | 38 |
| 120 Bernhardt Ave | 0.66mi | 2/2.0 (-1) | 1,002 (-15%) | 1mo | $74,900 | $75 | 35 |
Match score weights: distance 35% · size 25% · config 20% · recency 20%. Top-matched comps best support the ARV.
Projected returns pro-forma
-3.0% appreciation · 8.0% rent growth · sell at horizon
- IRR
- 11.2%
- Equity multiple
- 1.47×
- Total profit
- $13,747
- Equity at exit
- $15,656
- IRR
- 23.8%
- Equity multiple
- 3.53×
- Total profit
- $74,438
- Equity at exit
- $9,078
Cash invested: $29,400 (down + closing). Projections, not guarantees.
Landlord ↔ Tenant lean methodology
- Overall (STATE)
- 81 Strongly Landlord-Friendly
- State Missouri
- 81 Strongly Landlord-Friendly · R+10
- County
- — inherits STATE
- City
- — inherits STATE
ZIP-level market 63135
- Rents YoY
- 9.0%
- Active inventory
- 162
- Price-to-rent
- 6.6×
Monthly cashflow live
- Estimated rent
- $1,327 high interval (Pro) →
- Mortgage (P&I)
- −$551
- Tax from tax record
- −$81 /mo · $969/yr
- Insurance
- −$44
- HOA
- −$0
- Vacancy / Maint / Mgmt
- −$279
- Net cashflow
- $373
Break-even live
UW: 25.0% down · 7.5% · 30yr · 1.5% tax · 5.0% vac · 8.0% maint · 8.0% mgmt
Financing live
Cash to close
- Down payment
- $26,250
- Closing costs
- $3,150
- Reserves months
- —
- Total cash needed
- —
Loan-product check · same deal, 3 products live
Conventional
25% down · 7.5% · 30yr
- Down + closing
- —
- Monthly P&I
- —
- Monthly cashflow
- —
- DSCR
- —
- Eligible?
- —
Personal DTI + credit; lowest rate.
DSCR
20% down · 8.5% · 30yr
- Down + closing
- —
- Monthly P&I
- —
- Monthly cashflow
- —
- DSCR
- —
- Eligible?
- —
No personal income docs; deal must DSCR.
Hard money
10% down · 12.0% · 12mo
- Down + closing
- —
- Monthly P&I
- —
- Monthly cashflow
- —
- DSCR
- —
- Eligible?
- —
Short-term bridge; refi at stabilization.
Rent comps 40 comps
| Address | Beds | Baths | Sqft | Rent | $/sqft | DOM | Units | Dist |
|---|---|---|---|---|---|---|---|---|
| 5830 Bermuda Dr Unit 34C St. Louis, MO | 2.0 | 1.0 | 850 | $895 | $1.05 | 43d | 1 | 0.25mi |
| 5830 Bermuda Dr Unit 30B St. Louis, MO | 2.0 | 1.0 | 900 | $895 | $0.99 | 23d | 1 | 0.25mi |
| 6188 Dupree Ave Saint Louis, MO | 3.0 | 1.5 | 972 | $1,300 | $1.34 | 43d | 1 | 0.40mi |
| 5900 Sheriton Dr Saint Louis, MO | 3.0 | 1.0 | 864 | $1,050 | $1.22 | 23d | 1 | 0.40mi |
| 6170 Emerald Ave Saint Louis, MO | 3.0 | 1.0 | 1286 | $1,425 | $1.11 | 2d | 1 | 0.43mi |
| 6170 Emerald Ave Saint Louis, MO | 3.0 | 1.0 | 1286 | $1,500 | $1.17 | 14d | 1 | 0.43mi |
| 7816 Dartmoor Dr Saint Louis, MO | 3.0 | 1.0 | 950 | $1,195 | $1.26 | 43d | 1 | 0.44mi |
| 6180 Emerald Ave Saint Louis, MO | 2.0 | 1.0 | 729 | $1,300 | $1.78 | 43d | 1 | 0.46mi |
| 5925 Brand Ave Saint Louis, MO | 3.0 | 1.0 | 951 | $1,200 | $1.26 | 43d | 1 | 0.49mi |
| 7808 Winward Dr Saint Louis, MO | 3.0 | 1.0 | 1434 | $1,425 | $0.99 | 21d | 1 | 0.71mi |
| 846 Elsworth Pl Saint Louis, MO | 4.0 | 1.0 | 1352 | $1,600 | $1.18 | 4d | 1 | 0.81mi |
| 26 Arbor Village Ct Ferguson, MO | 1.0–2.0 | 1.0 | 714 | $950 | $1.33 | 23d | 1 | 0.82mi |
| 296 Meadowcrest Dr Saint Louis, MO | 3.0 | 1.0 | 960 | $1,550 | $1.61 | 14d | 1 | 0.83mi |
| 204 Hawkesbury Dr Saint Louis, MO | 2.0 | 1.0 | 849 | $1,250 | $1.47 | 4d | 1 | 0.87mi |
| 7420 Pleaseway Dr Saint Louis, MO | 2.0 | 1.0 | 952 | $1,250 | $1.31 | 21d | 1 | 0.91mi |
| 12 Lee Ave Saint Louis, MO | 2.0 | 1.0 | 832 | $1,080 | $1.30 | 7d | 1 | 0.92mi |
| 5613 Statler Ave Saint Louis, MO | 2.0 | 1.0 | 864 | $1,300 | $1.50 | 4d | 1 | 0.93mi |
| 7414 Pleaseway Dr Saint Louis, MO | 2.0 | 1.0 | 768 | $1,100 | $1.43 | 43d | 1 | 0.93mi |
| 249 S Hartnett Ave Saint Louis, MO | 3.0 | 1.0 | 960 | $1,220 | $1.27 | 23d | 1 | 0.94mi |
| 7441 Calvin Ave Saint Louis, MO | 3.0 | 1.0 | 1068 | $1,350 | $1.26 | 12d | 1 | 0.94mi |
| 617 Tesmore Pl Saint Louis, MO | 2.0 | 1.0 | 877 | $1,200 | $1.37 | 43d | 1 | 0.94mi |
| 110 Paul Ave Saint Louis, MO | 3.0 | 1.0 | 875 | $1,050 | $1.20 | 7d | 1 | 0.95mi |
| 7426 Calvin Ave Saint Louis, MO | 2.0 | 1.0 | 1100 | $1,125 | $1.02 | 17d | 1 | 0.97mi |
| 338 Saint Louis Ave Saint Louis, MO | 3.0 | 1.0 | 1200 | $1,200 | $1.00 | 43d | 1 | 0.99mi |
| 227 Meadowcrest Dr Saint Louis, MO | 3.0 | 1.0 | 960 | $1,500 | $1.56 | 43d | 1 | 1.00mi |
| 945 Edgehill Dr Saint Louis, MO | 3.0 | 1.0 | 1110 | $1,575 | $1.42 | 43d | 1 | 1.01mi |
| 7431 Esterbrook Dr Saint Louis, MO | 2.0 | 1.0 | 792 | $1,350 | $1.70 | 43d | 1 | 1.02mi |
| 2623 Avie Dr Saint Louis, MO | 3.0 | 2.0 | 921 | $1,350 | $1.47 | 43d | 1 | 1.05mi |
| 223 Wiegel Dr Saint Louis, MO | 3.0 | 1.0 | 864 | $1,560 | $1.81 | 12d | 1 | 1.05mi |
| 419 S Florissant Rd Ferguson, MO | 2.0 | 1.0 | 1100 | $1,200 | $1.09 | 43d | 1 | 1.05mi |
| 801 Thomas Ave Saint Louis, MO | 3.0 | 1.0 | 864 | $1,350 | $1.56 | 43d | 1 | 1.08mi |
| 1550 Northwinds Estates Dr St. Louis, MO | 1.0–2.0 | 1.0–1.5 | 877 | $1,050 | $1.20 | 43d | 1 | 1.09mi |
| 8908 Scottdale Ave Jennings, MO | 2.0 | 1.0 | 790 | $1,000 | $1.27 | 43d | 1 | 1.14mi |
| 5640 Sapphire Ave Saint Louis, MO | 2.0 | 1.0 | 900 | $1,100 | $1.22 | 43d | 1 | 1.17mi |
| 8408 Hill Ave Saint Louis, MO | 3.0 | 2.0 | 1040 | $1,550 | $1.49 | 23d | 1 | 1.17mi |
| 222 Randolph Ave Saint Louis, MO | 2.0 | 1.0 | 964 | $1,400 | $1.45 | 7d | 1 | 1.19mi |
| 104 Fenwick Dr Saint Louis, MO | 3.0 | 1.0 | 960 | $1,250 | $1.30 | 23d | 1 | 1.20mi |
| 7315 Albright Ave Saint Louis, MO | 3.0 | 1.0 | 888 | $1,150 | $1.30 | 43d | 1 | 1.20mi |
| 806 Marvin Ave Saint Louis, MO | 2.0 | 1.0 | 726 | $1,100 | $1.52 | 43d | 1 | 1.21mi |
| 2617 Hord Ave Saint Louis, MO | 2.0 | 1.0 | 800 | $775 | $0.97 | 4d | 1 | 1.21mi |
Listing history 21 events
-
2026-06-05statusdays on market $105,000 Pending 7 DOM
-
2026-06-03days on market $105,000 Active 6 DOM
-
2026-06-02days on market $105,000 Active 5 DOM
-
2026-06-01days on market $105,000 Active 4 DOM
-
2026-05-31days on market $105,000 Active 3 DOM
-
2026-05-28$105,000 Active
-
2023-12-01status Pending 212-char remark
Show marketing remark (212 chars)
TURN KEY RENTAL PROPERTY FOR YOUR PORTFOLIO! Cute ranch style home featuring living room, kitchen, possible dining area, three bedrooms and full bath on main level. Property sold as-is...Do not disturb tenants.
-
2023-11-29soldstatus Closed 212-char remark
Show marketing remark (212 chars)
TURN KEY RENTAL PROPERTY FOR YOUR PORTFOLIO! Cute ranch style home featuring living room, kitchen, possible dining area, three bedrooms and full bath on main level. Property sold as-is...Do not disturb tenants.
-
2023-10-31historical Active Under Contract 212-char remark
Show marketing remark (212 chars)
TURN KEY RENTAL PROPERTY FOR YOUR PORTFOLIO! Cute ranch style home featuring living room, kitchen, possible dining area, three bedrooms and full bath on main level. Property sold as-is...Do not disturb tenants.
-
2023-10-19$82,500 Active 212-char remark
Show marketing remark (212 chars)
TURN KEY RENTAL PROPERTY FOR YOUR PORTFOLIO! Cute ranch style home featuring living room, kitchen, possible dining area, three bedrooms and full bath on main level. Property sold as-is...Do not disturb tenants.
-
2020-06-18soldstatus $35,000
-
2020-04-14soldstatus $20,000
-
2018-10-02soldstatus $70,000
-
2015-03-10soldstatus $31,500
-
2013-05-06soldstatus $41,000
-
2013-02-21soldstatus 247-char remark
Show marketing remark (247 chars)
Cute and cozy 3 bedroom, 1 bath ranch on a large lot. Lots of curb appeal. Sold as-is. Purchase this property for as little as 3% down. This is a Fannie Mae HomePath property. This property is approved for HomePath Renovation Mortgage Financing.
-
2013-01-07$22,900 247-char remark
Show marketing remark (247 chars)
Cute and cozy 3 bedroom, 1 bath ranch on a large lot. Lots of curb appeal. Sold as-is. Purchase this property for as little as 3% down. This is a Fannie Mae HomePath property. This property is approved for HomePath Renovation Mortgage Financing.
-
2007-03-30soldstatus $37,300
-
2002-04-03soldstatus $57,900
-
2000-07-24soldstatus $40,000
-
1994-11-28soldstatus
ⓘ Source: listings_history table (triggers on properties + properties_extension) + one-shot
backfill from property_details.listing_events for pre-trigger history.
Tax reassessment forecast MO · Resets to sale price
- Current annual tax
- $969 · $81/mo
- Projected year-2 tax
- $1,018 · $85/mo
- Expected delta
- +$49/yr (+$4/mo · 5.1%)
ⓘ Screening estimate from a state-policy table — verify with the county assessor before closing.
Climate risk First Street
- Flood 1/10 Low FEMA zone X (unshaded) · 0% chance over 30 yrs
- Wildfire 1/10 Low
- Heat 5/10 Major 7 d/yr ≥107°F today · 20 d/yr by 30 yrs out
- Wind 2/10 Low 2% chance of damaging wind over 30 yrs
- Air quality 4/10 Moderate 4 unhealthy d/yr today · 5 by 30 yrs out
Nearby sold comps map
Loading sold comps map…
Walkable amenities ~0.75 mi
Loading nearby amenities…
Taxation est. · year 1
- Rental income
- $15,922
- − Mortgage interest
- −$5,882
- − Property taxes
- −$969
- − Insurance
- −$525
- − Repairs & maintenance
- −$1,274
- − Management
- −$1,274
- − Depreciation
- −$3,055
- Taxable income
- $2,944
- Est. tax owed @ 24.0%
- −$707
- After-tax cash flow
- $3,770/yr
For passive investors: Depreciation is non-cash, so a rental often shows a tax loss while cash-flowing — sheltering income. Rental losses are passive: they offset passive income freely, and up to $25,000/yr can offset ordinary (W-2) income if you actively participate and your MAGI is under $100k (phasing out to $0 by $150k); unused losses carry forward. On sale, claimed depreciation is recaptured at up to 25%, and gains may owe capital-gains tax (a 1031 exchange can defer both). Figures are a year-1 estimate at your 24.0% rate — not tax advice; consult a CPA.
Schools (NCES district)
- District
- Ferguson-Florissant R-II
- NCES district ID
- 2912010
- Math proficiency
- 7% ▼ -9.00%
- Reading proficiency
- 20% ▼ -6.00%
- Median HH income
- $44,610
- Composite
- 11.96/100
- National rank
- #9666
- State rank
- #311 of 324 in MO
Livability — Ferguson
- Score
- 58/100
- State rank
- #586
- US rank
- #20809
Category grades
Schools grade is shown separately in the Schools card above.
Census & demographics
- Census place
- Ferguson, MO
- County
- Saint Louis County · 888,823 people
- City population
- 18,381
- Metro
- St. Louis, MO-IL
- Population (ZIP)
- 18,381
- Household income
- $52,328
- Rent vs Own
- Severe rent burden
- 957.0
Population outlook (St. Louis County) Hauer SSP2
- Today (2025)
- 1,025,227 people
- By 2030
- 1,028,023 · +0.3%
- By 2040
- 1,020,940 · -0.4%
- By 2050
- 1,007,280 · -1.8%
- By 2075
- 987,277 · -3.7%
- By 2100
- 921,984 · -10.1%
Race, ethnicity, and origin ACS 2023
- Neighborhood character
- Predominantly Black (66%)
- Race & ethnicity
- Black 66% White 28% Two or more races 3% Hispanic / Latino 2%
- Common ancestry
- Lithuanian 1% Iranian 1% Romanian 1%
- Foreign-born
- 1% · Canada
- Languages at home
- 95% English-only · Spanish 4%
Political lean MEDSL · St. Louis
- 2024 margin
- Strong D (+23.4) · D 60.8% · R 37.4% · Other 1.7%
- 2008→2024 swing
- +3.5pp toward D · 2008: 19.9pp · 2024: 23.4pp
- All cycles
- 2024: D+23.4 2020: D+24.0 2016: D+16.2 2012: D+13.7 2008: D+19.9
Not yet ingested
- Civics
- —
Market trends
- HPI YoY
- ▼ -152.56%
- Current HPI
- 138.6781
- Rent YoY
- ▲ 9.03%
- Metro
- St. Louis, MO-IL
- State GDP YoY
- ▲ 1.84%
- F500 in state
- 20
Industry mix (Fortune 500 HQ in MO)
| Industry | F500 HQs | Revenue |
|---|---|---|
| Healthcare | 1 | $163B |
|
||
| Insurance | 1 | $21B |
|
||
| Industrial Technology | 1 | $17B |
|
||
| Retail | 1 | $16B |
|
||
| Industrial Distribution | 1 | $10B |
|
||
| Utilities | 1 | $9B |
|
||
Price history
+162.5% since first listed16 events — show timeline
- 2026-05-28 Listed $105,000 MARIS as Distributed by MLS Grid
- 2023-12-01 Pending — MARIS as Distributed by MLS Grid
- 2023-11-29 Sold (MLS) — MARIS as Distributed by MLS Grid
- 2023-10-31 Contingent — MARIS as Distributed by MLS Grid
- 2023-10-19 Listed $82,500 MARIS as Distributed by MLS Grid
- 2020-06-18 Sold (Public Records) $35,000 Public Records
- 2020-04-14 Sold (Public Records) $20,000 Public Records
- 2018-10-02 Sold (Public Records) $70,000 Public Records
- 2015-03-10 Sold (Public Records) $31,500 Public Records
- 2013-05-06 Sold (Public Records) $41,000 Public Records
- 2013-02-21 Sold (MLS) — MARIS as Distributed by MLS Grid
- 2013-01-07 Listed $22,900 MARIS as Distributed by MLS Grid
- 2007-03-30 Sold (Public Records) $37,300 Public Records
- 2002-04-03 Sold (Public Records) $57,900 Public Records
- 2000-07-24 Sold (Public Records) $40,000 Public Records
- 1994-11-28 Sold (Public Records) — Public Records
Property tax history
-2.1%/yrLatest (2022): $969 · +3.3% YoY. Source: county tax records.
Cash-flow waterfall
monthlySold comps — $/sqft
last 12 mo · ≤1 miLoading sold comps…