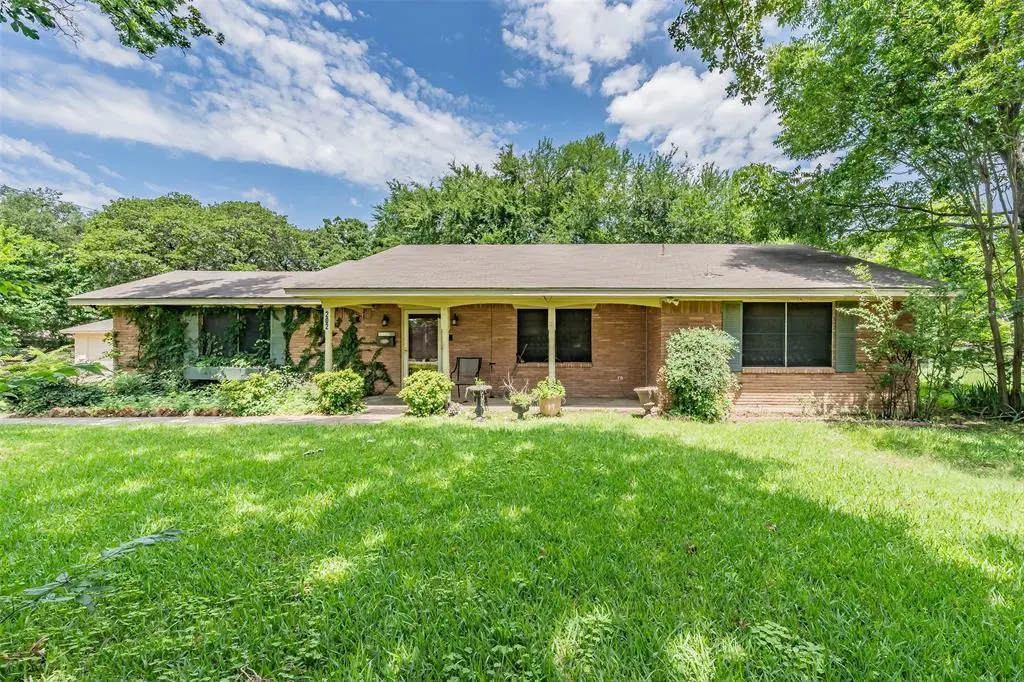
202 Mathis St · Seagoville, TX
Flood risk 1/10 · Minimal
- FEMA flood zone
- X (unshaded)
- Chance of flooding over 30 yrs
- 0.0%
- Est. flood insurance / yr
- $507 – $1,088
Fire risk 4/10 · Minor
- Est. fire insurance / yr
- $1,222 – $2,270
Heat risk 7/10 · Major
- Hot days now (above 110°F)
- 7 days/yr
- Hot days in 30 yrs
- 24 days/yr
Wind risk 6/10 · Moderate
- Chance of severe wind over 30 yrs
- 27.0%
Air-quality risk 2/10 · Minimal
- Unhealthy air days now
- 1 days/yr
- Unhealthy air days in 30 yrs
- 1 days/yr
Risk factors via First Street. Map © Google.
Why this score? — see what drove the C- grade
The composite is a weighted blend of 9 inputs, each scored 0–100. Each bar is that input's sub-score; the figure is the points it added to the 100-point composite (weight × sub-score).
- Cash flow +15.9/30.0
- ARV discount +15.0/15.0
- 1% rule +5.6/10.0
- DSCR +4.9/10.0
- Livability +3.6/5.0
- Schools +2.8/10.0
- Condition / age +2.5/5.0
- Rent growth +1.8/5.0
- Appreciation +0.0/10.0
$200,000
🖨 Deal sheet (PDF) 📄 Offer letter ✓ Due diligence
Listing remarks
Opportunity awaits on this spacious 0.88-acre treed lot in Seagoville. Nestled among mature trees and set back from the road with a long driveway, this property offers privacy, room to spread out, and plenty of potential for the next owner. The home features 3 bedrooms, 1.5 bathrooms, a living room, dining room, and kitchen, plus a converted attached garage that provides valuable bonus space for a second living area, game room, home office, or hobby room. A standout feature of the property is the oversized detached 2-car garage with additional space for storage, a workshop, or projects, offering flexibility for a variety of needs. The expansive lot provides ample room for outdoor activities
Key facts
- Long driveway
- 0.88 acre lot
- Mature trees
Tags
Property features AI
Finance
- Other: Possession at closing/funding; Listing is active and for sale
- Financial info: Listing terms include Cash, Conventional, FHA-203K; No second mortgage reported
- HOA & community: No homeowners association
Exterior
- Parking: 2 covered parking spaces; 2-car garage with automatic opener and double doors; Driveway
- Security: No surveillance devices present
- Utilities: City water; City sewer; Electricity connected; Individual gas meter; Not in a municipal utility district
- Home design: Single-family residence; Attached property; One story; Built in 1960; Brick construction; Shingle/composition roof; Slab foundation; Subdivision: J L Mathis
- Construction: Brick exterior; Shingle/composition roof; Slab foundation; Year built 1960
- Exterior features: Front porch; Rear porch; Large backyard with grass; Many trees; Level lot; Garage(s), storage, and workshop structures
Interior
- Kitchen: Dishwasher; Disposal; Electric cooktop; Electric oven; Built-in cabinets; Tile counters
- Bedrooms: 3 bedrooms (all on the main level); Primary bedroom with ensuite bath
- Flooring: Carpet; Laminate
- Bathrooms: 1 full bathroom; 1 half bathroom (powder room)
- Heating & cooling: Central heating (electric); Central air; Ceiling fans
- Interior features: High-speed internet available; Tile counters; Wainscoting; Two living areas; One dining area; 10 total rooms; One-level layout
- Laundry & utility: Full-size washer/dryer area; Washer hookup; Electric dryer hookup; Gas water heater
Neighborhood map
What this means for you Summary
Snapshot
- This is a 3-bed/1.5-bath single-family listed at $200k.
Deal economics
- At list price, monthly cash flow is $97 ($1k/yr) — positive.
- The deal already cash-flows at list — no discount required.
- Meets the 1% rule at list price ($2k rent vs $200k).
- Cap rate 6.9% vs local median 5.1% in Seagoville — top-decile yield for the area; either an underpriced asset or a hidden risk that comps aren't pricing in. Stress-test before assuming the spread holds.
Location & tenants
- Location reads 71/100 on livability (#319 in TX) — a middle-class / working-renter tenant base. Strengths: cost of living A+, housing A+, crime A; Watch: amenities F, commute F, health & safety D-.
- Dallas ISD (urban): math 31% / reading 36% proficiency, ranked #559 of 826 in TX (top 68%) — families likely to look elsewhere, expect single-tenant / working-renter base with shorter leases; 83% free/reduced lunch — lower-income household profile, screen leases tightly.
- Zoned schools: Seagoville El (math 19% / reading 24%, grade F, #3,470 of 4,322 statewide, top 81%, 607 students, 92% FRL); Seagoville Middle (math 18% / reading 23%, grade F, #1,407 of 1,662 statewide, top 86%, 1,419 students, 88% FRL); Seagoville H S (math 15% / reading 21%, grade F, #1,445 of 1,632 statewide, top 89%, 1,779 students, 87% FRL).
- Zoned-school proficiency averages 20% at this address vs 34% district-wide (-14 pts) — the specific schools serving this property underperform the Dallas ISD average; the district grade overstates school quality for this exact location.
- Market conditions: Rents soft (-2.9%/yr); 282 active listings in the ZIP; 14 comparable units currently listed for rent nearby; rentals leasing fast (median 10d on market — plan ~1-2 weeks tenant-placement turnaround); 12,577 units permitted in Dallas County in 2024 (6,829 in 5+ unit buildings).
- This rent runs 35% of the median local income ($73k/yr) — at the standard rent-burdened threshold; future hikes will face affordability resistance.
Forward outlook
- Local home prices are declining (-3.0%/yr); year-one equity from $1k of loan paydown is wiped out by about $6k of value loss. Plan a longer hold.
- Dallas County population projected at +35% by 2050 — long-run rental-demand tailwind backs the buy-and-hold thesis.
Negotiation context
- Only 10 days on market — expect competitive offers; lowballing is unlikely to land.
Risks & watch-outs
- Watch-outs: property tax is 2.6% of price.
- Climate carrying-cost: major wind risk, 27% chance of damaging wind over 30y; extreme-heat days projected 7→24/yr by 2055 (HVAC capex compounding) — expect insurance premiums to compound above CPI over the hold.
Questions for the listing agent
- Built in 1960 — when were the roof, HVAC, electrical panel, plumbing, and water heater last replaced?
- Property tax is high relative to price — has the assessment been appealed recently, and will the sale trigger a re-assessment?
- Is there a deadline driving the sale (1031 exchange, divorce, estate, relocation)? That informs how much negotiation room exists.
- Schools are D-rated, which usually means shorter tenancies and higher turnover. Who's the typical renter profile here, and what's been the actual vacancy rate?
- What's the average days-on-market for RENTAL listings here right now (not sales)? A rising rental-DOM trend means longer vacancies and softer asking-rent achievability than the comps imply.
- What's the recent tenant-quality profile in this submarket — average credit score on applications, eviction rate, late-payment / NSF rate, and stable-employment percentage? A property-management company in the area should have these aggregated.
- How much new for-sale + rental construction is in the pipeline within 1–3 miles? Heavy new supply typically softens prices + rents 12–24 months out; constrained supply supports both.
Investment metrics
- 1% rule
- 1.06% ✓
- Cap rate
- 6.87%
- Cash-on-cash
- 2.08%
- DSCR
- 1.09
- GRM
- 7.9
CMA / ARV
- ARV (on-the-fly)
- $257,873
- Comps found
- 12
Show comp detail 12 sales within ~0.75 mi
| Address | Dist | Beds/Ba | Sqft | Sold | Price | $/sf | Match |
|---|---|---|---|---|---|---|---|
| 107 W Adkins St | 0.17mi | 3/2.0 | 1,276 (-2%) | 2mo | $175,000 | $137 | 84 |
| 905 Howard St | 0.07mi | 3/2.0 | 1,313 (+0%) | 14mo | $174,000 | $133 | 83 |
| 912 Netherland Dr | 0.58mi | 3/2.0 | 1,289 (-2%) | 3mo | $295,000 | $229 | 66 |
| 206 Avenue C | 0.38mi | 3/1.0 | 1,221 (-7%) | 6mo | $134,000 | $110 | 64 |
| 709 Grandview Ave | 0.70mi | 3/2.0 | 1,292 (-1%) | 6mo | $255,000 | $197 | 58 |
| 1203 N Kaufman St | 0.24mi | 3/2.0 | 1,443 (+10%) | 16mo | $215,000 | $149 | 57 |
| 705 Grandview Ave | 0.68mi | 3/2.0 | 1,272 (-3%) | 7mo | $253,000 | $199 | 56 |
| 710 Grandview Ave | 0.72mi | 3/2.0 | 1,248 (-5%) | 13mo | $265,000 | $212 | 46 |
| 717 Fairview Ave | 0.75mi | 3/2.0 | 1,256 (-4%) | 14mo | $265,000 | $211 | 45 |
| 619 Judy Ln | 0.72mi | 3/1.5 | 1,278 (-2%) | 22mo | $249,900 | $196 | 44 |
| 518 Highland Dr | 0.55mi | 4/2.0 (+1) | 1,413 (+8%) | 15mo | $263,900 | $187 | 42 |
| 506 Jean Dr | 0.51mi | 3/1.5 | 1,139 (-13%) | 24mo | $254,900 | $224 | 35 |
Match score weights: distance 35% · size 25% · config 20% · recency 20%. Top-matched comps best support the ARV.
Projected returns pro-forma
-3.0% appreciation · 0.0% rent growth · sell at horizon
- IRR
- -16.8%
- Equity multiple
- 0.42×
- Total profit
- $-32,278
- Equity at exit
- $29,821
- IRR
- -16.5%
- Equity multiple
- 0.22×
- Total profit
- $-43,466
- Equity at exit
- $17,292
Cash invested: $56,000 (down + closing). Projections, not guarantees.
Landlord ↔ Tenant lean methodology
- Overall (STATE)
- 87 Strongly Landlord-Friendly
- State Texas
- 87 Strongly Landlord-Friendly · R+5
- County
- — inherits STATE
- City
- — inherits STATE
ZIP-level market 75159
- Home prices YoY
- -13.8%
- Rents YoY
- -2.9%
- Active inventory
- 282
- Price-to-rent
- 7.9×
Monthly cashflow live
- Estimated rent
- $2,110 high interval (Pro) →
- Mortgage (P&I)
- −$1,049
- Tax from tax record
- −$438 /mo · $5,258/yr
- Insurance
- −$83
- HOA
- −$0
- Vacancy / Maint / Mgmt
- −$443
- Net cashflow
- $97
Break-even live
Sensitivity live
| Price | -10% $210 | -5% $153 | +0% $97 | +5% $40 | +10% $-16 |
|---|---|---|---|---|---|
| Rent | -10% $-70 | -5% $13 | +0% $97 | +5% $180 | +10% $264 |
| Rate | -1.0pp $198 | -0.5pp $148 | base $97 | +0.5pp $45 | +1.0pp $-8 |
UW: 25.0% down · 7.5% · 30yr · 1.5% tax · 5.0% vac · 8.0% maint · 8.0% mgmt
Financing live
Cash to close
- Down payment
- $50,000
- Closing costs
- $6,000
- Reserves months
- —
- Total cash needed
- —
Loan-product check · same deal, 3 products live
Conventional
25% down · 7.5% · 30yr
- Down + closing
- —
- Monthly P&I
- —
- Monthly cashflow
- —
- DSCR
- —
- Eligible?
- —
Personal DTI + credit; lowest rate.
DSCR
20% down · 8.5% · 30yr
- Down + closing
- —
- Monthly P&I
- —
- Monthly cashflow
- —
- DSCR
- —
- Eligible?
- —
No personal income docs; deal must DSCR.
Hard money
10% down · 12.0% · 12mo
- Down + closing
- —
- Monthly P&I
- —
- Monthly cashflow
- —
- DSCR
- —
- Eligible?
- —
Short-term bridge; refi at stabilization.
Rent comps 14 comps
| Address | Beds | Baths | Sqft | Rent | $/sqft | DOM | Units | Dist |
|---|---|---|---|---|---|---|---|---|
| 1324 Bluffview Dr Unit C Seagoville, TX | 3.0 | 2.0 | 1150 | $1,295 | $1.13 | 26d | 1 | 0.59mi |
| 521 Jean Dr Seagoville, TX | 3.0 | 2.0 | 1080 | $1,825 | $1.69 | 4d | 1 | 0.60mi |
| 1610 Parkhaven Dr Seagoville, TX | 4.0 | 1.5 | 1450 | $1,695 | $1.17 | 16d | 1 | 0.65mi |
| 324 Greenhaven Dr Seagoville, TX | 4.0 | 2.0 | 1740 | $2,300 | $1.32 | 22d | 1 | 0.73mi |
| 1927 Churchill Downs Dr Seagoville, TX | 3.0 | 2.5 | 1707 | $2,300 | $1.35 | 3d | 1 | 0.96mi |
| 718 Dakota Ln Seagoville, TX | 3.0–5.0 | 2.0–2.5 | 2167 | $2,400 | $1.11 | 0d | 1 | 1.00mi |
| 813 Huddleston Ct Seagoville, TX | 3.0 | 2.0 | 1460 | $1,855 | $1.27 | 4d | 1 | 1.01mi |
| 108 US HWY Seagoville, TX | 1.0–3.0 | 1.0–2.5 | 1340 | $2,650 | $1.98 | 0d | 47 | 1.02mi |
| 108 U.S. 175 Frontage Rd Seagoville, TX | 2.0 | 2.0 | 1143 | $2,325 | $2.03 | 0d | 5 | 1.08mi |
| 1921 Belmont Dr Seagoville, TX | 4.0 | 2.0 | 1772 | $1,995 | $1.13 | 9d | 1 | 1.15mi |
| 1630 Emily Ln Seagoville, TX | 3.0 | 2.0 | 1546 | $1,849 | $1.20 | 9d | 1 | 1.17mi |
| 702 Catherine Ln Seagoville, TX | 3.0 | 1.0 | 945 | $1,650 | $1.75 | 45d | 1 | 1.22mi |
| 707 Shadybrook Ln Seagoville, TX | 3.0 | 2.0 | 1344 | $1,950 | $1.45 | 45d | 1 | 1.24mi |
| 1304 Riverview Ln Seagoville, TX | 3.0 | 2.0 | 1490 | $1,899 | $1.27 | 26d | 1 | 1.33mi |
Listing history 9 events
-
2026-06-08status $200,000 Pending 10 DOM
-
2026-06-07days on market $200,000 Active Option Contract 10 DOM
-
2026-06-04statusdays on market $200,000 Active Option Contract 7 DOM
-
2026-06-03days on market $200,000 Active 6 DOM
-
2026-06-02days on market $200,000 Active 5 DOM
-
2026-06-01days on market $200,000 Active 4 DOM
-
2026-05-31days on market $200,000 Active 3 DOM
-
2026-05-28$200,000 Active
-
2000-10-27soldstatus
ⓘ Source: listings_history table (triggers on properties + properties_extension) + one-shot
backfill from property_details.listing_events for pre-trigger history.
Tax reassessment forecast TX · Resets to sale price
- Current annual tax
- $5,258 · $438/mo
- Projected year-2 tax
- $5,258 · $438/mo
- Expected delta
- $0/yr ($0/mo · 0.0%)
ⓘ Screening estimate from a state-policy table — verify with the county assessor before closing.
Climate risk First Street
- Flood 1/10 Low FEMA zone X (unshaded) · 0% chance over 30 yrs
- Wildfire 4/10 Moderate
- Heat 7/10 Severe 7 d/yr ≥110°F today · 24 d/yr by 30 yrs out
- Wind 6/10 Major 27% chance of damaging wind over 30 yrs
- Air quality 2/10 Low 1 unhealthy d/yr today · 1 by 30 yrs out
Nearby sold comps map
Loading sold comps map…
Walkable amenities ~0.75 mi
Loading nearby amenities…
Taxation est. · year 1
- Rental income
- $25,323
- − Mortgage interest
- −$11,203
- − Property taxes
- −$5,258
- − Insurance
- −$1,000
- − Repairs & maintenance
- −$2,026
- − Management
- −$2,026
- − Depreciation
- −$5,818
- Taxable loss
- −$2,007
- Est. tax savings @ 24.0%
- +$482
- After-tax cash flow
- $1,644/yr
For passive investors: Depreciation is non-cash, so a rental often shows a tax loss while cash-flowing — sheltering income. Rental losses are passive: they offset passive income freely, and up to $25,000/yr can offset ordinary (W-2) income if you actively participate and your MAGI is under $100k (phasing out to $0 by $150k); unused losses carry forward. On sale, claimed depreciation is recaptured at up to 25%, and gains may owe capital-gains tax (a 1031 exchange can defer both). Figures are a year-1 estimate at your 24.0% rate — not tax advice; consult a CPA.
Schools (NCES district)
- District
- Dallas ISD
- NCES district ID
- 4816230
- Math proficiency
- 31% ▼ -16.00%
- Reading proficiency
- 36% ▼ -4.00%
- Median HH income
- $42,881
- Composite
- 28.41/100
- National rank
- #6763
- State rank
- #559 of 826 in TX
Livability — Seagoville
- Score
- 71/100
- State rank
- #319
- US rank
- #7103
Category grades
Schools grade is shown separately in the Schools card above.
Census & demographics
- Census place
- Seagoville, TX
- County
- Dallas County · 2,612,404 people
- City population
- 23,456
- Metro
- Dallas-Fort Worth-Arlington, TX
- Population (ZIP)
- 23,456
- Household income
- $72,897
- Rent vs Own
- Severe rent burden
- 422.0
Population outlook (Dallas County) Hauer SSP2
- Today (2025)
- 2,979,839 people
- By 2030
- 3,191,823 · +7.1%
- By 2040
- 3,619,611 · +21.5%
- By 2050
- 4,026,915 · +35.1%
- By 2075
- 4,957,073 · +66.4%
- By 2100
- 5,508,725 · +84.9%
Race, ethnicity, and origin ACS 2023
- Neighborhood character
- Diverse neighborhood (Simpson 0.66)
- Race & ethnicity
- Hispanic / Latino 46% White 32% Two or more races 20% Black 17%
- Hispanic origin (detail)
- Mexican 40%
- Common ancestry
- Romanian 1% Slovak 1% Italian 1%
- Foreign-born
- 17% · Canada, Jamaica
- Languages at home
- 63% English-only · Spanish 35%
Political lean MEDSL · Dallas
- 2024 margin
- Strong D (+22.2) · D 60.2% · R 38.0% · Other 1.8%
- 2008→2024 swing
- +6.9pp toward D · 2008: 15.3pp · 2024: 22.2pp
- All cycles
- 2024: D+22.2 2020: D+31.6 2016: D+26.2 2012: D+15.4 2008: D+15.3
Not yet ingested
- Civics
- —
Market trends
- HPI YoY
- ▼ -51.45%
- Current HPI
- 321.2065
- Rent YoY
- ▼ -2.86%
- Metro
- Dallas-Fort Worth-Arlington, TX
- State GDP YoY
- ▲ 3.95%
- F500 in state
- 110
Industry mix (Fortune 500 HQ in TX)
| Industry | F500 HQs | Revenue |
|---|---|---|
| Energy | 16 | $1,198B |
|
||
| Technology | 5 | $198B |
|
||
| Engineering / Construction | 4 | $72B |
|
||
| Energy Services | 3 | $60B |
|
||
| Utilities | 3 | $41B |
|
||
| Healthcare | 2 | $330B |
|
||
Price history
2 events — show timeline
- 2026-05-28 Listed $200,000 NTREIS
- 2000-10-27 Sold (Public Records) — Public Records
Property tax history
+7.7%/yrLatest (2025): $5,258 · -1.8% YoY. Source: county tax records.
Cash-flow waterfall
monthlySold comps — $/sqft
last 12 mo · ≤1 miLoading sold comps…