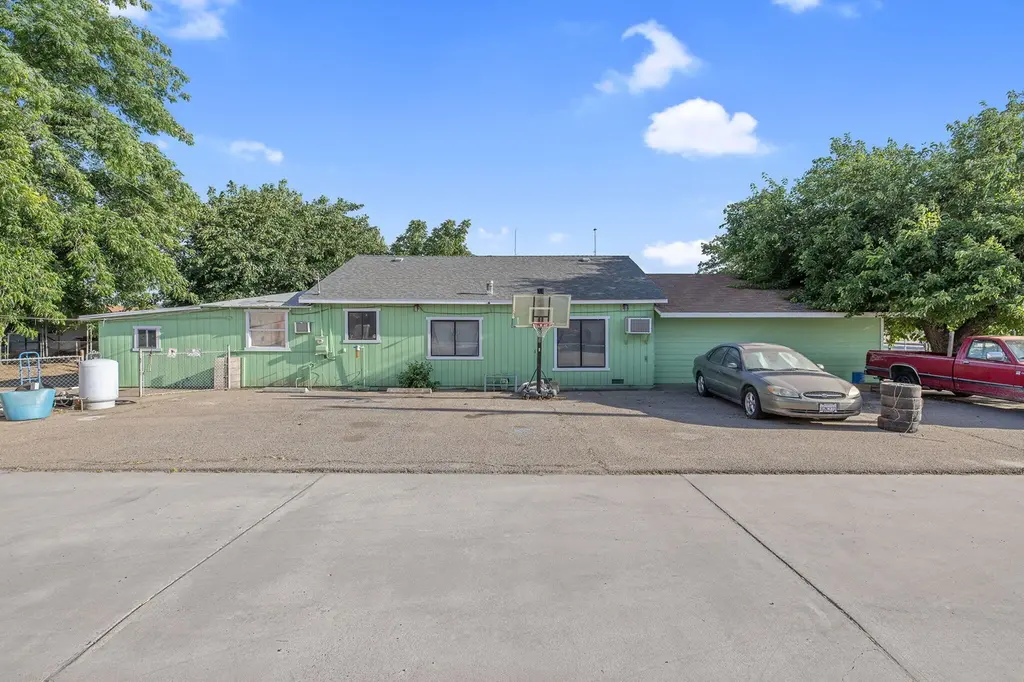
29060 Road 164 · Farmersville, CA
Flood risk 4/10 · Minor
- FEMA flood zone
- X (shaded)
- Chance of flooding over 30 yrs
- 0.22%
- Est. flood insurance / yr
- $507 – $1,088
Fire risk 5/10 · Moderate
- Est. fire insurance / yr
- $659 – $1,223
Heat risk 8/10 · Major
- Hot days now (above 105°F)
- 7 days/yr
- Hot days in 30 yrs
- 17 days/yr
Wind risk 1/10 · Minimal
- Chance of severe wind over 30 yrs
- —
Air-quality risk 10/10 · Severe
- Unhealthy air days now
- 44 days/yr
- Unhealthy air days in 30 yrs
- 50 days/yr
Risk factors via First Street. Map © Google.
Why this score? — see what drove the C grade
The composite is a weighted blend of 9 inputs, each scored 0–100. Each bar is that input's sub-score; the figure is the points it added to the 100-point composite (weight × sub-score).
- Cash flow +22.8/30.0
- ARV discount +15.0/15.0
- DSCR +7.3/10.0
- 1% rule +4.8/10.0
- Rent growth +3.0/5.0
- Livability +2.9/5.0
- Condition / age +2.5/5.0
- Schools +1.3/10.0
- Appreciation +0.0/10.0
$229,999
🖨 Deal sheet 📄 Offer letter ✓ Due diligence
Listing remarks
Welcome to this three-bedroom single residence located in Visalia, CA. Situated on a generous 17,424 square-foot lot, this property offers substantial outdoor space for various uses and potential. The home provides comfortable living quarters with three bedrooms to accommodate your residential needs. This is an excellent opportunity to own property in Visalia with ample land to explore possibilities for your future.
Key facts
- Generous lot
- Ample land
- Outdoor space
Tags
Property features AI
Exterior
- Parking: Attached or detached garage with 4 garage spaces
- Utilities: Private well water; Septic tank sewer; Electricity connected
- Home design: Single-family residence; One story; No shared/common walls
- Exterior features: Composition roof; Irregular lot of about 0.4 acres
Interior
- Kitchen: Microwave; Exhaust fan
- Flooring: Carpet; Wood; Combination flooring
- Bathrooms: One full bathroom
- Heating & cooling: Wall furnace heating; Exhaust fan for ventilation; Ceiling fans; Window air conditioning units
- Interior features: Microwave; Exhaust fan
Neighborhood map
What this means for you Summary
Snapshot
- This is a 3-bed/1.0-bath single-family listed at $230k.
Deal economics
- At list price, monthly cash flow is $402 ($5k/yr) — positive.
- The deal already cash-flows at list — no discount required.
- To meet the 1% rule (rent ≥ 1% of price), the offer needs to be $225k (2.0% below list).
- Recommended offer: $225k (2.0% below list) — sets the bar for 1% rule.
Location & tenants
- Location reads 58/100 on livability (#723 in CA) — a working-class tenant base; expect higher turnover. Strengths: commute A+, housing A+; Watch: crime D+, cost of living D+, schools F.
- Farmersville Unified (suburban): math 9% / reading 22% proficiency, ranked #492 of 517 in CA (top 95%) — low school quality limits family demand, transient renter base, plan for 1-2y turnover; 81% free/reduced lunch — lower-income household profile, screen leases tightly.
- Market conditions: Rents rising (+2.0%/yr); 309 active listings in the ZIP; 1 comparable units currently listed for rent nearby; solid renter incomes; 1,447 units permitted in Tulare County in 2024 (307 in 5+ unit buildings).
- This rent runs 33% of the median local income ($83k/yr) — at the standard rent-burdened threshold; future hikes will face affordability resistance.
Forward outlook
- Local home prices are declining (-3.0%/yr); year-one equity from $2k of loan paydown is wiped out by about $7k of value loss. Plan a longer hold.
- Tulare County population projected at +10% by 2050 — modest demand growth; plan on rents tracking national, not racing it.
Negotiation context
- Only 5 days on market — expect competitive offers; lowballing is unlikely to land.
- Current owner paid $45k; list at $230k implies a 411% gain — meaningful room to come down on a strong offer.
Risks & watch-outs
- Watch-outs: built in 1940 — expect roof / HVAC / electrical / plumbing capex.
- Climate carrying-cost: moderate wildfire risk; extreme-heat days projected 7→17/yr by 2055 (HVAC capex compounding) — expect insurance premiums to compound above CPI over the hold.
Questions for the listing agent
- Built in 1940 — when were the roof, HVAC, electrical panel, plumbing, and water heater last replaced?
- Is there a deadline driving the sale (1031 exchange, divorce, estate, relocation)? That informs how much negotiation room exists.
- Schools are F-rated, which usually means shorter tenancies and higher turnover. Who's the typical renter profile here, and what's been the actual vacancy rate?
- Crime grade is D in this area — have there been break-ins, vandalism, or insurance claims at this property in the last 3 years? What carrier currently insures it and at what premium?
- What's the average days-on-market for RENTAL listings here right now (not sales)? A rising rental-DOM trend means longer vacancies and softer asking-rent achievability than the comps imply.
- What's the recent tenant-quality profile in this submarket — average credit score on applications, eviction rate, late-payment / NSF rate, and stable-employment percentage? A property-management company in the area should have these aggregated.
- How much new for-sale + rental construction is in the pipeline within 1–3 miles? Heavy new supply typically softens prices + rents 12–24 months out; constrained supply supports both.
Investment metrics
- 1% rule
- 0.98% ✗
- Cap rate
- 8.39%
- Cash-on-cash
- 7.49%
- DSCR
- 1.33
- GRM
- 8.5
CMA / ARV
- ARV (on-the-fly)
- $323,400
- Comps found
- 10
Show comp detail 10 sales within ~0.75 mi
| Address | Dist | Beds/Ba | Sqft | Sold | Price | $/sf | Match |
|---|---|---|---|---|---|---|---|
| 391 Teddy St | 0.21mi | 3/2.0 | 1,285 (-3%) | 7mo | $340,000 | $265 | 76 |
| 722 W Marilyn Ct | 0.44mi | 3/2.0 | 1,313 (-0%) | 0mo | $340,000 | $259 | 74 |
| 394 Greg St | 0.21mi | 3/2.0 | 1,315 (-0%) | 18mo | $300,000 | $228 | 70 |
| 1643 Tehama Ave | 0.44mi | 3/2.0 | 1,367 (+4%) | 7mo | $347,000 | $254 | 64 |
| 16666 Teresa St | 0.33mi | 3/1.0 | 1,208 (-8%) | 17mo | $275,000 | $228 | 56 |
| 444 E Citrus Dr | 0.63mi | 3/2.0 | 1,386 (+5%) | 2mo | $338,000 | $244 | 56 |
| 1256 N Forest Pl | 0.61mi | 3/2.0 | 1,288 (-2%) | 13mo | $294,900 | $229 | 53 |
| 876 W Teddy St | 0.47mi | 3/2.0 | 1,267 (-4%) | 24mo | $325,000 | $257 | 47 |
| 1035 N Linnell Ave | 0.74mi | 3/1.0 | 1,182 (-10%) | 3mo | $290,000 | $245 | 46 |
| 1045 Farmersville Rd | 0.73mi | 3/2.0 | 1,236 (-6%) | 19mo | $287,000 | $232 | 35 |
Match score weights: distance 35% · size 25% · config 20% · recency 20%. Top-matched comps best support the ARV.
Projected returns pro-forma
-3.0% appreciation · 1.99% rent growth · sell at horizon
- IRR
- -5.9%
- Equity multiple
- 0.78×
- Total profit
- $-14,033
- Equity at exit
- $34,294
- IRR
- 2.5%
- Equity multiple
- 1.17×
- Total profit
- $11,239
- Equity at exit
- $19,886
Cash invested: $64,400 (down + closing). Projections, not guarantees.
Landlord ↔ Tenant lean methodology
- Overall (STATE)
- 18 Strongly Tenant-Friendly
- State California
- 18 Strongly Tenant-Friendly · D+13
- County
- — inherits STATE
- City
- — inherits STATE
ZIP-level market 93292
- Rents YoY
- 2.0%
- Active inventory
- 309
- Price-to-rent
- 8.5×
Monthly cashflow live
- Estimated rent
- $2,253 medium interval (Pro) →
- Mortgage (P&I)
- −$1,206
- Tax from tax record
- −$76 /mo · $912/yr
- Insurance
- −$96
- HOA
- −$0
- Vacancy / Maint / Mgmt
- −$473
- Net cashflow
- $402
Break-even live
UW: 25.0% down · 7.5% · 30yr · 1.5% tax · 5.0% vac · 8.0% maint · 8.0% mgmt
Financing live
Cash to close
- Down payment
- $57,500
- Closing costs
- $6,900
- Reserves months
- —
- Total cash needed
- —
Loan-product check · same deal, 3 products live
Conventional
25% down · 7.5% · 30yr
- Down + closing
- —
- Monthly P&I
- —
- Monthly cashflow
- —
- DSCR
- —
- Eligible?
- —
Personal DTI + credit; lowest rate.
DSCR
20% down · 8.5% · 30yr
- Down + closing
- —
- Monthly P&I
- —
- Monthly cashflow
- —
- DSCR
- —
- Eligible?
- —
No personal income docs; deal must DSCR.
Hard money
10% down · 12.0% · 12mo
- Down + closing
- —
- Monthly P&I
- —
- Monthly cashflow
- —
- DSCR
- —
- Eligible?
- —
Short-term bridge; refi at stabilization.
Rent comps 1 comps
| Address | Beds | Baths | Sqft | Rent | $/sqft | DOM | Units | Dist |
|---|---|---|---|---|---|---|---|---|
| 1896 N Matthew Ave Farmersville, CA | 3.0 | 2.0 | 1347 | $1,995 | $1.48 | 14d | 1 | 0.35mi |
Listing history 6 events
-
2026-06-18days on market $229,999 Active 5 DOM
-
2026-06-17days on market $229,999 Active 4 DOM
-
2026-06-16days on market $229,999 Active 3 DOM
-
2026-06-15days on market $229,999 Active 2 DOM
-
2026-06-14remarks 419-char remark
-
2026-06-14$229,999 Active 1 DOM
ⓘ Source: listings_history table (triggers on properties + properties_extension) + one-shot
backfill from property_details.listing_events for pre-trigger history.
Tax reassessment forecast CA · Resets to sale price
- Current annual tax
- $912 · $76/mo
- Projected year-2 tax
- $1,748 · $146/mo
- Expected delta
- +$836/yr (+$70/mo · 91.6%)
ⓘ Screening estimate from a state-policy table — verify with the county assessor before closing.
Climate risk First Street
- Flood 4/10 Moderate FEMA zone X (shaded) · 22% chance over 30 yrs
- Wildfire 5/10 Major
- Heat 8/10 Severe 7 d/yr ≥105°F today · 17 d/yr by 30 yrs out
- Wind 1/10 Low
- Air quality 10/10 Extreme 44 unhealthy d/yr today · 50 by 30 yrs out
Nearby sold comps map
Loading sold comps map…
Walkable amenities ~0.75 mi
Loading nearby amenities…
Taxation est. · year 1
- Rental income
- $27,037
- − Mortgage interest
- −$12,884
- − Property taxes
- −$912
- − Insurance
- −$1,150
- − Repairs & maintenance
- −$2,163
- − Management
- −$2,163
- − Depreciation
- −$6,691
- Taxable income
- $1,074
- Est. tax owed @ 24.0%
- −$258
- After-tax cash flow
- $4,565/yr
For passive investors: Depreciation is non-cash, so a rental often shows a tax loss while cash-flowing — sheltering income. Rental losses are passive: they offset passive income freely, and up to $25,000/yr can offset ordinary (W-2) income if you actively participate and your MAGI is under $100k (phasing out to $0 by $150k); unused losses carry forward. On sale, claimed depreciation is recaptured at up to 25%, and gains may owe capital-gains tax (a 1031 exchange can defer both). Figures are a year-1 estimate at your 24.0% rate — not tax advice; consult a CPA.
Schools (NCES district)
- District
- Farmersville Unified
- NCES district ID
- 0600035
- Math proficiency
- 9% ▼ -6.00%
- Reading proficiency
- 22% ▼ -5.00%
- Median HH income
- $34,388
- Composite
- 12.64/100
- National rank
- #9609
- State rank
- #492 of 517 in CA
Livability — Farmersville
- Score
- 58/100
- State rank
- #723
- US rank
- #21420
Category grades
Schools grade is shown separately in the Schools card above.
Census & demographics
- County
- Tulare County · 323,826 people
- City population
- 10,359
- Metro
- Visalia, CA
- Population (ZIP)
- 45,780
- Household income
- $82,872
- Rent vs Own
- Severe rent burden
- 962.0
Population outlook (Tulare County) Hauer SSP2
- Today (2025)
- 484,681 people
- By 2030
- 496,241 · +2.4%
- By 2040
- 518,507 · +7.0%
- By 2050
- 534,920 · +10.4%
- By 2075
- 548,417 · +13.2%
- By 2100
- 513,085 · +5.9%
Race, ethnicity, and origin ACS 2023
- Neighborhood character
- Diverse neighborhood (Simpson 0.56)
- Race & ethnicity
- Hispanic / Latino 57% White 35% Two or more races 19% Asian 3% Black 2% Native American 1%
- Hispanic origin (detail)
- Mexican 51%
- Common ancestry
- Russian 2% Lithuanian 2% Iranian 1%
- Foreign-born
- 14% · Canada
- Languages at home
- 63% English-only · Spanish 33% Other Indo-European 1% Korean 1%
Political lean MEDSL · Tulare
- 2024 margin
- Strong R (+20.7) · D 38.5% · R 59.2% · Other 2.3%
- 2008→2024 swing
- -5.4pp toward R · 2008: -15.3pp · 2024: -20.7pp
- All cycles
- 2024: R+20.7 2020: R+7.8 2016: R+12.1 2012: R+17.8 2008: R+15.3
Not yet ingested
- Civics
- —
Market trends
- HPI YoY
- ▼ -238.10%
- Current HPI
- 323.2649
- Rent YoY
- ▲ 1.99%
- Metro
- Visalia, CA
- State GDP YoY
- ▲ 3.21%
- F500 in state
- 116
Industry mix (Fortune 500 HQ in CA)
| Industry | F500 HQs | Revenue |
|---|---|---|
| Technology | 27 | $1,492B |
|
||
| Financial Services | 3 | $174B |
|
||
| Retail | 3 | $44B |
|
||
| Insurance | 3 | $26B |
|
||
| Media / Entertainment | 2 | $115B |
|
||
| Pharmaceuticals / Biotech | 2 | $62B |
|
||
Price history
+505.3% since first listed4 events — show timeline
- 2026-06-14 Price Changed $229,999 TCMLS
- 2026-06-12 Listed $299,999 TCMLS
- 2006-10-05 Sold (Public Records) $45,000 Public Records
- 1986-11-07 Sold (Public Records) $38,000 Public Records
Property tax history
+1.4%/yrLatest (2021): $912 · +1.4% YoY. Source: county tax records.
Cash-flow waterfall
monthlySold comps — $/sqft
last 12 mo · ≤1 miLoading sold comps…