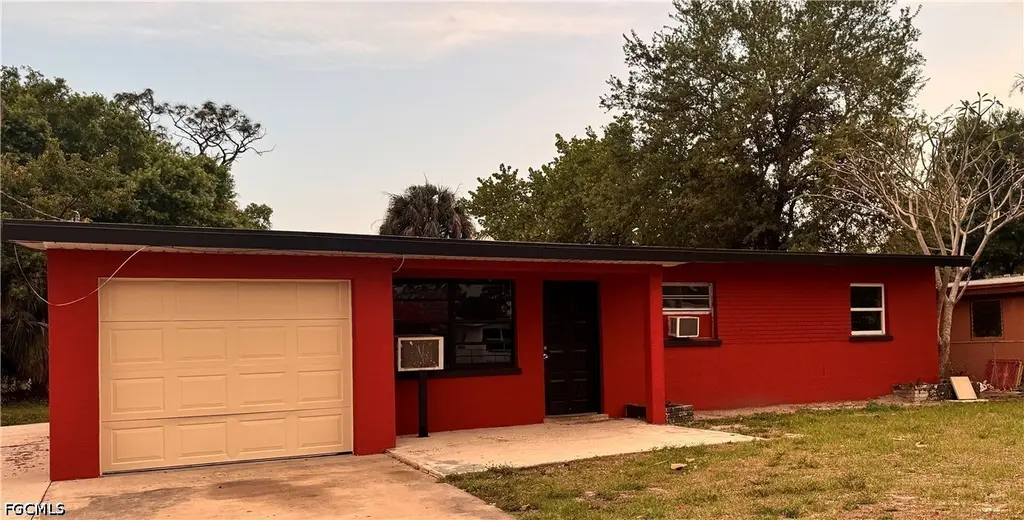
3268 C St E Unit na · Fort Myers, FL
Flood risk 1/10 · Minimal
- FEMA flood zone
- X (unshaded)
- Chance of flooding over 30 yrs
- 0.0%
- Est. flood insurance / yr
- $507 – $1,088
Fire risk 1/10 · Minimal
- Est. fire insurance / yr
- $947 – $1,759
Heat risk 10/10 · Severe
- Hot days now (above 107°F)
- 7 days/yr
- Hot days in 30 yrs
- 31 days/yr
Wind risk 10/10 · Severe
- Chance of severe wind over 30 yrs
- 99.0%
Air-quality risk 2/10 · Minimal
- Unhealthy air days now
- 1 days/yr
- Unhealthy air days in 30 yrs
- 1 days/yr
Risk factors via First Street. Map © Google.
Why this score? — see what drove the C- grade
The composite is a weighted blend of 9 inputs, each scored 0–100. Each bar is that input's sub-score; the figure is the points it added to the 100-point composite (weight × sub-score).
- Cash flow +25.5/30.0
- DSCR +8.4/10.0
- 1% rule +6.7/10.0
- Livability +4.3/5.0
- Schools +4.1/10.0
- Condition / age +3.8/5.0
- Rent growth +1.4/5.0
- ARV discount +0.0/15.0
- Appreciation +0.0/10.0
$145,500
🖨 Deal sheet (PDF) 📄 Offer letter ✓ Due diligence
Listing remarks
A home of your own. Tile Floors, new kitchen, newly renovated bath, move in ready, Nice family or investment on quiet cl-du-sac, easy to maintain, great first home or rental. 1 car garage, fenced yard, plenty of room for kids or pets.
Key facts
- Tile floors
- New kitchen
- Newly renovated bath
Tags
Property features AI
Finance
- Financial info: Pets allowed
- HOA & community: Non-gated community; No association fee
Exterior
- Parking: Attached 1-car garage
- Security: Smoke detector(s)
- Utilities: Cable not available; Sewer assessment paid; Water assessment paid
- Home design: Single-story; Faces north; Resale property
- Construction: Block, concrete and stucco construction; Rolled/hot mop roof
- Exterior features: Dead-end lot; South exposure; No additional exterior features listed
Interior
- Kitchen: Freezer; Range; Refrigerator
- Bedrooms: Bedroom on main level
- Flooring: Tile flooring
- Bathrooms: 1 full bathroom
- Heating & cooling: Wall cooling unit(s)
- Interior features: Vaulted ceilings; Eat-in kitchen; Tub with shower; Single-hung windows; Unfurnished
Neighborhood map
What this means for you Summary
Snapshot
- This is a 3-bed/1.0-bath single-family listed at $146k. Condition is rated good.
Deal economics
- At list price, monthly cash flow is $338 ($4k/yr) — positive.
- The deal already cash-flows at list — no discount required.
- Meets the 1% rule at list price ($2k rent vs $146k).
- Cap rate 9.1% vs local median 3.0% in Fort Myers — top-decile yield for the area; either an underpriced asset or a hidden risk that comps aren't pricing in. Stress-test before assuming the spread holds.
Location & tenants
- Location reads 86/100 on livability (#14 in FL, #383 nationally) — a professional / high-income tenant draw. Strengths: amenities A+, commute A+, housing A+.
- Lee (suburban): math 47% / reading 50% proficiency, ranked #42 of 73 in FL (top 58%) — families likely to look elsewhere, expect single-tenant / working-renter base with shorter leases.
- Market conditions: Rents falling (-4.3%/yr); 267 active listings in the ZIP; 40 comparable units currently listed for rent nearby; rentals at typical pace (median 22d on market — plan ~3-4 weeks tenant-placement turnaround); 15,411 units permitted in Lee County in 2024 (4,686 in 5+ unit buildings).
- This rent runs 39% of the median local income ($53k/yr) — at the standard rent-burdened threshold; future hikes will face affordability resistance.
Forward outlook
- Local home prices are declining (-3.0%/yr); year-one equity from $1k of loan paydown is wiped out by about $4k of value loss. Plan a longer hold.
- Lee County population projected at +44% by 2050 — long-run rental-demand tailwind backs the buy-and-hold thesis.
Negotiation context
- Only 9 days on market — expect competitive offers; lowballing is unlikely to land.
Risks & watch-outs
- Climate carrying-cost: severe wind risk, 99% chance of damaging wind over 30y; extreme-heat days projected 7→31/yr by 2055 (HVAC capex compounding) — expect insurance premiums to compound above CPI over the hold.
Questions for the listing agent
- Built in 1961 — when were the roof, HVAC, electrical panel, plumbing, and water heater last replaced?
- Is there a deadline driving the sale (1031 exchange, divorce, estate, relocation)? That informs how much negotiation room exists.
- What's the average days-on-market for RENTAL listings here right now (not sales)? A rising rental-DOM trend means longer vacancies and softer asking-rent achievability than the comps imply.
- What's the recent tenant-quality profile in this submarket — average credit score on applications, eviction rate, late-payment / NSF rate, and stable-employment percentage? A property-management company in the area should have these aggregated.
- How much new for-sale + rental construction is in the pipeline within 1–3 miles? Heavy new supply typically softens prices + rents 12–24 months out; constrained supply supports both.
Investment metrics
- 1% rule
- 1.17% ✓
- Cap rate
- 9.08%
- Cash-on-cash
- 9.95%
- DSCR
- 1.44
- GRM
- 7.1
CMA / ARV
- ARV (on-the-fly)
- $111,264
- Comps found
- 1
Show comp detail 1 sale within ~0.75 mi
| Address | Dist | Beds/Ba | Sqft | Sold | Price | $/sf | Match |
|---|---|---|---|---|---|---|---|
| 1543 Billie St | 0.47mi | 2/1.0 (-1) | 1,026 (+12%) | 16mo | $125,000 | $122 | 39 |
Match score weights: distance 35% · size 25% · config 20% · recency 20%. Top-matched comps best support the ARV.
Projected returns pro-forma
-3.0% appreciation · 0.0% rent growth · sell at horizon
- IRR
- -4.8%
- Equity multiple
- 0.83×
- Total profit
- $-7,019
- Equity at exit
- $21,695
- IRR
- 1.0%
- Equity multiple
- 1.06×
- Total profit
- $2,438
- Equity at exit
- $12,580
Cash invested: $40,740 (down + closing). Projections, not guarantees.
Landlord ↔ Tenant lean methodology
- Overall (STATE)
- 87 Strongly Landlord-Friendly
- State Florida
- 87 Strongly Landlord-Friendly · R+3
- County
- — inherits STATE
- City
- — inherits STATE
ZIP-level market 33916
- Home prices YoY
- -28.2%
- Rents YoY
- -4.3%
- Active inventory
- 267
- Price-to-rent
- 7.1×
Monthly cashflow live
- Estimated rent
- $1,700 high interval (Pro) →
- Mortgage (P&I)
- −$763
- Tax est. 1.5%
- −$182 /mo · $2,182/yr
- Insurance
- −$61
- HOA
- −$0
- Vacancy / Maint / Mgmt
- −$357
- Net cashflow
- $338
Break-even live
Sensitivity live
| Price | -10% $438 | -5% $388 | +0% $338 | +5% $288 | +10% $237 |
|---|---|---|---|---|---|
| Rent | -10% $203 | -5% $271 | +0% $338 | +5% $405 | +10% $472 |
| Rate | -1.0pp $411 | -0.5pp $375 | base $338 | +0.5pp $300 | +1.0pp $262 |
UW: 25.0% down · 7.5% · 30yr · 1.5% tax · 5.0% vac · 8.0% maint · 8.0% mgmt
Financing live
Cash to close
- Down payment
- $36,375
- Closing costs
- $4,365
- Reserves months
- —
- Total cash needed
- —
Loan-product check · same deal, 3 products live
Conventional
25% down · 7.5% · 30yr
- Down + closing
- —
- Monthly P&I
- —
- Monthly cashflow
- —
- DSCR
- —
- Eligible?
- —
Personal DTI + credit; lowest rate.
DSCR
20% down · 8.5% · 30yr
- Down + closing
- —
- Monthly P&I
- —
- Monthly cashflow
- —
- DSCR
- —
- Eligible?
- —
No personal income docs; deal must DSCR.
Hard money
10% down · 12.0% · 12mo
- Down + closing
- —
- Monthly P&I
- —
- Monthly cashflow
- —
- DSCR
- —
- Eligible?
- —
Short-term bridge; refi at stabilization.
Rent comps 40 comps
| Address | Beds | Baths | Sqft | Rent | $/sqft | DOM | Units | Dist |
|---|---|---|---|---|---|---|---|---|
| 3216 Dale St Fort Myers, FL | 2.0 | 1.0 | 886 | $1,650 | $1.86 | 3d | 1 | 0.10mi |
| 2103 French St Fort Myers, FL | 3.0 | 2.0 | 1100 | $1,900 | $1.73 | 24d | 1 | 0.30mi |
| 2103 French St Unit 2 Fort Myers, FL | 3.0 | 2.0 | 1100 | $1,800 | $1.64 | 24d | 1 | 0.30mi |
| 2103 French St Fort Myers, FL | 3.0 | 2.0 | 1100 | $1,800 | $1.64 | 2d | 1 | 0.30mi |
| 2103 French St Fort Myers, FL | 3.0 | 2.0 | 1100 | $1,800 | $1.64 | 2d | 1 | 0.30mi |
| 3323 Michigan Ave Fort Myers, FL | 3.0 | 2.0 | 1029 | $1,600 | $1.55 | 21d | 1 | 0.34mi |
| 3040 Douglas Ave Unit 3042 Fort Myers, FL | 2.0 | 1.0 | 800 | $1,150 | $1.44 | 3d | 1 | 0.34mi |
| 3042 Douglas Ave Fort Myers, FL | 2.0 | 1.0 | 640 | $1,150 | $1.80 | 14d | 1 | 0.34mi |
| 3042 Douglas Ave Fort Myers, FL | 2.0 | 1.0 | 640 | $1,150 | $1.80 | 3d | 1 | 0.34mi |
| 3041 2nd St Apt 2 Fort Myers, FL | 2.0 | 1.0 | 621 | $995 | $1.60 | 24d | 1 | 0.37mi |
| 3033 2nd St Unit 1 Fort Myers, FL | 2.0 | 1.0 | 582 | $1,350 | $2.32 | 24d | 1 | 0.38mi |
| 1919 Lillie St Unit H Fort Myers, FL | 2.0 | 1.0 | 829 | $1,400 | $1.69 | 24d | 1 | 0.38mi |
| 1919 Lillie St Unit F Fort Myers, FL | 2.0 | 1.0 | 829 | $1,400 | $1.69 | 16d | 1 | 0.38mi |
| 4051 Regata Way Fort Myers, FL | 1.0–3.0 | 1.0–2.0 | 987 | $2,021 | $2.05 | 3d | 34 | 0.39mi |
| 2147 Pauldo St Fort Myers, FL | 3.0 | 2.0 | 1088 | $1,395 | $1.28 | 24d | 1 | 0.51mi |
| 2955 Dunbar St Unit A Fort Myers, FL | 3.0 | 2.0 | 1111 | $2,300 | $2.07 | 3d | 1 | 0.53mi |
| 1759 Aquarius Ct Fort Myers, FL | 2.0 | 1.0 | 800 | $1,400 | $1.75 | 3d | 1 | 0.57mi |
| 1759 Aquarius Ct Fort Myers, FL | 2.0 | 1.0 | 800 | $1,400 | $1.75 | 15d | 1 | 0.57mi |
| 2930 Thomas St Fort Myers, FL | 2.0 | 1.0 | 550 | $1,600 | $2.91 | 16d | 1 | 0.63mi |
| 3608 Sammy Watkins Ave Fort Myers, FL | 2.0 | 1.0 | 650 | $1,200 | $1.85 | 24d | 1 | 0.64mi |
| 3608 Sammy Watkins Ave #2 Fort Myers, FL | 2.0 | 1.0 | 650 | $1,200 | $1.85 | 19d | 1 | 0.64mi |
| 1270 Allen St Unit B Fort Myers, FL | 3.0 | 2.0 | 1085 | $1,700 | $1.57 | 24d | 1 | 0.66mi |
| 2825 Palm Beach Blvd Fort Myers, FL | 1.0–3.0 | 1.5–2.5 | 990 | $2,200 | $2.22 | 11d | 7 | 0.83mi |
| 2885 Palm Beach Blvd #402 Fort Myers, FL | 2.0 | 2.0 | 938 | $1,850 | $1.97 | 14d | 1 | 0.83mi |
| 2885 Palm Beach Blvd #301 Fort Myers, FL | 2.0 | 2.0 | 835 | $1,650 | $1.98 | 14d | 1 | 0.83mi |
| 2885 Palm Beach Blvd #301 Fort Myers, FL | 2.0 | 2.0 | 835 | $1,650 | $1.98 | 14d | 1 | 0.83mi |
| 2885 Palm Beach Blvd #408 Fort Myers, FL | 2.0 | 2.0 | 835 | $1,675 | $2.01 | 24d | 1 | 0.83mi |
| 2885 Palm Beach Blvd #402 Fort Myers, FL | 2.0 | 2.0 | 938 | $1,850 | $1.97 | 14d | 1 | 0.83mi |
| 3000 Oasis Grand Blvd #2206 Fort Myers, FL | 2.0 | 2.0 | 898 | $1,750 | $1.95 | 21d | 1 | 0.84mi |
| 3000 Oasis Grand Blvd #3006 Fort Myers, FL | 2.0 | 2.0 | 1008 | $3,500 | $3.47 | 24d | 1 | 0.84mi |
| 2875 Palm Beach Blvd #206 Fort Myers, FL | 2.0 | 2.0 | 938 | $1,800 | $1.92 | 24d | 1 | 0.85mi |
| 216 Maria St Fort Myers, FL | 3.0 | 1.0 | 864 | $1,600 | $1.85 | 24d | 1 | 0.85mi |
| 1615 Evans Ave Unit 2 Fort Myers, FL | 2.0 | 1.0 | 795 | $1,199 | $1.51 | 24d | 1 | 0.86mi |
| 2610 Providence St Unit 3 Fort Myers, FL | 2.0 | 1.0 | 800 | $1,495 | $1.87 | 24d | 1 | 0.88mi |
| 2610 Providence St Unit 10 Fort Myers, FL | 2.0 | 1.0 | 750 | $1,495 | $1.99 | 21d | 1 | 0.88mi |
| 3040 Oasis Grand Blvd Fort Myers, FL | 1.0–4.0 | 1.0–2.0 | 1444 | $3,233 | $2.24 | 2d | 68 | 0.88mi |
| 221 Maria St Unit 225 Fort Myers, FL | 2.0 | 1.0 | 720 | $1,095 | $1.52 | 24d | 1 | 0.90mi |
| 227 Maria St Fort Myers, FL | 2.0 | 1.0 | 720 | $1,095 | $1.52 | 24d | 1 | 0.91mi |
| 2575 Second St Fort Myers, FL | 2.0 | 1.0 | 750 | $1,488 | $1.98 | 2d | 3 | 0.91mi |
| 3417 South St Fort Myers, FL | 3.0 | 2.0 | 1008 | $1,695 | $1.68 | 24d | 1 | 0.95mi |
Listing history 2 events
-
2026-05-21status Pending
-
2026-05-12$145,500 Active
ⓘ Source: listings_history table (triggers on properties + properties_extension) + one-shot
backfill from property_details.listing_events for pre-trigger history.
Climate risk First Street
- Flood 1/10 Low FEMA zone X (unshaded) · 0% chance over 30 yrs
- Wildfire 1/10 Low
- Heat 10/10 Extreme 7 d/yr ≥107°F today · 31 d/yr by 30 yrs out
- Wind 10/10 Extreme 99% chance of damaging wind over 30 yrs
- Air quality 2/10 Low 1 unhealthy d/yr today · 1 by 30 yrs out
Nearby sold comps map
Loading sold comps map…
Walkable amenities ~0.75 mi
Loading nearby amenities…
Taxation est. · year 1
- Rental income
- $20,405
- − Mortgage interest
- −$8,150
- − Property taxes
- −$2,182
- − Insurance
- −$728
- − Repairs & maintenance
- −$1,632
- − Management
- −$1,632
- − Depreciation
- −$4,233
- Taxable income
- $1,847
- Est. tax owed @ 24.0%
- −$443
- After-tax cash flow
- $3,610/yr
For passive investors: Depreciation is non-cash, so a rental often shows a tax loss while cash-flowing — sheltering income. Rental losses are passive: they offset passive income freely, and up to $25,000/yr can offset ordinary (W-2) income if you actively participate and your MAGI is under $100k (phasing out to $0 by $150k); unused losses carry forward. On sale, claimed depreciation is recaptured at up to 25%, and gains may owe capital-gains tax (a 1031 exchange can defer both). Figures are a year-1 estimate at your 24.0% rate — not tax advice; consult a CPA.
Condition & rehab AI · 7 photos
This home is in good condition with recent renovations, making it move-in ready and suitable for both resale and rental.
Value-add opportunities
- Both Paint exterior and interior — Fresh paint enhances curb appeal and interior aesthetics
- Both Replace ceiling fans with energy-efficient models — Modern fans improve air circulation and reduce energy costs
- Both Install smart home devices — Enhances home's appeal and can increase property value
Renovation cost estimate screening
Value-add ROI direction
- Both Paint exterior and interior — Fresh paint enhances curb appeal and interior aesthetics ↑
- Both Replace ceiling fans with energy-efficient models — Modern fans improve air circulation and reduce energy costs ↑
- Both Install smart home devices — Enhances home's appeal and can increase property value ↑
ⓘ Cost ranges are severity-bucket heuristics (US national rule-of-thumb). Get contractor quotes + a written scope before underwriting a rehab budget.
Schools (NCES district)
- District
- Lee
- NCES district ID
- 1201080
- Math proficiency
- 47% ▼ -11.00%
- Reading proficiency
- 50% ▼ -4.00%
- Median HH income
- $49,518
- Composite
- 41.49/100
- National rank
- #3458
- State rank
- #42 of 73 in FL
Livability — Fort Myers
- Score
- 86/100
- State rank
- #14
- US rank
- #383
Category grades
Schools grade is shown separately in the Schools card above.
Census & demographics
- Census place
- Fort Myers, FL
- County
- Lee County · 788,662 people
- City population
- 278,598
- Metro
- Cape Coral-Fort Myers, FL
- Population (ZIP)
- 27,943
- Household income
- $52,586
- Rent vs Own
- Severe rent burden
- 2324.0
Population outlook (Lee County) Hauer SSP2
- Today (2025)
- 871,946 people
- By 2030
- 955,468 · +9.6%
- By 2040
- 1,113,587 · +27.7%
- By 2050
- 1,256,891 · +44.1%
- By 2075
- 1,560,270 · +78.9%
- By 2100
- 1,726,848 · +98.0%
Race, ethnicity, and origin ACS 2023
- Neighborhood character
- Highly diverse neighborhood (Simpson 0.71)
- Race & ethnicity
- Black 34% Hispanic / Latino 30% White 28% Two or more races 21% Asian 2%
- Hispanic origin (detail)
- Mexican 5% Puerto Rican 6% Cuban 7% Dominican 1%
- Common ancestry
- Estonian 3% Hispanic 1% Romanian 1%
- Foreign-born
- 22% · Canada, Vietnam, China
- Languages at home
- 69% English-only · Spanish 24% Other Indo-European 4% French/Haitian/Cajun 1%
Political lean MEDSL · Lee
- 2024 margin
- Strong R (+28.4) · D 35.5% · R 63.9%
- 2008→2024 swing
- -18.0pp toward R · 2008: -10.4pp · 2024: -28.4pp
- All cycles
- 2024: R+28.4 2020: R+19.2 2016: R+20.4 2012: R+16.6 2008: R+10.4
Not yet ingested
- Civics
- —
Market trends
- HPI YoY
- ▼ -95.73%
- Current HPI
- 243.2657
- Rent YoY
- ▼ -4.30%
- Metro
- Cape Coral-Fort Myers, FL
- State GDP YoY
- ▲ 3.28%
- F500 in state
- 36
Industry mix (Fortune 500 HQ in FL)
| Industry | F500 HQs | Revenue |
|---|---|---|
| Industrial Technology | 2 | $29B |
|
||
| Insurance | 2 | $17B |
|
||
| Retail | 1 | $60B |
|
||
| Technology Distribution | 1 | $58B |
|
||
| Homebuilding | 1 | $35B |
|
||
| Technology Manufacturing | 1 | $35B |
|
||
Price history
2 events — show timeline
- 2026-05-21 Pending — FORTMLS
- 2026-05-12 Listed $145,500 FORTMLS
Cash-flow waterfall
monthlySold comps — $/sqft
last 12 mo · ≤1 miLoading sold comps…