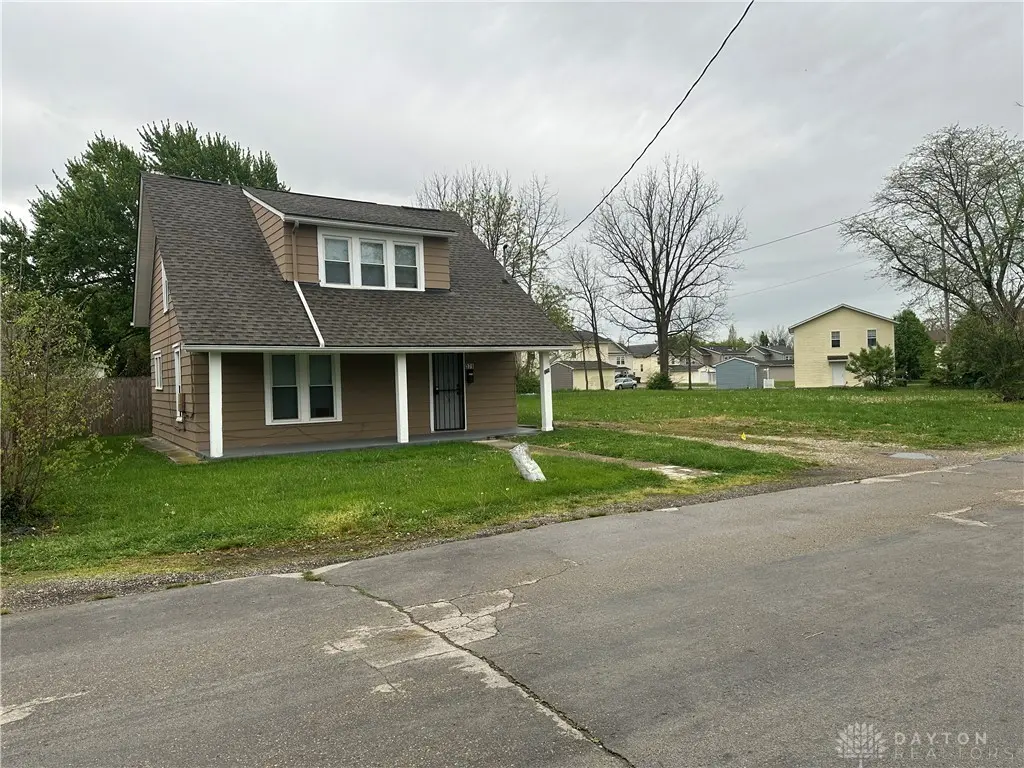
371 Hensel Ave · Springfield, OH
Flood risk 1/10 · Minimal
- FEMA flood zone
- X (unshaded)
- Chance of flooding over 30 yrs
- 0.0%
- Est. flood insurance / yr
- $473 – $860
Fire risk 1/10 · Minimal
- Est. fire insurance / yr
- $713 – $1,323
Heat risk 3/10 · Minor
- Hot days now (above 100°F)
- 7 days/yr
- Hot days in 30 yrs
- 18 days/yr
Wind risk 2/10 · Minimal
- Chance of severe wind over 30 yrs
- 0.0%
Air-quality risk 3/10 · Minor
- Unhealthy air days now
- 2 days/yr
- Unhealthy air days in 30 yrs
- 3 days/yr
Risk factors via First Street. Map © Google.
Why this score? — see what drove the C grade
The composite is a weighted blend of 9 inputs, each scored 0–100. Each bar is that input's sub-score; the figure is the points it added to the 100-point composite (weight × sub-score).
- Cash flow +30.0/30.0
- DSCR +10.0/10.0
- 1% rule +8.3/10.0
- Livability +2.8/5.0
- Rent growth +2.5/5.0
- Condition / age +2.5/5.0
- Schools +1.9/10.0
- ARV discount +0.0/15.0
- Appreciation +0.0/10.0
$104,900
🖨 Deal sheet (PDF) 📄 Offer letter ✓ Due diligence
Listing remarks MLS
Investor-focused opportunity with rental income already in place. This 3-bedroom Cape Cod is currently rented for 1100 per month and offers a strong list of major maintenance updates. With 1,183 square feet, a basement for easy storage, and a well-maintained overall condition, this property is positioned for buyers looking for a straightforward addition to their portfolio. Recent improvements include a new roof, new sump pump, new hot water heater, rebuilt furnace, and new kitchen cabinets—the kind of updates that help reduce capital expense and support more predictable ownership. Outside, the privacy-fenced backyard has usable outdoor space, and the vacant lot adjacent to the property provides added separation and a more open setting. Whether you are expanding your rental portfolio or securing your first single-family investment, this property offers existing rental income with many key updates already in place. Tenant occupied; please do not disturb tenants. Minimum 24-hour notice required for showings.
Key facts
- New sump pump
- New hot water heater
- New kitchen cabinets
Tags
Neighborhood map
What this means for you Summary
Snapshot
- This is a 3-bed/1.0-bath single-family listed at $105k.
Deal economics
- At list price, monthly cash flow is $410 ($5k/yr) — positive.
- The deal already cash-flows at list — no discount required.
- Meets the 1% rule at list price ($1k rent vs $105k).
- Recommended offer: $102k (3.0% below list) — sets the bar for market timing.
- Cap rate 11.0% vs local median 4.7% in Springfield — top-decile yield for the area; either an underpriced asset or a hidden risk that comps aren't pricing in. Stress-test before assuming the spread holds.
Location & tenants
- Location reads 56/100 on livability (#1,108 in OH) — a working-class tenant base; expect higher turnover. Strengths: cost of living A+, housing A+; Watch: crime F, amenities F, commute F.
- Springfield City School District (urban): math 20% / reading 27% proficiency, ranked #616 of 656 in OH (top 94%) — low school quality limits family demand, transient renter base, plan for 1-2y turnover; 75% free/reduced lunch — lower-income household profile, screen leases tightly.
- Market conditions: 158 active listings in the ZIP; 11 comparable units currently listed for rent nearby; rentals at typical pace (median 20d on market — plan ~3-4 weeks tenant-placement turnaround); lower-income renter base — watch delinquency; 232 units permitted in Clark County in 2024 (116 in 5+ unit buildings).
- This rent runs 38% of the median local income ($44k/yr) — at the standard rent-burdened threshold; future hikes will face affordability resistance.
Forward outlook
- Local home prices are declining (-3.0%/yr); year-one equity from $725 of loan paydown is wiped out by about $3k of value loss. Plan a longer hold.
- Clark County population projected at -16% by 2050 — secular population decline; favor cash flow + early exit over multi-decade hold.
- At projected returns (-3.0% appreciation + 3.0% rent growth), your $29k cash investment doubles in ~8 years — after that, you're playing with house money.
Negotiation context
- It's been on market 38 days — a 3% lower offer ($102k) is reasonable based on typical stale-listing flexibility.
- 3 sale attempts with the ask held roughly flat each time — persistent listings suggest the price (not the market) is what's stuck; bring a comps-based counter.
- Current owner paid $4k; list at $105k implies a 2697% gain — meaningful room to come down on a strong offer.
Risks & watch-outs
- Watch-outs: built in 1911 — expect roof / HVAC / electrical / plumbing capex.
Questions for the listing agent
- It's been on market 38 days. Have you received any prior offers? Is the seller open to a 3% concession, seller financing, or rate buy-down credit?
- Built in 1911 — when were the roof, HVAC, electrical panel, plumbing, and water heater last replaced?
- Is there a deadline driving the sale (1031 exchange, divorce, estate, relocation)? That informs how much negotiation room exists.
- Crime grade is F in this area — have there been break-ins, vandalism, or insurance claims at this property in the last 3 years? What carrier currently insures it and at what premium?
- What's the average days-on-market for RENTAL listings here right now (not sales)? A rising rental-DOM trend means longer vacancies and softer asking-rent achievability than the comps imply.
- What's the recent tenant-quality profile in this submarket — average credit score on applications, eviction rate, late-payment / NSF rate, and stable-employment percentage? A property-management company in the area should have these aggregated.
- How much new for-sale + rental construction is in the pipeline within 1–3 miles? Heavy new supply typically softens prices + rents 12–24 months out; constrained supply supports both.
Investment metrics
- 1% rule
- 1.33% ✓
- Cap rate
- 10.98%
- Cash-on-cash
- 16.73%
- DSCR
- 1.74
- GRM
- 6.2
CMA / ARV
- ARV (median comp)
- $70,367
- List price
- $104,900
- Delta
- 49.08%
- Verdict
- OVERPRICED
- Comps
- 20 within 1.0 mi
Show comp detail 12 sales within ~0.75 mi
| Address | Dist | Beds/Ba | Sqft | Sold | Price | $/sf | Match |
|---|---|---|---|---|---|---|---|
| 1820 Clay St | 0.04mi | 3/1.0 | 1,092 (-8%) | 2mo | $75,000 | $69 | 84 |
| 260 Indiana Ave | 0.30mi | 3/1.0 | 1,161 (-2%) | 0mo | $129,000 | $111 | 82 |
| 551 Georgia Ave | 0.12mi | 2/1.0 (-1) | 1,248 (+6%) | 7mo | $37,000 | $30 | 75 |
| 230 Rice St | 0.46mi | 2/1.0 (-1) | 1,208 (+2%) | 2mo | $40,000 | $33 | 68 |
| 1748 Kentucky Ave | 0.08mi | 2/1.0 (-1) | 1,008 (-15%) | 1mo | $75,000 | $74 | 66 |
| 650 E Southern Ave | 0.56mi | 3/1.0 | 1,144 (-3%) | 4mo | $72,500 | $63 | 65 |
| 305 Catherine St | 0.30mi | 3/1.5 | 1,272 (+8%) | 9mo | $143,000 | $112 | 64 |
| 115 W Auburn Ave | 0.69mi | 3/1.0 | 1,132 (-4%) | 8mo | $145,000 | $128 | 54 |
| 913 Tibbetts Ave | 0.71mi | 2/1.5 (-1) | 1,184 (+0%) | 9mo | $21,000 | $18 | 52 |
| 237 Sturgeon St | 0.74mi | 3/1.5 | 1,225 (+4%) | 6mo | $155,000 | $127 | 52 |
| 1111 Lafayete Ave | 0.75mi | 3/1.0 | 1,056 (-11%) | 2mo | $130,000 | $123 | 45 |
| 918 E Rose St | 0.52mi | 3/1.0 | 1,008 (-15%) | 9mo | $136,000 | $135 | 44 |
Match score weights: distance 35% · size 25% · config 20% · recency 20%. Top-matched comps best support the ARV.
Projected returns pro-forma
-3.0% appreciation · 3.0% rent growth · sell at horizon
- IRR
- 7.9%
- Equity multiple
- 1.31×
- Total profit
- $9,093
- Equity at exit
- $15,641
- IRR
- 17.2%
- Equity multiple
- 2.41×
- Total profit
- $41,525
- Equity at exit
- $9,070
Cash invested: $29,372 (down + closing). Projections, not guarantees.
Landlord ↔ Tenant lean methodology
- Overall (STATE)
- 73 Landlord-Friendly
- State Ohio
- 73 Landlord-Friendly · R+6
- County
- — inherits STATE
- City
- — inherits STATE
ZIP-level market 45505
- Home prices YoY
- -34.3%
- Active inventory
- 158
- Price-to-rent
- 6.2×
Monthly cashflow live
- Estimated rent
- $1,400 high interval (Pro) →
- Mortgage (P&I)
- −$550
- Tax from tax record
- −$102 /mo · $1,228/yr
- Insurance
- −$44
- HOA
- −$0
- Vacancy / Maint / Mgmt
- −$294
- Net cashflow
- $410
Break-even live
Sensitivity live
| Price | -10% $469 | -5% $439 | +0% $410 | +5% $380 | +10% $350 |
|---|---|---|---|---|---|
| Rent | -10% $299 | -5% $354 | +0% $410 | +5% $465 | +10% $520 |
| Rate | -1.0pp $462 | -0.5pp $436 | base $410 | +0.5pp $382 | +1.0pp $355 |
UW: 25.0% down · 7.5% · 30yr · 1.5% tax · 5.0% vac · 8.0% maint · 8.0% mgmt
Financing live
Cash to close
- Down payment
- $26,225
- Closing costs
- $3,147
- Reserves months
- —
- Total cash needed
- —
Loan-product check · same deal, 3 products live
Conventional
25% down · 7.5% · 30yr
- Down + closing
- —
- Monthly P&I
- —
- Monthly cashflow
- —
- DSCR
- —
- Eligible?
- —
Personal DTI + credit; lowest rate.
DSCR
20% down · 8.5% · 30yr
- Down + closing
- —
- Monthly P&I
- —
- Monthly cashflow
- —
- DSCR
- —
- Eligible?
- —
No personal income docs; deal must DSCR.
Hard money
10% down · 12.0% · 12mo
- Down + closing
- —
- Monthly P&I
- —
- Monthly cashflow
- —
- DSCR
- —
- Eligible?
- —
Short-term bridge; refi at stabilization.
Rent comps 11 comps
| Address | Beds | Baths | Sqft | Rent | $/sqft | DOM | Units | Dist |
|---|---|---|---|---|---|---|---|---|
| 421 Catherine St Springfield, OH | 3.0 | 2.0 | 1498 | $1,500 | $1.00 | 44d | 1 | 0.29mi |
| 313 E Rose St Springfield, OH | 3.0 | 1.0 | 828 | $1,200 | $1.45 | 24d | 1 | 0.38mi |
| 1306 S Limestone St Springfield, OH | 4.0 | 2.0 | 1452 | $1,695 | $1.17 | 22d | 1 | 0.54mi |
| 18 E Grand Ave Springfield, OH | 4.0 | 2.0 | 1452 | $1,575 | $1.08 | 20d | 1 | 0.72mi |
| 1452 S Wittenberg Ave Springfield, OH | 2.0 | 1.0 | 937 | $1,010 | $1.08 | 2d | 1 | 0.74mi |
| 830 Oak St Unit 830 Springfield, OH | 4.0 | 1.5 | 1400 | $1,250 | $0.89 | 15d | 1 | 0.92mi |
| 545 W Grand Ave Springfield, OH | 4.0 | 2.0 | 1456 | $1,595 | $1.10 | 4d | 1 | 1.19mi |
| 515 Ludlow Ave Springfield, OH | 3.0 | 1.0 | 1000 | $950 | $0.95 | 44d | 1 | 1.38mi |
| 524 W Pleasant St Springfield, OH | 4.0 | 2.0 | 1456 | $1,645 | $1.13 | 12d | 1 | 1.44mi |
| 306 S Plum St Springfield, OH | 4.0 | 2.0 | 1352 | $1,700 | $1.26 | 44d | 1 | 1.45mi |
| 523 W Mulberry St Springfield, OH | 4.0 | 2.0 | 1456 | $1,825 | $1.25 | 12d | 1 | 1.47mi |
Listing history 11 events
-
2026-05-11price $104,900 1026-char remark
Show marketing remark (1026 chars)
Investor-focused opportunity with rental income already in place. This 3-bedroom Cape Cod is currently rented for 1100 per month and offers a strong list of major maintenance updates. With 1,183 square feet, a basement for easy storage, and a well-maintained overall condition, this property is positioned for buyers looking for a straightforward addition to their portfolio. Recent improvements include a new roof, new sump pump, new hot water heater, rebuilt furnace, and new kitchen cabinets—the kind of updates that help reduce capital expense and support more predictable ownership. Outside, the privacy-fenced backyard has usable outdoor space, and the vacant lot adjacent to the property provides added separation and a more open setting. Whether you are expanding your rental portfolio or securing your first single-family investment, this property offers existing rental income with many key updates already in place. Tenant occupied; please do not disturb tenants. Minimum 24-hour notice required for showings.
-
2026-04-19$107,900 Active 1026-char remark
Show marketing remark (1026 chars)
Investor-focused opportunity with rental income already in place. This 3-bedroom Cape Cod is currently rented for 1100 per month and offers a strong list of major maintenance updates. With 1,183 square feet, a basement for easy storage, and a well-maintained overall condition, this property is positioned for buyers looking for a straightforward addition to their portfolio. Recent improvements include a new roof, new sump pump, new hot water heater, rebuilt furnace, and new kitchen cabinets—the kind of updates that help reduce capital expense and support more predictable ownership. Outside, the privacy-fenced backyard has usable outdoor space, and the vacant lot adjacent to the property provides added separation and a more open setting. Whether you are expanding your rental portfolio or securing your first single-family investment, this property offers existing rental income with many key updates already in place. Tenant occupied; please do not disturb tenants. Minimum 24-hour notice required for showings.
-
2025-05-25status Active
-
2025-05-17status Pending
-
2025-05-17historical
-
2025-04-05price $125,000
-
2025-04-05$140,000 Active
-
2025-04-03historical
-
2007-07-12soldstatus $3,750
-
2007-02-22soldstatus $12,000
-
1986-04-17soldstatus $8,000
ⓘ Source: listings_history table (triggers on properties + properties_extension) + one-shot
backfill from property_details.listing_events for pre-trigger history.
Tax reassessment forecast OH · Partial reset (capped growth)
- Current annual tax
- $1,228 · $102/mo
- Projected year-2 tax
- $1,432 · $119/mo
- Expected delta
- +$204/yr (+$17/mo · 16.6%)
ⓘ Screening estimate from a state-policy table — verify with the county assessor before closing.
Climate risk First Street
- Flood 1/10 Low FEMA zone X (unshaded) · 0% chance over 30 yrs
- Wildfire 1/10 Low
- Heat 3/10 Moderate 7 d/yr ≥100°F today · 18 d/yr by 30 yrs out
- Wind 2/10 Low 0% chance of damaging wind over 30 yrs
- Air quality 3/10 Moderate 2 unhealthy d/yr today · 3 by 30 yrs out
Nearby sold comps map
Loading sold comps map…
Walkable amenities ~0.75 mi
Loading nearby amenities…
Taxation est. · year 1
- Rental income
- $16,796
- − Mortgage interest
- −$5,876
- − Property taxes
- −$1,228
- − Insurance
- −$524
- − Repairs & maintenance
- −$1,344
- − Management
- −$1,344
- − Depreciation
- −$3,052
- Taxable income
- $3,429
- Est. tax owed @ 24.0%
- −$823
- After-tax cash flow
- $4,092/yr
For passive investors: Depreciation is non-cash, so a rental often shows a tax loss while cash-flowing — sheltering income. Rental losses are passive: they offset passive income freely, and up to $25,000/yr can offset ordinary (W-2) income if you actively participate and your MAGI is under $100k (phasing out to $0 by $150k); unused losses carry forward. On sale, claimed depreciation is recaptured at up to 25%, and gains may owe capital-gains tax (a 1031 exchange can defer both). Figures are a year-1 estimate at your 24.0% rate — not tax advice; consult a CPA.
Schools (NCES district)
- District
- Springfield City School District
- NCES district ID
- 3904481
- Math proficiency
- 20% ▼ -16.00%
- Reading proficiency
- 27% ▼ -12.00%
- Median HH income
- $32,541
- Composite
- 19.12/100
- National rank
- #8834
- State rank
- #616 of 656 in OH
Livability — Springfield
- Score
- 56/100
- State rank
- #1108
- US rank
- #22551
Category grades
Schools grade is shown separately in the Schools card above.
Census & demographics
- Census place
- Springfield, OH
- County
- Clark County · 33,261 people
- City population
- 33,261
- Metro
- Springfield, OH
- Population (ZIP)
- 19,826
- Household income
- $43,819
- Rent vs Own
- Severe rent burden
- 950.0
Population outlook (Clark County) Hauer SSP2
- Today (2025)
- 130,703 people
- By 2030
- 126,952 · -2.9%
- By 2040
- 118,344 · -9.5%
- By 2050
- 109,590 · -16.2%
- By 2075
- 89,464 · -31.6%
- By 2100
- 68,810 · -47.4%
Race, ethnicity, and origin ACS 2023
- Neighborhood character
- Predominantly White (75%)
- Race & ethnicity
- White 75% Black 14% Two or more races 7% Hispanic / Latino 4%
- Common ancestry
- Slovak 1% German 1% Iranian 1%
- Foreign-born
- 2% · Canada
- Languages at home
- 96% English-only · Spanish 2% French/Haitian/Cajun 1% German/W. Germanic 1%
Political lean MEDSL · Clark
- 2024 margin
- Strong R (+29.5) · D 34.8% · R 64.3%
- 2008→2024 swing
- -27.0pp toward R · 2008: -2.5pp · 2024: -29.5pp
- All cycles
- 2024: R+29.5 2020: R+23.3 2016: R+19.5 2012: R+1.8 2008: R+2.5
Not yet ingested
- Civics
- —
Market trends
- HPI YoY
- ▼ -135.16%
- Current HPI
- 258.9037
- Rent YoY
- —
- Metro
- Springfield, OH
- State GDP YoY
- ▲ 1.98%
- F500 in state
- 48
Industry mix (Fortune 500 HQ in OH)
| Industry | F500 HQs | Revenue |
|---|---|---|
| Insurance | 3 | $145B |
|
||
| Industrial Machinery | 3 | $49B |
|
||
| Financial Services | 3 | $24B |
|
||
| Consumer Goods | 2 | $93B |
|
||
| Aerospace / Defense | 2 | $47B |
|
||
| Utilities | 2 | $33B |
|
||
Price history
+1211.2% since first listed11 events — show timeline
- 2026-05-11 Price Changed $104,900 Dayton MLS
- 2026-04-19 Listed $107,900 Dayton MLS
- 2025-05-25 Relisted — CBRMLS
- 2025-05-17 Pending — CBRMLS
- 2025-05-17 Listing Removed — CBRMLS
- 2025-04-05 Price Changed $125,000 CBRMLS
- 2025-04-05 Listed $140,000 CBRMLS
- 2025-04-03 Coming Soon — CBRMLS
- 2007-07-12 Sold (Public Records) $3,750 Public Records
- 2007-02-22 Sold (Public Records) $12,000 Public Records
- 1986-04-17 Sold (Public Records) $8,000 Public Records
Property tax history
+9.0%/yrLatest (2025): $1,228 · +135.5% YoY. Source: county tax records.
Cash-flow waterfall
monthlySold comps — $/sqft
last 12 mo · ≤1 miLoading sold comps…