17 Commodore Ln · Sacramento, CA
Flood risk 1/10 · Minimal
- FEMA flood zone
- X (unshaded)
- Chance of flooding over 30 yrs
- 0.0%
- Est. flood insurance / yr
- $507 – $1,088
Fire risk 1/10 · Minimal
- Est. fire insurance / yr
- $659 – $1,223
Heat risk 7/10 · Major
- Hot days now (above 102°F)
- 7 days/yr
- Hot days in 30 yrs
- 15 days/yr
Wind risk 1/10 · Minimal
- Chance of severe wind over 30 yrs
- —
Air-quality risk 10/10 · Severe
- Unhealthy air days now
- 33 days/yr
- Unhealthy air days in 30 yrs
- 38 days/yr
Risk factors via First Street. Map © Google.
Why this score? — see what drove the B+ grade
The composite is a weighted blend of 9 inputs, each scored 0–100. Each bar is that input's sub-score; the figure is the points it added to the 100-point composite (weight × sub-score).
- Cash flow +30.0/30.0
- ARV discount +14.9/15.0
- 1% rule +10.0/10.0
- DSCR +10.0/10.0
- Livability +3.6/5.0
- Schools +3.2/10.0
- Condition / age +2.5/5.0
- Rent growth +1.8/5.0
- Appreciation +0.0/10.0
$135,000
🖨 Deal sheet 📄 Offer letter ✓ Due diligence
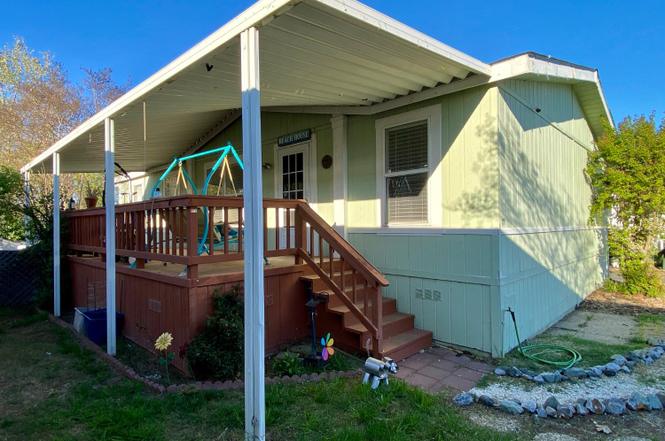
Listing remarks
Nestled in the desirable, gated all-ages Village Green Mobile Home Park, this sought-after 3-bedroom, 2-bath home combines comfort, function, and community in one inviting package. Vaulted ceilings and abundant natural light set the tone in the great room, where a generous living area flows seamlessly into a formal dining space, ideal for both everyday living and entertaining. The kitchen offers ample counter space and storage, an eat-at peninsula, and a separate dinette area perfect for casual meals. Newer LVP flooring runs throughout the main living areas, while a new HVAC unit ensures year-round comfort and efficiency. The smart split-bedroom layout places two bedrooms at the front of th
Key facts
- Gated community
- Ample counter space
- Walk-in closet
Tags
Property features AI
Finance
- Other: Located inside a gated community (directions available); Cross street: Village Circle; Address: 17 Commodore Ln, Sacramento, CA 95838
- Financial info: Land lease amount listed but property marked as not land-lease
- HOA & community: No homeowners association; Not a senior community; Not a land-lease property
Exterior
- Parking: Attached covered parking; no separate garage
- Utilities: Cable connected; Individual electric meter; Individual gas meter; 220V outlet in laundry; Public water; Public sewer
- Home design: Manufactured home (double wide) in a park; Built in 1998
- Construction: Composition roof; Wood skirting; Manufactured by Golden West
- Exterior features: Fenced lot; Covered parking
Interior
- Kitchen: Laminate countertops
- Bedrooms: 3 bedrooms
- Flooring: Carpet; Vinyl
- Bathrooms: 2 full bathrooms; Bathrooms include double sinks, tub, tub with shower over, and separate shower stall(s)
- Heating & cooling: Central heating; Central air conditioning; Ceiling fans
- Interior features: Cathedral/vaulted living room with attached deck; Laminate counters in kitchen; Pets allowed
- Laundry & utility: Laundry inside (dedicated room)
Neighborhood map
What this means for you Summary
Snapshot
- This is a 3-bed/2.0-bath manufactured listed at $135k.
Deal economics
- At list price, monthly cash flow is $910 ($11k/yr) — positive.
- The deal already cash-flows at list — no discount required.
- Meets the 1% rule at list price ($2k rent vs $135k).
- Recommended offer: $123k (9.0% below list) — sets the bar for market timing.
- Cap rate 14.4% vs local median 3.0% in Sacramento — top-decile yield for the area; either an underpriced asset or a hidden risk that comps aren't pricing in. Stress-test before assuming the spread holds.
Location & tenants
- Location reads 71/100 on livability (#218 in CA) — a middle-class / working-renter tenant base. Strengths: amenities A+, commute A+, housing A; Watch: schools D+, crime F, cost of living F.
- Robla Elementary (urban): math 29% / reading 38% proficiency, ranked #923 of 1,400 in CA (top 66%) — families likely to look elsewhere, expect single-tenant / working-renter base with shorter leases; 77% free/reduced lunch — lower-income household profile, screen leases tightly.
- Market conditions: Rents soft (-2.7%/yr); 162 active listings in the ZIP; 8 comparable units currently listed for rent nearby; rentals leasing fast (median 2d on market — plan ~1-2 weeks tenant-placement turnaround); 6,825 units permitted in Sacramento County in 2024 (1,752 in 5+ unit buildings).
- This rent runs 41% of the median local income ($68k/yr) — at the standard rent-burdened threshold; future hikes will face affordability resistance.
Forward outlook
- Local home prices are declining (-3.0%/yr); year-one equity from $933 of loan paydown is wiped out by about $4k of value loss. Plan a longer hold.
- Sacramento County population projected at +17% by 2050 — long-run rental-demand tailwind backs the buy-and-hold thesis.
- At projected returns (-3.0% appreciation + 0.0% rent growth), your $38k cash investment doubles in ~5 years — after that, you're playing with house money.
Negotiation context
- It's been on market 97 days — a 9% lower offer ($123k) is reasonable based on typical stale-listing flexibility.
Risks & watch-outs
- Climate carrying-cost: extreme-heat days projected 7→15/yr by 2055 (HVAC capex compounding) — expect insurance premiums to compound above CPI over the hold.
Questions for the listing agent
- It's been on market 97 days. Have you received any prior offers? Is the seller open to a 9% concession, seller financing, or rate buy-down credit?
- Why hasn't it sold? Are there any deal-killer items the seller is aware of (foundation, flood, title, zoning, code violations)?
- Is there a deadline driving the sale (1031 exchange, divorce, estate, relocation)? That informs how much negotiation room exists.
- Schools are D-rated, which usually means shorter tenancies and higher turnover. Who's the typical renter profile here, and what's been the actual vacancy rate?
- Crime grade is F in this area — have there been break-ins, vandalism, or insurance claims at this property in the last 3 years? What carrier currently insures it and at what premium?
- What's the average days-on-market for RENTAL listings here right now (not sales)? A rising rental-DOM trend means longer vacancies and softer asking-rent achievability than the comps imply.
- What's the recent tenant-quality profile in this submarket — average credit score on applications, eviction rate, late-payment / NSF rate, and stable-employment percentage? A property-management company in the area should have these aggregated.
- How much new for-sale + rental construction is in the pipeline within 1–3 miles? Heavy new supply typically softens prices + rents 12–24 months out; constrained supply supports both.
Investment metrics
- 1% rule
- 1.73% ✓
- Cap rate
- 14.38%
- Cash-on-cash
- 28.89%
- DSCR
- 2.29
- GRM
- 4.8
CMA / ARV
- ARV (on-the-fly)
- $161,745
- Comps found
- 10
Show comp detail 10 sales within ~0.75 mi
| Address | Dist | Beds/Ba | Sqft | Sold | Price | $/sf | Match |
|---|---|---|---|---|---|---|---|
| 152 Village Cir #152 | 0.18mi | 3/2.0 | 1,344 (+2%) | 8mo | $125,000 | $93 | 82 |
| 88 Village Cir | 0.26mi | 3/2.0 | 1,248 (-5%) | 0mo | $136,900 | $110 | 79 |
| 216 Village Cir #216 | 0.14mi | 3/2.0 | 1,152 (-12%) | 5mo | $82,000 | $71 | 69 |
| 4 Commodore Ct | 0.06mi | 3/2.0 | 1,440 (+10%) | 20mo | $187,500 | $130 | 65 |
| 194 Village Cir | 0.18mi | 3/2.0 | 1,440 (+10%) | 13mo | $187,000 | $130 | 65 |
| 110 Village Cicle | 0.27mi | 3/2.0 | 1,440 (+10%) | 10mo | $98,000 | $68 | 63 |
| 62 Kit Ln | 0.19mi | 2/2.0 (-1) | 1,344 (+2%) | 23mo | $110,000 | $82 | 63 |
| 81 Village Cir | 0.26mi | 3/2.0 | 1,400 (+6%) | 24mo | $212,900 | $152 | 57 |
| 135 Village Cir | 0.24mi | 3/2.0 | 1,440 (+10%) | 22mo | $210,000 | $146 | 55 |
| 197 Village Cir | 0.11mi | 3/2.0 | 1,142 (-13%) | 22mo | $140,000 | $123 | 54 |
Match score weights: distance 35% · size 25% · config 20% · recency 20%. Top-matched comps best support the ARV.
Projected returns pro-forma
-3.0% appreciation · 0.0% rent growth · sell at horizon
- IRR
- 19.8%
- Equity multiple
- 1.77×
- Total profit
- $29,281
- Equity at exit
- $20,129
- IRR
- 25.9%
- Equity multiple
- 2.95×
- Total profit
- $73,851
- Equity at exit
- $11,672
Cash invested: $37,800 (down + closing). Projections, not guarantees.
Landlord ↔ Tenant lean methodology
- Overall (STATE)
- 18 Strongly Tenant-Friendly
- State California
- 18 Strongly Tenant-Friendly · D+13
- County
- — inherits STATE
- City
- — inherits STATE
ZIP-level market 95838
- Rents YoY
- -2.7%
- Active inventory
- 162
- Price-to-rent
- 4.8×
Monthly cashflow live
- Estimated rent
- $2,333 high interval (Pro) →
- Mortgage (P&I)
- −$708
- Tax est. 1.5%
- −$169 /mo · $2,025/yr
- Insurance
- −$56
- HOA
- −$0
- Vacancy / Maint / Mgmt
- −$490
- Net cashflow
- $910
Break-even live
UW: 25.0% down · 7.5% · 30yr · 1.5% tax · 5.0% vac · 8.0% maint · 8.0% mgmt
Financing live
Cash to close
- Down payment
- $33,750
- Closing costs
- $4,050
- Reserves months
- —
- Total cash needed
- —
Loan-product check · same deal, 3 products live
Conventional
25% down · 7.5% · 30yr
- Down + closing
- —
- Monthly P&I
- —
- Monthly cashflow
- —
- DSCR
- —
- Eligible?
- —
Personal DTI + credit; lowest rate.
DSCR
20% down · 8.5% · 30yr
- Down + closing
- —
- Monthly P&I
- —
- Monthly cashflow
- —
- DSCR
- —
- Eligible?
- —
No personal income docs; deal must DSCR.
Hard money
10% down · 12.0% · 12mo
- Down + closing
- —
- Monthly P&I
- —
- Monthly cashflow
- —
- DSCR
- —
- Eligible?
- —
Short-term bridge; refi at stabilization.
Rent comps 8 comps
| Address | Beds | Baths | Sqft | Rent | $/sqft | DOM | Units | Dist |
|---|---|---|---|---|---|---|---|---|
| 3720 Astoria St Unit 8 Sacramento, CA | 2.0 | 1.0 | 950 | $1,395 | $1.47 | 1d | 1 | 0.79mi |
| 4426 Dry Creek Rd Sacramento, CA | 3.0 | 2.5 | 1408 | $2,700 | $1.92 | 1d | 1 | 0.90mi |
| 1138 North Ave Unit A Sacramento, CA | 3.0 | 2.0 | 900 | $2,000 | $2.22 | 1d | 1 | 1.07mi |
| 4015 May St Sacramento, CA | 2.0 | 1.5 | 875 | $1,850 | $2.11 | 23d | 1 | 1.20mi |
| 3829 Belden St Sacramento, CA | 2.0 | 2.0 | 1001 | $2,126 | $2.12 | 43d | 1 | 1.22mi |
| 917 Blaine Ave Sacramento, CA | 4.0 | 2.0 | 1558 | $3,000 | $1.93 | 1d | 1 | 1.22mi |
| 3226 Pilgrim Ct Sacramento, CA | 3.0 | 1.0 | 1300 | $2,700 | $2.08 | 1d | 1 | 1.31mi |
| 3231 Del Mar Way Sacramento, CA | 3.0 | 1.0 | 1380 | $2,095 | $1.52 | 16d | 1 | 1.49mi |
Listing history 12 events
-
2026-06-18days on market $135,000 Active 97 DOM
-
2026-06-17days on market $135,000 Active 96 DOM
-
2026-06-16days on market $135,000 Active 95 DOM
-
2026-06-15days on market $135,000 Active 94 DOM
-
2026-06-13pricedays on market $135,000 Active 92 DOM
-
2026-06-09days on market $144,000 Active 88 DOM
-
2026-06-08days on market $144,000 Active 87 DOM
-
2026-06-07days on market $144,000 Active 86 DOM
-
2026-06-03days on market $144,000 Active 82 DOM
-
2026-06-02days on market $144,000 Active 81 DOM
-
2026-06-01days on market $144,000 Active 80 DOM
-
2026-05-31days on market $144,000 Active 79 DOM
ⓘ Source: listings_history table (triggers on properties + properties_extension) + one-shot
backfill from property_details.listing_events for pre-trigger history.
Climate risk First Street
- Flood 1/10 Low FEMA zone X (unshaded) · 0% chance over 30 yrs
- Wildfire 1/10 Low
- Heat 7/10 Severe 7 d/yr ≥102°F today · 15 d/yr by 30 yrs out
- Wind 1/10 Low
- Air quality 10/10 Extreme 33 unhealthy d/yr today · 38 by 30 yrs out
Nearby sold comps map
Loading sold comps map…
Walkable amenities ~0.75 mi
Loading nearby amenities…
Taxation est. · year 1
- Rental income
- $27,994
- − Mortgage interest
- −$7,562
- − Property taxes
- −$2,025
- − Insurance
- −$675
- − Repairs & maintenance
- −$2,240
- − Management
- −$2,240
- − Depreciation
- −$3,927
- Taxable income
- $9,326
- Est. tax owed @ 24.0%
- −$2,238
- After-tax cash flow
- $8,682/yr
For passive investors: Depreciation is non-cash, so a rental often shows a tax loss while cash-flowing — sheltering income. Rental losses are passive: they offset passive income freely, and up to $25,000/yr can offset ordinary (W-2) income if you actively participate and your MAGI is under $100k (phasing out to $0 by $150k); unused losses carry forward. On sale, claimed depreciation is recaptured at up to 25%, and gains may owe capital-gains tax (a 1031 exchange can defer both). Figures are a year-1 estimate at your 24.0% rate — not tax advice; consult a CPA.
Schools (NCES district)
- District
- Robla Elementary
- NCES district ID
- 0633240
- Math proficiency
- 29% ▲ 1.00%
- Reading proficiency
- 38% ▲ 3.00%
- Median HH income
- $48,481
- Composite
- 31.64/100
- National rank
- #11126
- State rank
- #923 of 1400 in CA
Livability — Sacramento
- Score
- 71/100
- State rank
- #218
- US rank
- #6957
Category grades
Schools grade is shown separately in the Schools card above.
Census & demographics
- Census place
- Sacramento, CA
- County
- Sacramento County · 1,539,646 people
- City population
- 761,410
- Metro
- Sacramento-Roseville-Folsom, CA
- Population (ZIP)
- 40,677
- Household income
- $68,349
- Rent vs Own
- Severe rent burden
- 1834.0
Population outlook (Sacramento County) Hauer SSP2
- Today (2025)
- 1,660,763 people
- By 2030
- 1,732,990 · +4.3%
- By 2040
- 1,855,755 · +11.7%
- By 2050
- 1,941,335 · +16.9%
- By 2075
- 2,046,162 · +23.2%
- By 2100
- 1,961,444 · +18.1%
Race, ethnicity, and origin ACS 2023
- Neighborhood character
- Highly diverse neighborhood (Simpson 0.77)
- Race & ethnicity
- Hispanic / Latino 37% White 21% Asian 18% Two or more races 15% Black 13% Pacific Islander 2%
- Hispanic origin (detail)
- Mexican 33%
- Common ancestry
- Scotch-Irish 2% Subsaharan African 1% Scottish 1%
- Foreign-born
- 25% · Canada, Vietnam, China
- Languages at home
- 55% English-only · Spanish 22% Other Asian/Pacific 10% Other Indo-European 5%
Political lean MEDSL · Sacramento
- 2024 margin
- D (+19.7) · D 58.1% · R 38.4% · Other 3.5%
- 2008→2024 swing
- +0.7pp no change · 2008: 19.0pp · 2024: 19.7pp
- All cycles
- 2024: D+19.7 2020: D+25.3 2016: D+23.7 2012: D+16.3 2008: D+19.0
Not yet ingested
- Civics
- —
Market trends
- HPI YoY
- ▼ -391.80%
- Current HPI
- 415.1804
- Rent YoY
- ▼ -2.74%
- Metro
- Sacramento-Roseville-Folsom, CA
- State GDP YoY
- ▲ 3.21%
- F500 in state
- 116
Industry mix (Fortune 500 HQ in CA)
| Industry | F500 HQs | Revenue |
|---|---|---|
| Technology | 27 | $1,492B |
|
||
| Financial Services | 3 | $174B |
|
||
| Retail | 3 | $44B |
|
||
| Insurance | 3 | $26B |
|
||
| Media / Entertainment | 2 | $115B |
|
||
| Pharmaceuticals / Biotech | 2 | $62B |
|
||
Cash-flow waterfall
monthlySold comps — $/sqft
last 12 mo · ≤1 miLoading sold comps…