645 N Cochran Ave · Charlotte, MI
Flood risk 1/10 · Minimal
- FEMA flood zone
- X (unshaded)
- Chance of flooding over 30 yrs
- 0.0%
- Est. flood insurance / yr
- $473 – $860
Fire risk 1/10 · Minimal
- Est. fire insurance / yr
- $784 – $1,456
Heat risk 2/10 · Minimal
- Hot days now (above 96°F)
- 7 days/yr
- Hot days in 30 yrs
- 16 days/yr
Wind risk 2/10 · Minimal
- Chance of severe wind over 30 yrs
- —
Air-quality risk 2/10 · Minimal
- Unhealthy air days now
- 1 days/yr
- Unhealthy air days in 30 yrs
- 2 days/yr
Risk factors via First Street. Map © Google.
Why this score? — see what drove the D grade
The composite is a weighted blend of 9 inputs, each scored 0–100. Each bar is that input's sub-score; the figure is the points it added to the 100-point composite (weight × sub-score).
- Cash flow +14.0/30.0
- ARV discount +9.4/15.0
- DSCR +4.2/10.0
- Livability +3.7/5.0
- 1% rule +3.5/10.0
- Schools +3.1/10.0
- Rent growth +2.5/5.0
- Condition / age +2.5/5.0
- Appreciation +0.0/10.0
$175,000
🖨 Deal sheet (PDF) 📄 Offer letter ✓ Due diligence
Listing remarks MLS
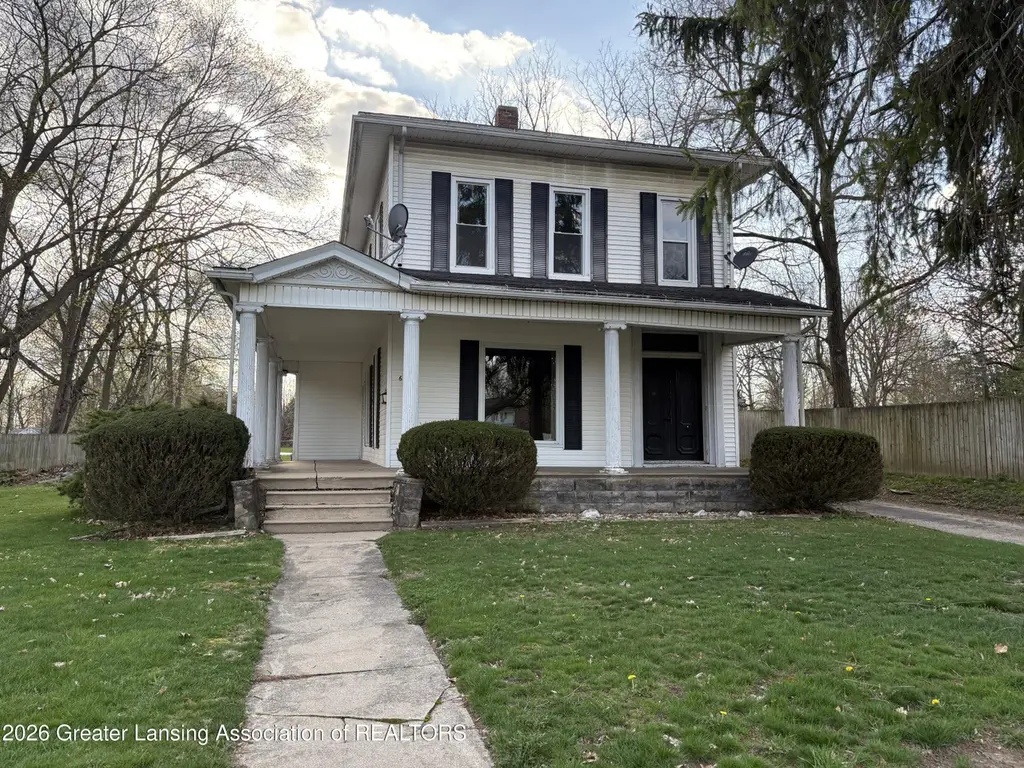
This grand Greek Revival 2-story features vinyl siding, newer style vinyl thermopile windows. Sitting high and proud, well back from the road, the wrap-around porch and corniced columns give a stately curb appeal to this grand old home. Over 2000 sq. ft. of living space on a large 1/2 acre lot with fenced back yard, a carriage house garage and an in-ground pool! The home needs some updates, but it is priced to sell!
Key facts
- 0.6 acre lot
- 2 garage spots
- Pool
Neighborhood map
What this means for you Summary
Snapshot
- This is a 4-bed/1.0-bath single-family listed at $175k.
Deal economics
- At list price, monthly cash flow is $22 ($269/yr) — positive.
- The deal already cash-flows at list — no discount required.
- To meet the 1% rule (rent ≥ 1% of price), the offer needs to be $148k (15.3% below list).
- Recommended offer: $148k (15.3% below list) — sets the bar for 1% rule.
- Cap rate 6.4% vs local median 3.9% in Charlotte — top-decile yield for the area; either an underpriced asset or a hidden risk that comps aren't pricing in. Stress-test before assuming the spread holds.
Location & tenants
- Location reads 73/100 on livability (#219 in MI) — a middle-class / working-renter tenant base. Strengths: cost of living A+, housing A+, health & safety A+; Watch: employment C-, crime D, amenities F.
- Charlotte Public Schools (town): math 31% / reading 40% proficiency, ranked #261 of 540 in MI (top 48%) — families likely to look elsewhere, expect single-tenant / working-renter base with shorter leases.
- Zoned schools: Parkview Elementary School (math 52% / reading 47%, grade D, #382 of 1,397 statewide, top 30%, 319 students, 49% FRL); Charlotte Upper Elementary School (math 31% / reading 39%, grade F, #283 of 493 statewide, top 58%, 573 students, 46% FRL); Charlotte Senior High School (math 22% / reading 57%, grade F, #304 of 713 statewide, top 46%, 698 students, 35% FRL).
- Market conditions: 98 active listings in the ZIP; 98 units permitted in Eaton County in 2024 (0 in 5+ unit buildings).
Forward outlook
- Local home prices are declining (-3.0%/yr); year-one equity from $1k of loan paydown is wiped out by about $5k of value loss. Plan a longer hold.
- Eaton County population projected to shrink 5% by 2050 — rents likely to lag national; underwrite the cash flow, not the appreciation.
Negotiation context
- It's been on market 67 days — a 6% lower offer ($164k) is reasonable based on typical stale-listing flexibility.
- 2 sale attempts; this cycle's ask has dropped $25k (12%) from the opening price — seller is motivated, your offer sets the floor, not the list.
Risks & watch-outs
- Watch-outs: built in 1900 — expect roof / HVAC / electrical / plumbing capex.
Questions for the listing agent
- It's been on market 67 days. Have you received any prior offers? Is the seller open to a 15% concession, seller financing, or rate buy-down credit?
- Built in 1900 — when were the roof, HVAC, electrical panel, plumbing, and water heater last replaced?
- Why hasn't it sold? Are there any deal-killer items the seller is aware of (foundation, flood, title, zoning, code violations)?
- Is there a deadline driving the sale (1031 exchange, divorce, estate, relocation)? That informs how much negotiation room exists.
- Crime grade is D in this area — have there been break-ins, vandalism, or insurance claims at this property in the last 3 years? What carrier currently insures it and at what premium?
- The area grade is low — what's the realistic commute time and amenity access for the typical tenant pool here? Any planned neighborhood developments (good or bad) we should know about?
- What's the average days-on-market for RENTAL listings here right now (not sales)? A rising rental-DOM trend means longer vacancies and softer asking-rent achievability than the comps imply.
- What's the recent tenant-quality profile in this submarket — average credit score on applications, eviction rate, late-payment / NSF rate, and stable-employment percentage? A property-management company in the area should have these aggregated.
- How much new for-sale + rental construction is in the pipeline within 1–3 miles? Heavy new supply typically softens prices + rents 12–24 months out; constrained supply supports both.
Investment metrics
- 1% rule
- 0.85% ✗
- Cap rate
- 6.45%
- Cash-on-cash
- 0.55%
- DSCR
- 1.02
- GRM
- 9.8
CMA / ARV
- ARV (median comp)
- $182,690
- List price
- $175,000
- Delta
- -4.21%
- Verdict
- FAIR
- Comps
- 20 within 1.0 mi
Show comp detail 12 sales within ~0.75 mi
| Address | Dist | Beds/Ba | Sqft | Sold | Price | $/sf | Match |
|---|---|---|---|---|---|---|---|
| 309 W Harris St | 0.59mi | 4/1.0 | 1,914 (-5%) | 8mo | $159,900 | $84 | 58 |
| 724 High St | 0.36mi | 4/1.5 | 1,754 (-13%) | 5mo | $252,500 | $144 | 56 |
| 222 N Cochran Ave | 0.49mi | 4/1.5 | 2,180 (+9%) | 10mo | $164,900 | $76 | 52 |
| 207 N Oliver St | 0.53mi | 3/1.5 (-1) | 1,940 (-3%) | 17mo | $174,000 | $90 | 48 |
| 609 W Harris St | 0.70mi | 3/1.0 (-1) | 1,898 (-5%) | 9mo | $191,000 | $101 | 46 |
| 311 N Washington St | 0.42mi | 4/2.5 | 2,262 (+13%) | 9mo | $95,000 | $42 | 46 |
| 146 Canterbury Dr | 0.67mi | 4/3.5 | 2,173 (+8%) | 1mo | $360,000 | $166 | 44 |
| 311 N Bostwick St | 0.42mi | 3/2.0 (-1) | 1,734 (-14%) | 9mo | $206,000 | $119 | 41 |
| 721 Foote St | 0.66mi | 4/2.0 | 2,300 (+15%) | 9mo | $215,000 | $93 | 33 |
| 703 Oakwood Dr | 0.54mi | 3/2.5 (-1) | 1,737 (-14%) | 12mo | $330,000 | $190 | 31 |
| 702 Katies Way | 0.53mi | 3/2.5 (-1) | 1,760 (-12%) | 15mo | $321,000 | $182 | 31 |
| 621 Dellinger Dr | 0.57mi | 3/2.5 (-1) | 1,737 (-14%) | 11mo | $333,100 | $192 | 31 |
Match score weights: distance 35% · size 25% · config 20% · recency 20%. Top-matched comps best support the ARV.
Projected returns pro-forma
-3.0% appreciation · 3.0% rent growth · sell at horizon
- IRR
- -15.4%
- Equity multiple
- 0.45×
- Total profit
- $-26,946
- Equity at exit
- $26,093
- IRR
- -6.9%
- Equity multiple
- 0.56×
- Total profit
- $-21,689
- Equity at exit
- $15,131
Cash invested: $49,000 (down + closing). Projections, not guarantees.
Landlord ↔ Tenant lean methodology
- Overall (STATE)
- 62 Landlord-Friendly
- State Michigan
- 62 Landlord-Friendly · EVEN
- County
- — inherits STATE
- City
- — inherits STATE
ZIP-level market 48813
- Active inventory
- 98
- Price-to-rent
- 9.8×
Monthly cashflow live
- Estimated rent
- $1,482 medium interval (Pro) →
- Mortgage (P&I)
- −$918
- Tax from tax record
- −$158 /mo · $1,891/yr
- Insurance
- −$73
- HOA
- −$0
- Vacancy / Maint / Mgmt
- −$311
- Net cashflow
- $22
Break-even live
Sensitivity live
| Price | -10% $121 | -5% $72 | +0% $22 | +5% $-27 | +10% $-77 |
|---|---|---|---|---|---|
| Rent | -10% $-95 | -5% $-36 | +0% $22 | +5% $81 | +10% $139 |
| Rate | -1.0pp $111 | -0.5pp $67 | base $22 | +0.5pp $-23 | +1.0pp $-69 |
UW: 25.0% down · 7.5% · 30yr · 1.5% tax · 5.0% vac · 8.0% maint · 8.0% mgmt
Financing live
Cash to close
- Down payment
- $43,750
- Closing costs
- $5,250
- Reserves months
- —
- Total cash needed
- —
Loan-product check · same deal, 3 products live
Conventional
25% down · 7.5% · 30yr
- Down + closing
- —
- Monthly P&I
- —
- Monthly cashflow
- —
- DSCR
- —
- Eligible?
- —
Personal DTI + credit; lowest rate.
DSCR
20% down · 8.5% · 30yr
- Down + closing
- —
- Monthly P&I
- —
- Monthly cashflow
- —
- DSCR
- —
- Eligible?
- —
No personal income docs; deal must DSCR.
Hard money
10% down · 12.0% · 12mo
- Down + closing
- —
- Monthly P&I
- —
- Monthly cashflow
- —
- DSCR
- —
- Eligible?
- —
Short-term bridge; refi at stabilization.
Listing history 21 events
-
2026-06-21days on market $175,000 Active 67 DOM
-
2026-06-18days on market $175,000 Active 64 DOM
-
2026-06-17days on market $175,000 Active 63 DOM
-
2026-06-16pricedays on market $175,000 Active 62 DOM
-
2026-06-15days on market $187,000 Active 61 DOM
-
2026-06-14days on market $187,000 Active 59 DOM
-
2026-06-13days on market $187,000 Active 58 DOM
-
2026-06-10days on market $187,000 Active 56 DOM
-
2026-06-09days on market $187,000 Active 55 DOM
-
2026-06-08days on market $187,000 Active 54 DOM
-
2026-06-07days on market $187,000 Active 53 DOM
-
2026-06-05days on market $187,000 Active 50 DOM
-
2026-06-03days on market $187,000 Active 49 DOM
-
2026-06-02days on market $187,000 Active 48 DOM
-
2026-06-01days on market $187,000 Active 47 DOM
-
2026-05-31days on market $187,000 Active 46 DOM
-
2026-05-30days on market $187,000 Active 45 DOM
-
2026-05-12price $187,000 419-char remark
Show marketing remark (419 chars)
This grand Greek Revival 2-story features vinyl siding, newer style vinyl thermopile windows. Sitting high and proud, well back from the road, the wrap-around porch and corniced columns give a stately curb appeal to this grand old home. Over 2000 sq. ft. of living space on a large 1/2 acre lot with fenced back yard, a carriage house garage and an in-ground pool! The home needs some updates, but it is priced to sell!
-
2026-04-15$199,900 Active 419-char remark
Show marketing remark (419 chars)
This grand Greek Revival 2-story features vinyl siding, newer style vinyl thermopile windows. Sitting high and proud, well back from the road, the wrap-around porch and corniced columns give a stately curb appeal to this grand old home. Over 2000 sq. ft. of living space on a large 1/2 acre lot with fenced back yard, a carriage house garage and an in-ground pool! The home needs some updates, but it is priced to sell!
ⓘ Source: listings_history table (triggers on properties + properties_extension) + one-shot
backfill from property_details.listing_events for pre-trigger history.
Tax reassessment forecast MI · Partial reset (capped growth)
- Current annual tax
- $1,891 · $158/mo
- Projected year-2 tax
- $2,293 · $191/mo
- Expected delta
- +$402/yr (+$34/mo · 21.3%)
ⓘ Screening estimate from a state-policy table — verify with the county assessor before closing.
Climate risk First Street
- Flood 1/10 Low FEMA zone X (unshaded) · 0% chance over 30 yrs
- Wildfire 1/10 Low
- Heat 2/10 Low 7 d/yr ≥96°F today · 16 d/yr by 30 yrs out
- Wind 2/10 Low
- Air quality 2/10 Low 1 unhealthy d/yr today · 2 by 30 yrs out
Nearby sold comps map
Loading sold comps map…
Walkable amenities ~0.75 mi
Loading nearby amenities…
Taxation est. · year 1
- Rental income
- $17,781
- − Mortgage interest
- −$9,803
- − Property taxes
- −$1,891
- − Insurance
- −$875
- − Repairs & maintenance
- −$1,423
- − Management
- −$1,423
- − Depreciation
- −$5,091
- Taxable loss
- −$2,723
- Est. tax savings @ 24.0%
- +$654
- After-tax cash flow
- $922/yr
For passive investors: Depreciation is non-cash, so a rental often shows a tax loss while cash-flowing — sheltering income. Rental losses are passive: they offset passive income freely, and up to $25,000/yr can offset ordinary (W-2) income if you actively participate and your MAGI is under $100k (phasing out to $0 by $150k); unused losses carry forward. On sale, claimed depreciation is recaptured at up to 25%, and gains may owe capital-gains tax (a 1031 exchange can defer both). Figures are a year-1 estimate at your 24.0% rate — not tax advice; consult a CPA.
Schools (NCES district)
- District
- Charlotte Public Schools
- NCES district ID
- 2608770
- Math proficiency
- 31% ▼ -9.00%
- Reading proficiency
- 40% ▼ -7.00%
- Median HH income
- $54,722
- Composite
- 31.18/100
- National rank
- #6048
- State rank
- #261 of 540 in MI
Livability — Charlotte
- Score
- 73/100
- State rank
- #219
- US rank
- #5414
Category grades
Schools grade is shown separately in the Schools card above.
Census & demographics
- Census place
- Charlotte, MI
- City population
- 20,263
- Population (ZIP)
- 20,263
Population outlook (Eaton County) Hauer SSP2
- Today (2025)
- 110,811 people
- By 2030
- 110,598 · -0.2%
- By 2040
- 108,304 · -2.3%
- By 2050
- 104,961 · -5.3%
- By 2075
- 97,197 · -12.3%
- By 2100
- 85,150 · -23.2%
Race, ethnicity, and origin ACS 2023
- Neighborhood character
- Predominantly White (89%)
- Race & ethnicity
- White 89% Two or more races 6% Hispanic / Latino 5% Black 1%
- Common ancestry
- Romanian 5% Lithuanian 3% Iranian 3%
- Foreign-born
- 1% · Canada
- Languages at home
- 96% English-only · Spanish 1% German/W. Germanic 1%
Political lean MEDSL · Eaton
- 2024 margin
- Toss-up / Even · D 47.6% · R 50.8% · Other 1.6%
- 2008→2024 swing
- -11.6pp toward R · 2008: 8.4pp · 2024: -3.1pp
- All cycles
- 2024: R+3.1 2020: R+0.8 2016: R+5.5 2012: D+3.1 2008: D+8.4
Not yet ingested
- Civics
- —
Market trends
- HPI YoY
- ▼ -194.48%
- Current HPI
- 183.0171
- Rent YoY
- —
- Metro
- —
- State GDP YoY
- ▲ 1.37%
- F500 in state
- 28
Industry mix (Fortune 500 HQ in MI)
| Industry | F500 HQs | Revenue |
|---|---|---|
| Automotive Parts | 3 | $48B |
|
||
| Automotive | 2 | $372B |
|
||
| Chemicals | 1 | $45B |
|
||
| Automotive Retail | 1 | $29B |
|
||
| Healthcare / Medical Devices | 1 | $23B |
|
||
| Automotive Technology | 1 | $20B |
|
||
Price history
-6.5% since first listed4 events — show timeline
- 2026-05-12 Price Changed $187,000 REALCOMP
- 2026-05-12 Price Changed $187,000 Greater Lansing AoR
- 2026-04-15 Listed $199,900 REALCOMP
- 2026-04-15 Listed $199,900 Greater Lansing AoR
Property tax history
+0.0%/yrLatest (2025): $1,891 · -28.0% YoY. Source: county tax records.
Cash-flow waterfall
monthlySold comps — $/sqft
last 12 mo · ≤1 miLoading sold comps…