939 Schneitter Cir #3 · Midway, UT
Flood risk 1/10 · Minimal
- FEMA flood zone
- X (unshaded)
- Chance of flooding over 30 yrs
- 0.0%
- Est. flood insurance / yr
- $507 – $1,088
Fire risk 6/10 · Moderate
- Est. fire insurance / yr
- $453 – $841
Heat risk 3/10 · Minor
- Hot days now (above 90°F)
- 8 days/yr
- Hot days in 30 yrs
- 23 days/yr
Wind risk 1/10 · Minimal
- Chance of severe wind over 30 yrs
- —
Air-quality risk 3/10 · Minor
- Unhealthy air days now
- 2 days/yr
- Unhealthy air days in 30 yrs
- 3 days/yr
Risk factors via First Street. Map © Google.
Why this score? — see what drove the D grade
The composite is a weighted blend of 9 inputs, each scored 0–100. Each bar is that input's sub-score; the figure is the points it added to the 100-point composite (weight × sub-score).
- Cash flow +13.1/30.0
- ARV discount +7.5/15.0
- Schools +4.3/10.0
- 1% rule +4.2/10.0
- DSCR +3.9/10.0
- Livability +3.4/5.0
- Rent growth +2.5/5.0
- Condition / age +2.5/5.0
- Appreciation +0.0/10.0
$375,000
🖨 Deal sheet (PDF) 📄 Offer letter ✓ Due diligence
Listing remarks
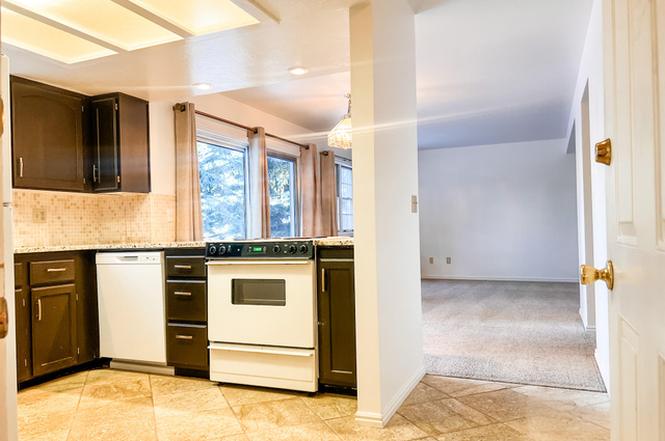
Opportunity knocks in the heart of Midway! This 2-bedroom, 2-bath main-floor condo offers a functional layout with no stairs and easy access for everyday living. Ideal for buyers looking to build equity or investors seeking a value-add project, the home provides a solid starting point with quartz kitchen countertops and a tile backsplash already in place. With a little vision and updating, this unit has the potential to shine as a full-time residence, weekend retreat, or rental. Step out from your living room onto your peaceful patio and enjoy a summer BBQ while taking in peaceful views of the valley. A detached one-car garage provides convenient parking and extra storage, and the location
Key facts
- Views of the valley
- Peaceful patio
- Main floor condo
Tags
Property features AI
Finance
- Other: Has view; Above-grade finished area reported
- HOA & community: Homeowners association (Weston Fuller); Monthly HOA fee of $450; HOA covers insurance and grounds maintenance; Community amenities: clubhouse, fitness center, spa/hot tub, playground, picnic area, tennis and racquetball courts, snow removal, management, maintenance, pets permitted
Exterior
- Parking: Covered parking; One total parking space; One garage space (1-car garage)
- Utilities: Natural gas connected; Electricity connected; Sewer connected; Culinary water connected
- Home design: Condo, main-level unit; Ground-level accessibility; Property currently built and standing; Multi-family zoning
- Construction: Asphalt and stucco construction materials; Asbestos shingle roof
- Exterior features: Sliding glass doors; Valley view; Paved road access; Automatic full sprinkler system; Graded/sloped terrain; Fruit trees and full landscaping; Has spa
Interior
- Kitchen: Built-in range/oven; Disposal; Refrigerator
- Bedrooms: Two main-level bedrooms; Primary bedroom on 1st floor
- Flooring: Carpet; Linoleum; Tile
- Bathrooms: Two full bathrooms
- Heating & cooling: Gas central heating
- Interior features: Primary bathroom; Disposal; Built-in range/oven; Blinds and drapes; Total of 8 rooms; No basement
- Laundry & utility: Washer; Dryer
Neighborhood map
What this means for you Summary
Snapshot
- This is a 2-bed/2.0-bath condo listed at $375k.
Deal economics
- At list price, monthly cash flow is $-12 ($-145/yr) — negative.
- To cash-flow at today's rent, offer at most $373k (0.6% below list).
- To meet the 1% rule (rent ≥ 1% of price), the offer needs to be $346k (7.7% below list).
- Recommended offer: $341k (9.0% below list) — sets the bar for market timing.
- Cap rate 6.3% vs local median 2.4% in Midway — top-decile yield for the area; either an underpriced asset or a hidden risk that comps aren't pricing in. Stress-test before assuming the spread holds.
Location & tenants
- Location reads 67/100 on livability (#124 in UT) — a middle-class / working-renter tenant base. Strengths: crime A+, employment A+, housing A; Watch: amenities F, commute F, cost of living F.
- Wasatch District (town): math 45% / reading 51% proficiency, ranked #23 of 80 in UT (top 29%) — families likely to look elsewhere, expect single-tenant / working-renter base with shorter leases.
- Zoned schools: Midway School (math 63% / reading 66%, grade B, #23 of 585 statewide, top 4%, 675 students, 18% FRL); Rocky Mountain Middle (math 40% / reading 50%, grade D, #43 of 138 statewide, top 33%, 717 students, 26% FRL); Wasatch High (math 34% / reading 50%, grade F, #55 of 171 statewide, top 32%, 2,531 students, 16% FRL).
- Market conditions: 228 active listings in the ZIP; 2 comparable units currently listed for rent nearby; high-income renter base; 835 units permitted in Wasatch County in 2024 (22 in 5+ unit buildings).
Forward outlook
- Local home prices are declining (-3.0%/yr); year-one equity from $3k of loan paydown is wiped out by about $11k of value loss. Plan a longer hold.
- Wasatch County population projected at +87% by 2050 — long-run rental-demand tailwind backs the buy-and-hold thesis.
Negotiation context
- It's been on market 104 days — a 9% lower offer ($341k) is reasonable based on typical stale-listing flexibility.
Risks & watch-outs
- Climate carrying-cost: major wildfire risk — expect insurance premiums to compound above CPI over the hold.
Questions for the listing agent
- What do current leases actually rent for vs. the listed asking? Can we see a recent rent roll and the last 12 months of T-12 income?
- It's been on market 104 days. Have you received any prior offers? Is the seller open to a 9% concession, seller financing, or rate buy-down credit?
- What does the HOA fee cover, when was the last increase, and are there any pending special assessments or reserve-fund shortfalls?
- Any open or pending special assessments — roof, HVAC, plumbing, elevator, façade? What's the per-unit balance and payoff schedule, and is the seller paying it off at close or rolling it to the buyer?
- Why hasn't it sold? Are there any deal-killer items the seller is aware of (foundation, flood, title, zoning, code violations)?
- Is there a deadline driving the sale (1031 exchange, divorce, estate, relocation)? That informs how much negotiation room exists.
- Schools are A-rated — typically a magnet for longer-tenancy family renters. What's the average tenant stay here, and is there a school-zone premium baked into asking?
- The area grade is low — what's the realistic commute time and amenity access for the typical tenant pool here? Any planned neighborhood developments (good or bad) we should know about?
- What's the average days-on-market for RENTAL listings here right now (not sales)? A rising rental-DOM trend means longer vacancies and softer asking-rent achievability than the comps imply.
- What's the recent tenant-quality profile in this submarket — average credit score on applications, eviction rate, late-payment / NSF rate, and stable-employment percentage? A property-management company in the area should have these aggregated.
- How much new apartment / multifamily construction is in the pipeline within 1–3 miles? Heavy new supply (>2% of stock underway) typically softens rents 12–24 months out; light construction supports rent growth.
Investment metrics
- 1% rule
- 0.92% ✗
- Cap rate
- 6.25%
- Cash-on-cash
- -0.14%
- DSCR
- 0.99
- GRM
- 9.0
CMA / ARV
No comps found within radius.
Projected returns pro-forma
-3.0% appreciation · 3.0% rent growth · sell at horizon
- IRR
- -16.5%
- Equity multiple
- 0.42×
- Total profit
- $-61,386
- Equity at exit
- $55,914
- IRR
- -8.2%
- Equity multiple
- 0.49×
- Total profit
- $-53,841
- Equity at exit
- $32,423
Cash invested: $105,000 (down + closing). Projections, not guarantees.
Landlord ↔ Tenant lean methodology
- Overall (STATE)
- 86 Strongly Landlord-Friendly
- State Utah
- 86 Strongly Landlord-Friendly · R+15
- County
- — inherits STATE
- City
- — inherits STATE
ZIP-level market 84049
- Home prices YoY
- -32.9%
- Active inventory
- 228
- Price-to-rent
- 9.0×
Monthly cashflow live
- Estimated rent
- $3,462 medium interval (Pro) →
- Mortgage (P&I)
- −$1,967
- Tax from tax record
- −$175 /mo · $2,096/yr
- Insurance
- −$156
- HOA
- −$450
- Vacancy / Maint / Mgmt
- −$727
- Net cashflow
- $-12
Break-even live
Sensitivity live
| Price | -10% $200 | -5% $94 | +0% $-12 | +5% $-118 | +10% $-224 |
|---|---|---|---|---|---|
| Rent | -10% $-286 | -5% $-149 | +0% $-12 | +5% $125 | +10% $261 |
| Rate | -1.0pp $177 | -0.5pp $83 | base $-12 | +0.5pp $-109 | +1.0pp $-208 |
UW: 25.0% down · 7.5% · 30yr · 1.5% tax · 5.0% vac · 8.0% maint · 8.0% mgmt
Financing live
Cash to close
- Down payment
- $93,750
- Closing costs
- $11,250
- Reserves months
- —
- Total cash needed
- —
Loan-product check · same deal, 3 products live
Conventional
25% down · 7.5% · 30yr
- Down + closing
- —
- Monthly P&I
- —
- Monthly cashflow
- —
- DSCR
- —
- Eligible?
- —
Personal DTI + credit; lowest rate.
DSCR
20% down · 8.5% · 30yr
- Down + closing
- —
- Monthly P&I
- —
- Monthly cashflow
- —
- DSCR
- —
- Eligible?
- —
No personal income docs; deal must DSCR.
Hard money
10% down · 12.0% · 12mo
- Down + closing
- —
- Monthly P&I
- —
- Monthly cashflow
- —
- DSCR
- —
- Eligible?
- —
Short-term bridge; refi at stabilization.
Rent comps 2 comps
| Address | Beds | Baths | Sqft | Rent | $/sqft | DOM | Units | Dist |
|---|---|---|---|---|---|---|---|---|
| 939 Schneitter Cir Unit I-3 Midway, UT | 2.0 | 2.0 | 1074 | $1,850 | $1.72 | 25d | 1 | 0.03mi |
| 983 Grindelwald Ln Unit O4 Midway, UT | 2.0 | 2.0 | 1074 | $2,300 | $2.14 | 23d | 1 | 0.05mi |
HOA detail condo
- Monthly dues
- $450 · $5,400/yr
- Assessments
- None detected in remarks — confirm with the listing agent.
Listing history 15 events
-
2026-06-22days on market $375,000 Active 104 DOM
-
2026-06-18status $375,000 Active 101 DOM
-
2026-06-14statusdays on market $375,000 Under Contract 101 DOM
-
2026-06-10days on market $375,000 Active 99 DOM
-
2026-06-09days on market $375,000 Active 98 DOM
-
2026-06-08days on market $375,000 Active 97 DOM
-
2026-06-07days on market $375,000 Active 96 DOM
-
2026-06-05days on market $375,000 Active 93 DOM
-
2026-06-03days on market $375,000 Active 92 DOM
-
2026-06-02days on market $375,000 Active 91 DOM
-
2026-06-01days on market $375,000 Active 90 DOM
-
2026-05-31days on market $375,000 Active 89 DOM
-
2026-05-31days on market $375,000 Active 88 DOM
-
2026-03-03$375,000 Active
-
2017-08-10soldstatus
ⓘ Source: listings_history table (triggers on properties + properties_extension) + one-shot
backfill from property_details.listing_events for pre-trigger history.
Tax reassessment forecast UT · Resets to sale price
- Current annual tax
- $2,096 · $175/mo
- Projected year-2 tax
- $2,475 · $206/mo
- Expected delta
- +$379/yr (+$32/mo · 18.1%)
ⓘ Screening estimate from a state-policy table — verify with the county assessor before closing.
Climate risk First Street
- Flood 1/10 Low FEMA zone X (unshaded) · 0% chance over 30 yrs
- Wildfire 6/10 Major
- Heat 3/10 Moderate 8 d/yr ≥90°F today · 23 d/yr by 30 yrs out
- Wind 1/10 Low
- Air quality 3/10 Moderate 2 unhealthy d/yr today · 3 by 30 yrs out
Nearby sold comps map
Loading sold comps map…
Walkable amenities ~0.75 mi
Loading nearby amenities…
Taxation est. · year 1
- Rental income
- $41,550
- − Mortgage interest
- −$21,006
- − Property taxes
- −$2,096
- − Insurance
- −$1,875
- − Repairs & maintenance
- −$3,324
- − Management
- −$3,324
- − HOA
- −$5,400
- − Depreciation
- −$10,909
- Taxable loss
- −$6,384
- Est. tax savings @ 24.0%
- +$1,532
- After-tax cash flow
- $1,387/yr
For passive investors: Depreciation is non-cash, so a rental often shows a tax loss while cash-flowing — sheltering income. Rental losses are passive: they offset passive income freely, and up to $25,000/yr can offset ordinary (W-2) income if you actively participate and your MAGI is under $100k (phasing out to $0 by $150k); unused losses carry forward. On sale, claimed depreciation is recaptured at up to 25%, and gains may owe capital-gains tax (a 1031 exchange can defer both). Figures are a year-1 estimate at your 24.0% rate — not tax advice; consult a CPA.
Schools (NCES district)
- District
- Wasatch District
- NCES district ID
- 4901110
- Math proficiency
- 45% ▼ -2.00%
- Reading proficiency
- 51% ▼ -1.00%
- Median HH income
- $67,315
- Composite
- 42.77/100
- National rank
- #3154
- State rank
- #23 of 80 in UT
Livability — Midway
- Score
- 67/100
- State rank
- #124
- US rank
- #10123
Category grades
Schools grade is shown separately in the Schools card above.
Census & demographics
- Census place
- Midway, UT
- County
- Wasatch County · 42,185 people
- City population
- 6,833
- Metro
- Heber, UT
- Population (ZIP)
- 6,833
- Household income
- $151,343
- Rent vs Own
- Severe rent burden
- 11.0
Population outlook (Wasatch County) Hauer SSP2
- Today (2025)
- 42,214 people
- By 2030
- 49,113 · +16.3%
- By 2040
- 63,675 · +50.8%
- By 2050
- 78,879 · +86.9%
- By 2075
- 116,912 · +177.0%
- By 2100
- 147,290 · +248.9%
Race, ethnicity, and origin ACS 2023
- Neighborhood character
- Predominantly White (97%)
- Race & ethnicity
- White 97% Two or more races 2% Hispanic / Latino 1%
- Common ancestry
- Italian 7% Slovak 4% Iranian 3%
- Foreign-born
- 3% · Canada
- Languages at home
- 92% English-only · Spanish 5% German/W. Germanic 1% Other Indo-European 1%
Political lean MEDSL · Wasatch
- 2024 margin
- Strong R (+27.4) · D 35.2% · R 62.6% · Other 2.2%
- 2008→2024 swing
- +2.3pp toward D · 2008: -29.8pp · 2024: -27.4pp
- All cycles
- 2024: R+27.4 2020: R+26.2 2016: R+25.2 2012: R+52.2 2008: R+29.8
Not yet ingested
- Civics
- —
Market trends
- HPI YoY
- ▼ -154.44%
- Current HPI
- 314.7511
- Rent YoY
- —
- Metro
- Heber, UT
- State GDP YoY
- ▲ 3.54%
- F500 in state
- 2
Industry mix (Fortune 500 HQ in UT)
| Industry | F500 HQs | Revenue |
|---|---|---|
| Financial Services | 1 | $3B |
|
||
Price history
2 events — show timeline
- 2026-03-03 Listed $375,000 WFRMLS
- 2017-08-10 Sold (Public Records) — Public Records
Property tax history
+2.3%/yrLatest (2025): $2,096 · -52.1% YoY. Source: county tax records.
Cash-flow waterfall
monthlySold comps — $/sqft
last 12 mo · ≤1 miLoading sold comps…