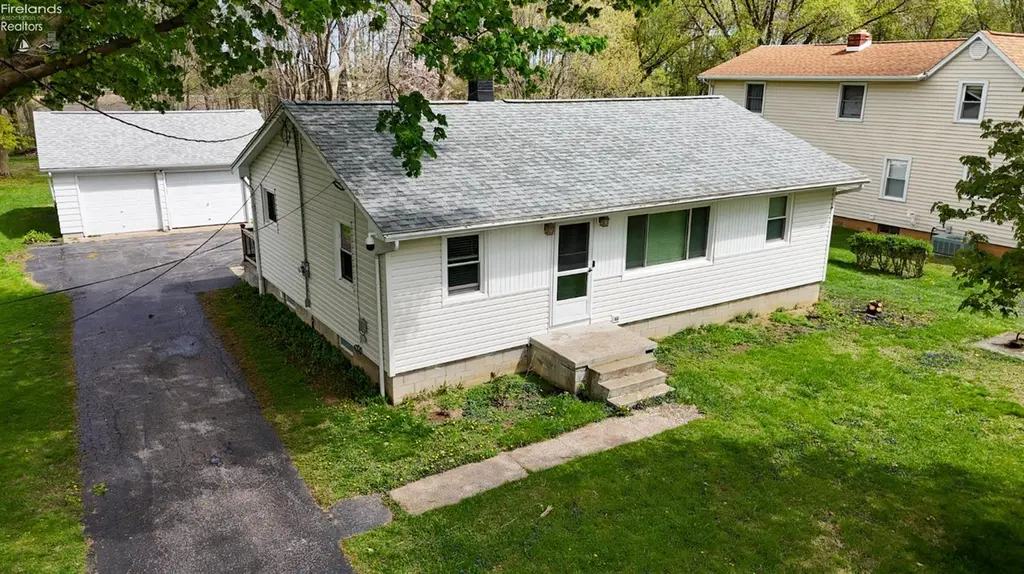
3015 Boos Rd · Sandusky, OH
Flood risk 1/10 · Minimal
- FEMA flood zone
- X (unshaded)
- Chance of flooding over 30 yrs
- 0.0%
- Est. flood insurance / yr
- $473 – $860
Fire risk 1/10 · Minimal
- Est. fire insurance / yr
- $713 – $1,323
Heat risk 3/10 · Minor
- Hot days now (above 95°F)
- 7 days/yr
- Hot days in 30 yrs
- 15 days/yr
Wind risk 2/10 · Minimal
- Chance of severe wind over 30 yrs
- —
Air-quality risk 2/10 · Minimal
- Unhealthy air days now
- 1 days/yr
- Unhealthy air days in 30 yrs
- 2 days/yr
Risk factors via First Street. Map © Google.
Why this score? — see what drove the D+ grade
The composite is a weighted blend of 9 inputs, each scored 0–100. Each bar is that input's sub-score; the figure is the points it added to the 100-point composite (weight × sub-score).
- ARV discount +15.0/15.0
- Cash flow +13.0/30.0
- Schools +5.8/10.0
- Livability +4.2/5.0
- DSCR +3.9/10.0
- 1% rule +2.9/10.0
- Rent growth +2.5/5.0
- Condition / age +2.5/5.0
- Appreciation +0.0/10.0
$267,000
🖨 Deal sheet (PDF) 📄 Offer letter ✓ Due diligence
Listing remarks
Move-in ready 3 bed, 1 bath home in Huron featuring numerous updates throughout. The home offers a fully updated kitchen with walk-in pantry, all new LVP flooring, and carpet in the bedrooms. Major improvements include roof, windows, and furnace all completed within the last 10 years. Enjoy additional living space in the partially finished basement complete with a bar and potential to add a 4th bedroom and second bath. Detached 2-car garage provides great storage and convenience. A solid home with modern updates and room to grow. Schedule your showing today!Seller is a licensed realtor.
Key facts
- 0.56 acre lot
- 2 garage spots
- Built 1959
Property features AI
Exterior
- Parking: Detached garage; 2 garage spaces; Garage door opener; Paved off-street parking
- Security: Security system
- Utilities: Public water; Septic sewer
- Home design: Single-family residence; Residential property
- Construction: Vinyl siding construction; Asphalt roof; Basement (partially finished)
- Exterior features: Asphalt roof; Vinyl siding; Lot size approximately 0.56 acres; Security system
Interior
- Kitchen: Refrigerator; Garbage disposal
- Bathrooms: 1 full bathroom
- Heating & cooling: Forced air heating (propane); Central air; Ceiling fans
- Interior features: Wet bar; Partially finished basement with sump pump
Neighborhood map
What this means for you Summary
Snapshot
- This is a 3-bed/1.0-bath single-family listed at $267k.
Deal economics
- At list price, monthly cash flow is $-13 ($-160/yr) — negative.
- To cash-flow at today's rent, offer at most $265k (0.9% below list).
- To meet the 1% rule (rent ≥ 1% of price), the offer needs to be $212k (20.5% below list).
- Recommended offer: $212k (20.5% below list) — sets the bar for 1% rule.
Location & tenants
- Location reads 83/100 on livability (#63 in OH, #929 nationally) — a professional / high-income tenant draw. Strengths: commute A+, cost of living A+, housing A+; Watch: crime D-, employment F.
- Huron City Schools (town): math 60% / reading 76% proficiency, ranked #164 of 656 in OH (top 25%) — acceptable for families but not a draw, mixed tenant base, ~2y average lease.
- Zoned schools: Woodlands Intermediate School (math 68% / reading 76%, grade A-, #323 of 1,584 statewide, top 23%, 340 students, 31% FRL); Mccormick Junior High (math 47% / reading 72%, grade B, #271 of 654 statewide, top 43%, 197 students, 30% FRL); Huron High School (math 57% / reading 82%, grade B, #106 of 781 statewide, top 16%, 401 students, 20% FRL) — zoned schools at 27% FRL track the district average.
- Market conditions: 92 active listings in the ZIP; solid renter incomes; 128 units permitted in Erie County in 2024 (5 in 5+ unit buildings).
- This rent runs 33% of the median local income ($77k/yr) — at the standard rent-burdened threshold; future hikes will face affordability resistance.
Forward outlook
- Local home prices are declining (-3.0%/yr); year-one equity from $2k of loan paydown is wiped out by about $8k of value loss. Plan a longer hold.
- Erie County population projected at -15% by 2050 — secular population decline; favor cash flow + early exit over multi-decade hold.
Negotiation context
- It's been on market 64 days — a 6% lower offer ($251k) is reasonable based on typical stale-listing flexibility.
- Current owner paid $124k; list at $267k implies a 116% gain — meaningful room to come down on a strong offer.
Risks & watch-outs
- Watch-outs: built in 1959 — expect roof / HVAC / electrical / plumbing capex.
Questions for the listing agent
- What do current leases actually rent for vs. the listed asking? Can we see a recent rent roll and the last 12 months of T-12 income?
- It's been on market 64 days. Have you received any prior offers? Is the seller open to a 21% concession, seller financing, or rate buy-down credit?
- Built in 1959 — when were the roof, HVAC, electrical panel, plumbing, and water heater last replaced?
- Why hasn't it sold? Are there any deal-killer items the seller is aware of (foundation, flood, title, zoning, code violations)?
- Is there a deadline driving the sale (1031 exchange, divorce, estate, relocation)? That informs how much negotiation room exists.
- Crime grade is D in this area — have there been break-ins, vandalism, or insurance claims at this property in the last 3 years? What carrier currently insures it and at what premium?
- The area grade is low — what's the realistic commute time and amenity access for the typical tenant pool here? Any planned neighborhood developments (good or bad) we should know about?
- What's the average days-on-market for RENTAL listings here right now (not sales)? A rising rental-DOM trend means longer vacancies and softer asking-rent achievability than the comps imply.
- What's the recent tenant-quality profile in this submarket — average credit score on applications, eviction rate, late-payment / NSF rate, and stable-employment percentage? A property-management company in the area should have these aggregated.
- How much new for-sale + rental construction is in the pipeline within 1–3 miles? Heavy new supply typically softens prices + rents 12–24 months out; constrained supply supports both.
Investment metrics
- 1% rule
- 0.79% ✗
- Cap rate
- 6.23%
- Cash-on-cash
- -0.21%
- DSCR
- 0.99
- GRM
- 10.5
CMA / ARV
- ARV (on-the-fly)
- $405,080
- Comps found
- 1
Show comp detail 1 sale within ~0.75 mi
| Address | Dist | Beds/Ba | Sqft | Sold | Price | $/sf | Match |
|---|---|---|---|---|---|---|---|
| 3305 Bogart Rd | 0.67mi | 3/3.0 | 1,997 (+1%) | 14mo | $409,000 | $205 | 48 |
Match score weights: distance 35% · size 25% · config 20% · recency 20%. Top-matched comps best support the ARV.
Projected returns pro-forma
-3.0% appreciation · 3.0% rent growth · sell at horizon
- IRR
- -16.7%
- Equity multiple
- 0.41×
- Total profit
- $-44,177
- Equity at exit
- $39,811
- IRR
- -8.6%
- Equity multiple
- 0.47×
- Total profit
- $-39,818
- Equity at exit
- $23,085
Cash invested: $74,760 (down + closing). Projections, not guarantees.
Landlord ↔ Tenant lean methodology
- Overall (STATE)
- 73 Landlord-Friendly
- State Ohio
- 73 Landlord-Friendly · R+6
- County
- — inherits STATE
- City
- — inherits STATE
ZIP-level market 44839
- Active inventory
- 92
- Price-to-rent
- 10.5×
Monthly cashflow live
- Estimated rent
- $2,122 medium interval (Pro) →
- Mortgage (P&I)
- −$1,400
- Tax from tax record
- −$178 /mo · $2,139/yr
- Insurance
- −$111
- HOA
- −$0
- Vacancy / Maint / Mgmt
- −$446
- Net cashflow
- $-13
Break-even live
Sensitivity live
| Price | -10% $138 | -5% $62 | +0% $-13 | +5% $-89 | +10% $-164 |
|---|---|---|---|---|---|
| Rent | -10% $-181 | -5% $-97 | +0% $-13 | +5% $71 | +10% $154 |
| Rate | -1.0pp $121 | -0.5pp $55 | base $-13 | +0.5pp $-82 | +1.0pp $-153 |
UW: 25.0% down · 7.5% · 30yr · 1.5% tax · 5.0% vac · 8.0% maint · 8.0% mgmt
Financing live
Cash to close
- Down payment
- $66,750
- Closing costs
- $8,010
- Reserves months
- —
- Total cash needed
- —
Loan-product check · same deal, 3 products live
Conventional
25% down · 7.5% · 30yr
- Down + closing
- —
- Monthly P&I
- —
- Monthly cashflow
- —
- DSCR
- —
- Eligible?
- —
Personal DTI + credit; lowest rate.
DSCR
20% down · 8.5% · 30yr
- Down + closing
- —
- Monthly P&I
- —
- Monthly cashflow
- —
- DSCR
- —
- Eligible?
- —
No personal income docs; deal must DSCR.
Hard money
10% down · 12.0% · 12mo
- Down + closing
- —
- Monthly P&I
- —
- Monthly cashflow
- —
- DSCR
- —
- Eligible?
- —
Short-term bridge; refi at stabilization.
Listing history 22 events
-
2026-06-22days on market $267,000 Active 64 DOM
-
2026-06-21days on market $267,000 Active 63 DOM
-
2026-06-19days on market $267,000 Active 61 DOM
-
2026-06-18days on market $267,000 Active 60 DOM
-
2026-06-17days on market $267,000 Active 59 DOM
-
2026-06-16days on market $267,000 Active 58 DOM
-
2026-06-15days on market $267,000 Active 57 DOM
-
2026-06-14days on market $267,000 Active 55 DOM
-
2026-06-12pricedays on market $267,000 Active 54 DOM
-
2026-06-09days on market $269,900 Active 51 DOM
-
2026-06-08days on market $269,900 Active 50 DOM
-
2026-06-07days on market $269,900 Active 49 DOM
-
2026-06-03days on market $269,900 Active 45 DOM
-
2026-06-02days on market $269,900 Active 44 DOM
-
2026-06-01days on market $269,900 Active 43 DOM
-
2026-05-31days on market $269,900 Active 42 DOM
-
2026-05-30days on market $269,900 Active 41 DOM
-
2026-05-02price $269,900
-
2026-04-27price $289,000
-
2026-04-20$299,900 Active
-
2026-04-17historical $299,900
-
2024-07-16soldstatus $123,750
ⓘ Source: listings_history table (triggers on properties + properties_extension) + one-shot
backfill from property_details.listing_events for pre-trigger history.
Tax reassessment forecast OH · Partial reset (capped growth)
- Current annual tax
- $2,139 · $178/mo
- Projected year-2 tax
- $3,152 · $263/mo
- Expected delta
- +$1,013/yr (+$84/mo · 47.4%)
ⓘ Screening estimate from a state-policy table — verify with the county assessor before closing.
Climate risk First Street
- Flood 1/10 Low FEMA zone X (unshaded) · 0% chance over 30 yrs
- Wildfire 1/10 Low
- Heat 3/10 Moderate 7 d/yr ≥95°F today · 15 d/yr by 30 yrs out
- Wind 2/10 Low
- Air quality 2/10 Low 1 unhealthy d/yr today · 2 by 30 yrs out
Nearby sold comps map
Loading sold comps map…
Walkable amenities ~0.75 mi
Loading nearby amenities…
Taxation est. · year 1
- Rental income
- $25,464
- − Mortgage interest
- −$14,956
- − Property taxes
- −$2,139
- − Insurance
- −$1,335
- − Repairs & maintenance
- −$2,037
- − Management
- −$2,037
- − Depreciation
- −$7,767
- Taxable loss
- −$4,808
- Est. tax savings @ 24.0%
- +$1,154
- After-tax cash flow
- $994/yr
For passive investors: Depreciation is non-cash, so a rental often shows a tax loss while cash-flowing — sheltering income. Rental losses are passive: they offset passive income freely, and up to $25,000/yr can offset ordinary (W-2) income if you actively participate and your MAGI is under $100k (phasing out to $0 by $150k); unused losses carry forward. On sale, claimed depreciation is recaptured at up to 25%, and gains may owe capital-gains tax (a 1031 exchange can defer both). Figures are a year-1 estimate at your 24.0% rate — not tax advice; consult a CPA.
Schools (NCES district)
- District
- Huron City Schools
- NCES district ID
- 3904413
- Math proficiency
- 60% ▼ -18.00%
- Reading proficiency
- 76% ▼ -7.00%
- Median HH income
- $56,995
- Composite
- 58.32/100
- National rank
- #1013
- State rank
- #164 of 656 in OH
Livability — Sandusky
- Score
- 83/100
- State rank
- #63
- US rank
- #929
Category grades
Schools grade is shown separately in the Schools card above.
Census & demographics
- County
- Erie · 78,232 people
- City population
- 39,883
- Metro
- Sandusky, OH
- Population (ZIP)
- 12,702
- Household income
- $77,377
- Rent vs Own
- Severe rent burden
- 4.0
Population outlook (Erie County) Hauer SSP2
- Today (2025)
- 73,204 people
- By 2030
- 71,341 · -2.5%
- By 2040
- 66,771 · -8.8%
- By 2050
- 62,512 · -14.6%
- By 2075
- 56,154 · -23.3%
- By 2100
- 49,045 · -33.0%
Race, ethnicity, and origin ACS 2023
- Neighborhood character
- Predominantly White (91%)
- Race & ethnicity
- White 91% Two or more races 6% Hispanic / Latino 4%
- Common ancestry
- Lithuanian 4% Romanian 3% Iranian 3%
- Foreign-born
- 2% · Canada, South Korea, Jamaica
- Languages at home
- 95% English-only · Other Indo-European 2% Spanish 2% Korean 1%
Political lean MEDSL · Erie
- 2024 margin
- R (+14.1) · D 42.5% · R 56.6%
- 2008→2024 swing
- -28.0pp toward R · 2008: 13.9pp · 2024: -14.1pp
- All cycles
- 2024: R+14.1 2020: R+11.6 2016: R+9.8 2012: D+11.3 2008: D+13.9
Not yet ingested
- Civics
- —
Market trends
- HPI YoY
- ▼ -111.15%
- Current HPI
- 200.6889
- Rent YoY
- —
- Metro
- —
- State GDP YoY
- ▲ 1.98%
- F500 in state
- 48
Industry mix (Fortune 500 HQ in OH)
| Industry | F500 HQs | Revenue |
|---|---|---|
| Insurance | 3 | $145B |
|
||
| Industrial Machinery | 3 | $49B |
|
||
| Financial Services | 3 | $24B |
|
||
| Consumer Goods | 2 | $93B |
|
||
| Aerospace / Defense | 2 | $47B |
|
||
| Utilities | 2 | $33B |
|
||
Price history
+118.1% since first listed5 events — show timeline
- 2026-05-02 Price Changed $269,900 FAOR
- 2026-04-27 Price Changed $289,000 FAOR
- 2026-04-20 Listed $299,900 FAOR
- 2026-04-17 Coming Soon $299,900 FAOR
- 2024-07-16 Sold (Public Records) $123,750 Public Records
Property tax history
+7.4%/yrLatest (2025): $2,139 · -1.6% YoY. Source: county tax records.
Cash-flow waterfall
monthlySold comps — $/sqft
last 12 mo · ≤1 miLoading sold comps…