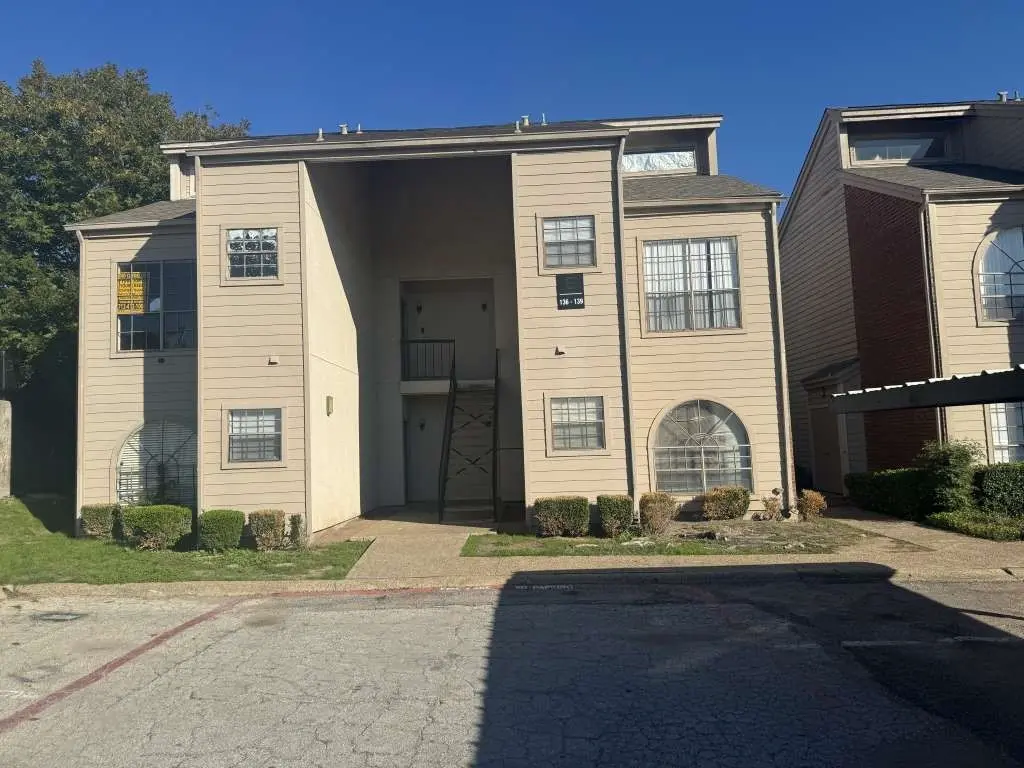
9747 Whitehurst Dr #137 · Dallas, TX
Flood risk 1/10 · Minimal
- FEMA flood zone
- X (unshaded)
- Chance of flooding over 30 yrs
- 0.0%
- Est. flood insurance / yr
- $507 – $1,088
Fire risk 1/10 · Minimal
- Est. fire insurance / yr
- $1,222 – $2,270
Heat risk 7/10 · Major
- Hot days now (above 109°F)
- 7 days/yr
- Hot days in 30 yrs
- 23 days/yr
Wind risk 6/10 · Moderate
- Chance of severe wind over 30 yrs
- 27.0%
Air-quality risk 3/10 · Minor
- Unhealthy air days now
- 3 days/yr
- Unhealthy air days in 30 yrs
- 3 days/yr
Risk factors via First Street. Map © Google.
Why this score? — see what drove the D grade
The composite is a weighted blend of 9 inputs, each scored 0–100. Each bar is that input's sub-score; the figure is the points it added to the 100-point composite (weight × sub-score).
- ARV discount +15.0/15.0
- Cash flow +8.3/30.0
- 1% rule +6.8/10.0
- Livability +4.0/5.0
- Schools +3.7/10.0
- Condition / age +2.5/5.0
- DSCR +2.3/10.0
- Rent growth +1.2/5.0
- Appreciation +0.0/10.0
$79,500
🖨 Deal sheet 📄 Offer letter ✓ Due diligence
Listing remarks MLS
NICE CONDO! With easy access to the 635 freeway and close to convenience stores. This second-floor condo has 1 bedroom and 1 bath. It features high ceilings and fireplace. WE MAKE IT EASY TO OWN. This is a great opportunity! Don't wait, call us today to get more information on the owner's easy terms and smooth process that may be able to put the deed in your name and make this your dream home.
Key facts
- High ceilings
- Fireplace
- Built 1982
Tags
Neighborhood map
What this means for you Summary
Snapshot
- This is a 1-bed/1.0-bath condo listed at $80k.
Deal economics
- At list price, monthly cash flow is $-73 ($-873/yr) — negative.
- The deal already cash-flows at list — no discount required.
- Meets the 1% rule at list price ($935 rent vs $80k).
- Recommended offer: $70k (12.0% below list) — sets the bar for market timing.
- Cap rate 5.2% vs local median 2.3% in Dallas — top-decile yield for the area; either an underpriced asset or a hidden risk that comps aren't pricing in. Stress-test before assuming the spread holds.
Location & tenants
- Location reads 81/100 on livability (#24 in TX, #1,380 nationally) — a professional / high-income tenant draw. Strengths: amenities A+, commute A+, housing A+; Watch: schools C-, crime F.
- Richardson ISD (urban): math 40% / reading 44% proficiency, ranked #316 of 826 in TX (top 38%) — families likely to look elsewhere, expect single-tenant / working-renter base with shorter leases.
- Market conditions: Rents falling (-5.3%/yr); 271 active listings in the ZIP; 40 comparable units currently listed for rent nearby; rentals leasing fast (median 3d on market — plan ~1-2 weeks tenant-placement turnaround); 12,577 units permitted in Dallas County in 2024 (6,829 in 5+ unit buildings).
Forward outlook
- Local home prices are declining (-3.0%/yr); year-one equity from $550 of loan paydown is wiped out by about $2k of value loss. Plan a longer hold.
- Dallas County population projected at +35% by 2050 — long-run rental-demand tailwind backs the buy-and-hold thesis.
Negotiation context
- It's been on market 409 days — a 12% lower offer ($70k) is reasonable based on typical stale-listing flexibility.
- 5 sale attempts since 7y ago; this cycle's ask has dropped $8k (9%) from the opening price — seller is motivated, your offer sets the floor, not the list.
Risks & watch-outs
- Watch-outs: HOA is 23% of rent.
- Climate carrying-cost: major wind risk, 27% chance of damaging wind over 30y; extreme-heat days projected 7→23/yr by 2055 (HVAC capex compounding) — expect insurance premiums to compound above CPI over the hold.
Questions for the listing agent
- What do current leases actually rent for vs. the listed asking? Can we see a recent rent roll and the last 12 months of T-12 income?
- It's been on market 409 days. Have you received any prior offers? Is the seller open to a 12% concession, seller financing, or rate buy-down credit?
- What does the HOA fee cover, when was the last increase, and are there any pending special assessments or reserve-fund shortfalls?
- Any open or pending special assessments — roof, HVAC, plumbing, elevator, façade? What's the per-unit balance and payoff schedule, and is the seller paying it off at close or rolling it to the buyer?
- Why hasn't it sold? Are there any deal-killer items the seller is aware of (foundation, flood, title, zoning, code violations)?
- Is there a deadline driving the sale (1031 exchange, divorce, estate, relocation)? That informs how much negotiation room exists.
- Crime grade is F in this area — have there been break-ins, vandalism, or insurance claims at this property in the last 3 years? What carrier currently insures it and at what premium?
- The area grade is low — what's the realistic commute time and amenity access for the typical tenant pool here? Any planned neighborhood developments (good or bad) we should know about?
- What's the average days-on-market for RENTAL listings here right now (not sales)? A rising rental-DOM trend means longer vacancies and softer asking-rent achievability than the comps imply.
- What's the recent tenant-quality profile in this submarket — average credit score on applications, eviction rate, late-payment / NSF rate, and stable-employment percentage? A property-management company in the area should have these aggregated.
- How much new apartment / multifamily construction is in the pipeline within 1–3 miles? Heavy new supply (>2% of stock underway) typically softens rents 12–24 months out; light construction supports rent growth.
Investment metrics
- 1% rule
- 1.18% ✓
- Cap rate
- 5.19%
- Cash-on-cash
- -3.92%
- DSCR
- 0.83
- GRM
- 7.1
CMA / ARV
- ARV (median comp)
- $100,424
- List price
- $79,500
- Delta
- -20.84%
- Verdict
- UNDERPRICED
- Comps
- 20 within 1.0 mi
Projected returns pro-forma
-3.0% appreciation · 0.0% rent growth · sell at horizon
- IRR
- -28.0%
- Equity multiple
- 0.10×
- Total profit
- $-20,081
- Equity at exit
- $11,854
- IRR
- -58.1%
- Equity multiple
- -0.50×
- Total profit
- $-33,329
- Equity at exit
- $6,874
Cash invested: $22,260 (down + closing). Projections, not guarantees.
Landlord ↔ Tenant lean methodology
- Overall (STATE)
- 87 Strongly Landlord-Friendly
- State Texas
- 87 Strongly Landlord-Friendly · R+5
- County
- — inherits STATE
- City
- — inherits STATE
ZIP-level market 75243
- Rents YoY
- -5.3%
- Active inventory
- 271
- Price-to-rent
- 7.1×
Monthly cashflow live
- Estimated rent
- $935 high interval (Pro) →
- Mortgage (P&I)
- −$417
- Tax from tax record
- −$150 /mo · $1,801/yr
- Insurance
- −$33
- HOA est. from 2 same-building comps
- −$211
- Vacancy / Maint / Mgmt
- −$196
- Net cashflow
- $-73
Break-even live
UW: 25.0% down · 7.5% · 30yr · 1.5% tax · 5.0% vac · 8.0% maint · 8.0% mgmt
Financing live
Cash to close
- Down payment
- $19,875
- Closing costs
- $2,385
- Reserves months
- —
- Total cash needed
- —
Loan-product check · same deal, 3 products live
Conventional
25% down · 7.5% · 30yr
- Down + closing
- —
- Monthly P&I
- —
- Monthly cashflow
- —
- DSCR
- —
- Eligible?
- —
Personal DTI + credit; lowest rate.
DSCR
20% down · 8.5% · 30yr
- Down + closing
- —
- Monthly P&I
- —
- Monthly cashflow
- —
- DSCR
- —
- Eligible?
- —
No personal income docs; deal must DSCR.
Hard money
10% down · 12.0% · 12mo
- Down + closing
- —
- Monthly P&I
- —
- Monthly cashflow
- —
- DSCR
- —
- Eligible?
- —
Short-term bridge; refi at stabilization.
Rent comps 40 comps
| Address | Beds | Baths | Sqft | Rent | $/sqft | DOM | Units | Dist |
|---|---|---|---|---|---|---|---|---|
| 9747 Whitehurst Dr #87 Dallas, TX | 1.0 | 1.0 | 573 | $1,000 | $1.75 | 43d | 1 | 0.03mi |
| 9911 Whitehurst Dr Dallas, TX | 2.0 | 1.0–2.0 | 738 | $984 | $1.33 | 1d | 27 | 0.03mi |
| 9917 Whitehurst Dr Dallas, TX | 1.0 | 1.0 | 553 | $932 | $1.69 | 24d | 1 | 0.09mi |
| 9850 Whitehurst Dr Dallas, TX | 2.0 | 1.0–2.0 | 781 | $1,046 | $1.34 | 1d | 25 | 0.12mi |
| 8856 Fair Oaks Xing Dallas, TX | 1.0 | 1.0 | 550 | $929 | $1.69 | 43d | 1 | 0.19mi |
| 9701 W Ferris Branch Blvd Dallas, TX | 1.0–2.0 | 1.0–2.5 | 862 | $799 | $0.93 | 1d | 4 | 0.22mi |
| 9633 W Ferris Branch Blvd Dallas, TX | 1.0 | 1.0 | 663 | $1,076 | $1.62 | 1d | 22 | 0.22mi |
| 8600 Coppertowne Ln #502 Dallas, TX | 1.0 | 1.0 | 720 | $1,300 | $1.81 | 1d | 1 | 0.23mi |
| 8600 Coppertowne Ln #502 Dallas, TX | 1.0 | 1.0 | 720 | $1,400 | $1.94 | 17d | 1 | 0.23mi |
| 9690 Forest Ln Dallas, TX | 3.0 | 1.0–2.0 | 838 | $1,088 | $1.30 | 1d | 31 | 0.49mi |
| 10928 Audelia Rd Dallas, TX | 1.0–2.0 | 1.0–2.0 | 748 | $849 | $1.14 | 1d | 23 | 0.51mi |
| 11606 Audelia Rd Dallas, TX | 1.0 | 1.0 | 741 | $925 | $1.25 | 24d | 1 | 0.56mi |
| 8309 Skillman St Dallas, TX | 1.0 | 1.0 | 670 | $880 | $1.31 | 13d | 1 | 0.56mi |
| 8309 Skillman St Dallas, TX | 1.0 | 1.0 | 670 | $880 | $1.31 | 20d | 1 | 0.56mi |
| 11600 Audelia Rd Dallas, TX | 1.0–2.0 | 1.0–2.0 | 877 | $799 | $0.91 | 4d | 18 | 0.59mi |
| 10075 Royal Ln Dallas, TX | 1.0–2.0 | 1.0–2.0 | 868 | $1,000 | $1.15 | 4d | 3 | 0.60mi |
| 11620 Audelia Rd Dallas, TX | 1.0–2.0 | 1.0–2.0 | 889 | $880 | $0.99 | 2d | 12 | 0.63mi |
| 9669 Forest Ln Dallas, TX | 1.0–2.0 | 1.0–2.0 | 827 | $650 | $0.79 | 3d | 36 | 0.64mi |
| 9900 Adleta Blvd Dallas, TX | 1.0–2.0 | 1.0–2.0 | 710 | $849 | $1.20 | 1d | 56 | 0.65mi |
| 9601 Forest Ln #516 Dallas, TX | 1.0 | 1.0 | 675 | $800 | $1.19 | 14d | 1 | 0.66mi |
| 11700 Audelia Rd Dallas, TX | 1.0–2.0 | 1.0–2.0 | 830 | $944 | $1.14 | 7d | 15 | 0.67mi |
| 11515 Leisure Dr Dallas, TX | 1.0–2.0 | 1.0–2.0 | 781 | $675 | $0.86 | 2d | 27 | 0.67mi |
| 9737 Forest Ln Dallas, TX | 1.0–2.0 | 1.0–2.0 | 650 | $700 | $1.08 | 16d | 30 | 0.68mi |
| 10028 Royal Ln Dallas, TX | 1.0–3.0 | 1.0–2.5 | 971 | $760 | $0.78 | 1d | 36 | 0.69mi |
| 9450 Forest Springs Dr Dallas, TX | 1.0–3.0 | 1.0–2.5 | 1027 | $849 | $0.83 | 4d | 69 | 0.73mi |
| 9637 Forest Ln Dallas, TX | 1.0–3.0 | 1.0–2.0 | 1006 | $961 | $0.95 | 1d | 14 | 0.73mi |
| 9959 Adleta Blvd Dallas, TX | 1.0–2.0 | 1.0–2.0 | 765 | $616 | $0.80 | 1d | 28 | 0.74mi |
| 9920 Forest Ln Dallas, TX | 1.0 | 1.0 | 739 | $1,048 | $1.42 | 7d | 2 | 0.74mi |
| 9920 Forest Ln Dallas, TX | 1.0–2.0 | 1.0–2.0 | 882 | $955 | $1.08 | 21d | 3 | 0.74mi |
| 9350 Skillman St Dallas, TX | 1.0–2.0 | 1.0–2.0 | 772 | $727 | $0.94 | 1d | 207 | 0.75mi |
| 11991 Audelia Rd Dallas, TX | 1.0–2.0 | 1.0–2.0 | 827 | $740 | $0.89 | 1d | 36 | 0.82mi |
| 8110 Skillman St Dallas, TX | 1.0–2.0 | 1.0–2.0 | 660 | $850 | $1.29 | 2d | 5 | 0.85mi |
| 12121 Audelia Rd Dallas, TX | 1.0–2.0 | 1.0–2.0 | 862 | $700 | $0.81 | 1d | 41 | 0.86mi |
| 12111 Audelia Rd Dallas, TX | 1.0–2.0 | 1.0–2.0 | 862 | $675 | $0.78 | 1d | 42 | 0.90mi |
| 9505 Royal Ln Dallas, TX | 1.0–2.0 | 1.0–2.0 | 854 | $711 | $0.83 | 1d | 40 | 0.92mi |
| 9600 Royal Ln Dallas, TX | 1.0–2.0 | 1.0 | 829 | $995 | $1.20 | 24d | 3 | 0.98mi |
| 9302 Forest Ln Dallas, TX | 1.0 | 1.0 | 570 | $1,019 | $1.79 | 12d | 1 | 1.04mi |
| 9520 Royal Ln Dallas, TX | 1.0–2.0 | 1.0–2.0 | 656 | $850 | $1.30 | 2d | 2 | 1.04mi |
| 9302 Forest Ln Unit 9323 Dallas, TX | 1.0 | 1.0 | 570 | $1,065 | $1.87 | 13d | 1 | 1.04mi |
| 9302 Forest Ln Unit 9376 Dallas, TX | 1.0 | 1.0 | 570 | $1,027 | $1.80 | 2d | 1 | 1.04mi |
HOA detail condo
- Monthly dues
- $0 · $0/yr
- Assessments
- None detected in remarks — confirm with the listing agent.
Listing history 33 events
-
2026-06-18days on market $79,500 Active 409 DOM
-
2026-06-17days on market $79,500 Active 408 DOM
-
2026-06-16days on market $79,500 Active 407 DOM
-
2026-06-15days on market $79,500 Active 406 DOM
-
2026-06-13days on market $79,500 Active 404 DOM
-
2026-06-09days on market $79,500 Active 400 DOM
-
2026-06-08days on market $79,500 Active 399 DOM
-
2026-06-07days on market $79,500 Active 398 DOM
-
2026-06-04days on market $79,500 Active 395 DOM
-
2026-06-03days on market $79,500 Active 394 DOM
-
2026-06-02days on market $79,500 Active 393 DOM
-
2026-06-01days on market $79,500 Active 392 DOM
-
2026-05-31days on market $79,500 Active 391 DOM
-
2026-02-20price $79,500 396-char remark
Show marketing remark (396 chars)
NICE CONDO! With easy access to the 635 freeway and close to convenience stores. This second-floor condo has 1 bedroom and 1 bath. It features high ceilings and fireplace. WE MAKE IT EASY TO OWN. This is a great opportunity! Don't wait, call us today to get more information on the owner's easy terms and smooth process that may be able to put the deed in your name and make this your dream home.
-
2025-11-24price $84,149 396-char remark
Show marketing remark (396 chars)
NICE CONDO! With easy access to the 635 freeway and close to convenience stores. This second-floor condo has 1 bedroom and 1 bath. It features high ceilings and fireplace. WE MAKE IT EASY TO OWN. This is a great opportunity! Don't wait, call us today to get more information on the owner's easy terms and smooth process that may be able to put the deed in your name and make this your dream home.
-
2025-05-31historical
-
2025-05-05$87,149 Active 396-char remark
Show marketing remark (396 chars)
NICE CONDO! With easy access to the 635 freeway and close to convenience stores. This second-floor condo has 1 bedroom and 1 bath. It features high ceilings and fireplace. WE MAKE IT EASY TO OWN. This is a great opportunity! Don't wait, call us today to get more information on the owner's easy terms and smooth process that may be able to put the deed in your name and make this your dream home.
-
2024-11-27price $87,149
-
2024-05-01$99,999 Active
-
2020-05-28soldstatus
-
2020-05-22soldstatus Sold
-
2020-05-14status Pending
-
2020-05-09historical Active Option Contract
-
2020-04-24price $59,800
-
2020-04-15price $64,900
-
2020-03-24$66,560 Active
-
2019-12-02historical
-
2019-11-12$63,976 Active
-
2019-07-19soldstatus Sold
-
2019-07-19soldstatus
-
2019-07-08status Pending
-
2019-06-30historical Active Option Contract
-
2019-06-19$60,000 Active
ⓘ Source: listings_history table (triggers on properties + properties_extension) + one-shot
backfill from property_details.listing_events for pre-trigger history.
Tax reassessment forecast TX · Resets to sale price
- Current annual tax
- $1,801 · $150/mo
- Projected year-2 tax
- $1,801 · $150/mo
- Expected delta
- $0/yr ($0/mo · 0.0%)
ⓘ Screening estimate from a state-policy table — verify with the county assessor before closing.
Climate risk First Street
- Flood 1/10 Low FEMA zone X (unshaded) · 0% chance over 30 yrs
- Wildfire 1/10 Low
- Heat 7/10 Severe 7 d/yr ≥109°F today · 23 d/yr by 30 yrs out
- Wind 6/10 Major 27% chance of damaging wind over 30 yrs
- Air quality 3/10 Moderate 3 unhealthy d/yr today · 3 by 30 yrs out
Nearby sold comps map
Loading sold comps map…
Walkable amenities ~0.75 mi
Loading nearby amenities…
Taxation est. · year 1
- Rental income
- $11,216
- − Mortgage interest
- −$4,453
- − Property taxes
- −$1,801
- − Insurance
- −$398
- − Repairs & maintenance
- −$897
- − Management
- −$897
- − HOA
- −$2,532
- − Depreciation
- −$2,313
- Taxable loss
- −$2,076
- Est. tax savings @ 24.0%
- +$498
- After-tax cash flow
- $-375/yr
For passive investors: Depreciation is non-cash, so a rental often shows a tax loss while cash-flowing — sheltering income. Rental losses are passive: they offset passive income freely, and up to $25,000/yr can offset ordinary (W-2) income if you actively participate and your MAGI is under $100k (phasing out to $0 by $150k); unused losses carry forward. On sale, claimed depreciation is recaptured at up to 25%, and gains may owe capital-gains tax (a 1031 exchange can defer both). Figures are a year-1 estimate at your 24.0% rate — not tax advice; consult a CPA.
Schools (NCES district)
- District
- Richardson ISD
- NCES district ID
- 4837020
- Math proficiency
- 40% ▼ -14.00%
- Reading proficiency
- 44% ▼ -6.00%
- Median HH income
- $54,609
- Composite
- 36.58/100
- National rank
- #4633
- State rank
- #316 of 826 in TX
Livability — Dallas
- Score
- 81/100
- State rank
- #24
- US rank
- #1380
Category grades
Schools grade is shown separately in the Schools card above.
Census & demographics
- Census place
- Dallas, TX
- County
- Dallas County · 2,612,404 people
- City population
- 1,168,437
- Metro
- Dallas-Fort Worth-Arlington, TX
- Population (ZIP)
- 63,481
- Household income
- $53,618
- Rent vs Own
- Severe rent burden
- 5970.0
Population outlook (Dallas County) Hauer SSP2
- Today (2025)
- 2,979,839 people
- By 2030
- 3,191,823 · +7.1%
- By 2040
- 3,619,611 · +21.5%
- By 2050
- 4,026,915 · +35.1%
- By 2075
- 4,957,073 · +66.4%
- By 2100
- 5,508,725 · +84.9%
Race, ethnicity, and origin ACS 2023
- Neighborhood character
- Highly diverse neighborhood (Simpson 0.71)
- Race & ethnicity
- Black 43% Hispanic / Latino 23% White 22% Two or more races 10% Asian 7%
- Hispanic origin (detail)
- Mexican 15%
- Common ancestry
- Swiss 1% Slovak 1% Lithuanian 1%
- Foreign-born
- 34% · Canada, Vietnam, South Korea
- Languages at home
- 56% English-only · Spanish 21% Other Indo-European 3% French/Haitian/Cajun 2%
Political lean MEDSL · Dallas
- 2024 margin
- Strong D (+22.2) · D 60.2% · R 38.0% · Other 1.8%
- 2008→2024 swing
- +6.9pp toward D · 2008: 15.3pp · 2024: 22.2pp
- All cycles
- 2024: D+22.2 2020: D+31.6 2016: D+26.2 2012: D+15.4 2008: D+15.3
Not yet ingested
- Civics
- —
Market trends
- HPI YoY
- ▼ -203.08%
- Current HPI
- 317.5287
- Rent YoY
- ▼ -5.31%
- Metro
- Dallas-Fort Worth-Arlington, TX
- State GDP YoY
- ▲ 3.95%
- F500 in state
- 110
Industry mix (Fortune 500 HQ in TX)
| Industry | F500 HQs | Revenue |
|---|---|---|
| Energy | 16 | $1,198B |
|
||
| Technology | 5 | $198B |
|
||
| Engineering / Construction | 4 | $72B |
|
||
| Energy Services | 3 | $60B |
|
||
| Utilities | 3 | $41B |
|
||
| Healthcare | 2 | $330B |
|
||
Price history
+32.5% since first listed20 events — show timeline
- 2026-02-20 Price Changed $79,500 HARMLS
- 2025-11-24 Price Changed $84,149 HARMLS
- 2025-05-31 Listing Removed — NTREIS
- 2025-05-05 Listed $87,149 HARMLS
- 2024-11-27 Price Changed $87,149 NTREIS
- 2024-05-01 Listed $99,999 NTREIS
- 2020-05-28 Sold (Public Records) — Public Records
- 2020-05-22 Sold (MLS) — NTREIS
- 2020-05-14 Pending — NTREIS
- 2020-05-09 Contingent — NTREIS
- 2020-04-24 Price Changed $59,800 NTREIS
- 2020-04-15 Price Changed $64,900 NTREIS
- 2020-03-24 Listed $66,560 NTREIS
- 2019-12-02 Listing Removed — NTREIS
- 2019-11-12 Listed $63,976 NTREIS
- 2019-07-19 Sold (Public Records) — Public Records
- 2019-07-19 Sold (MLS) — NTREIS
- 2019-07-08 Pending — NTREIS
- 2019-06-30 Contingent — NTREIS
- 2019-06-19 Listed $60,000 NTREIS
Property tax history
+6.2%/yrLatest (2025): $1,801 · +5.9% YoY. Source: county tax records.
Cash-flow waterfall
monthlySold comps — $/sqft
last 12 mo · ≤1 miLoading sold comps…