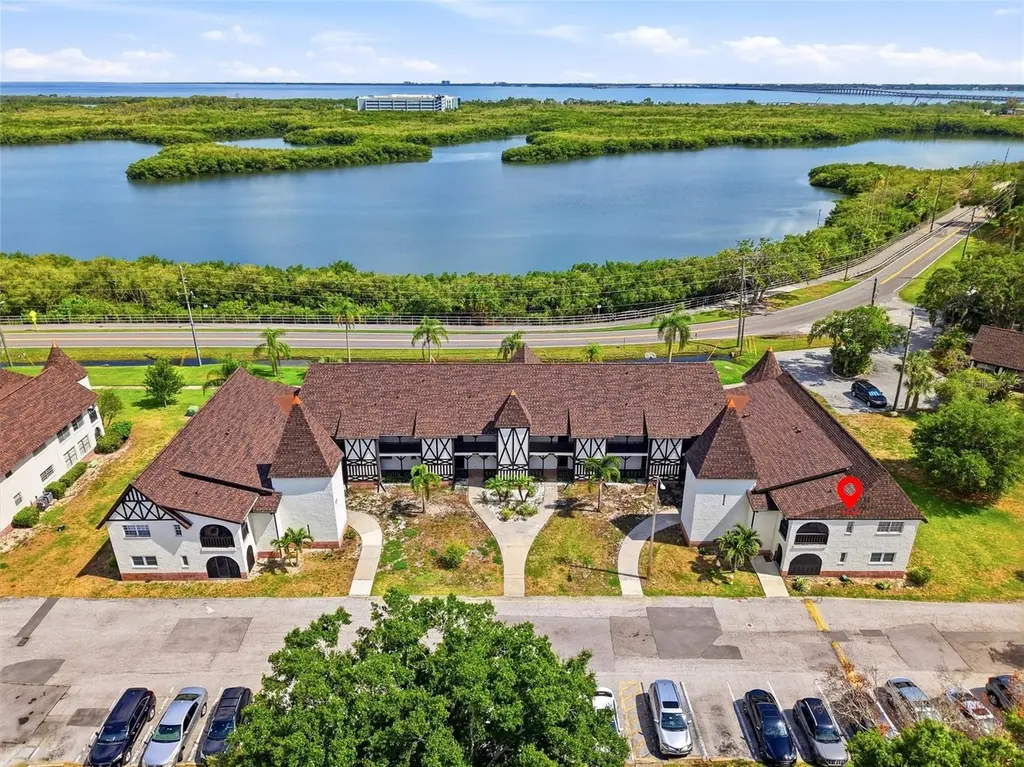
316 N Bayshore Blvd #208 · Clearwater, FL
Flood risk 7/10 · Major
- FEMA flood zone
- X (unshaded)
- Chance of flooding over 30 yrs
- 0.77%
- Est. flood insurance / yr
- $507 – $1,088
Fire risk 1/10 · Minimal
- Est. fire insurance / yr
- $947 – $1,759
Heat risk 10/10 · Severe
- Hot days now (above 107°F)
- 7 days/yr
- Hot days in 30 yrs
- 28 days/yr
Wind risk 10/10 · Severe
- Chance of severe wind over 30 yrs
- 99.0%
Air-quality risk 3/10 · Minor
- Unhealthy air days now
- 3 days/yr
- Unhealthy air days in 30 yrs
- 3 days/yr
Risk factors via First Street. Map © Google.
Why this score? — see what drove the C grade
The composite is a weighted blend of 9 inputs, each scored 0–100. Each bar is that input's sub-score; the figure is the points it added to the 100-point composite (weight × sub-score).
- Cash flow +20.7/30.0
- 1% rule +10.0/10.0
- ARV discount +7.5/15.0
- DSCR +6.6/10.0
- Schools +4.3/10.0
- Livability +4.1/5.0
- Condition / age +2.5/5.0
- Rent growth +1.1/5.0
- Appreciation +0.0/10.0
$120,000
🖨 Deal sheet 📄 Offer letter ✓ Due diligence
Listing remarks
Opportunity knocks in desirable Harbour Towne! This 1-bedroom, 1.5-bath second-floor corner unit offers an excellent chance to create your own Florida retreat or investment property. Featuring an original kitchen and baths ready for cosmetic updates, this condo is priced accordingly and offers tremendous value for buyers looking to add their personal touch. Enjoy additional living space on the enclosed screened balcony, perfect for morning coffee or relaxing evenings. The corner-unit location provides added privacy and natural light. Residents of this pet-friendly community enjoy access to a variety of amenities, including a community pool, clubhouse, and tennis courts. Outdoor enthusiasts
Key facts
- Clubhouse
- Community pool
- Tennis courts
Tags
Property features AI
Finance
- Other: Unfurnished; Buyer approval required for association
- Financial info: Lease restrictions apply
- HOA & community: Monthly condo fee of $549; Annual association fees totaling $6,588; Association approval required; Association amenities include pool, clubhouse, fitness center, tennis courts, maintenance (grounds & structure), management, trash, sewer, water, common area taxes, escrow reserves fund, recreational facilities, community mailbox; Pets allowed (dogs OK) with max pet weight 20 lbs
Exterior
- Parking: Paved road access
- Utilities: Public water; Public sewer; Electricity connected; Cable available; Sewer connected
- Home design: Condominium; 2 total stories (unit on 2nd floor); Faces north; Entry level: second floor
- Construction: Block and frame construction; Shingle roof; Slab foundation; Built as part of a multi-unit building (Building 316)
- Exterior features: Balcony; Sidewalk; Tennis court(s)
Interior
- Kitchen: Dishwasher; Range; Refrigerator; Electric water heater
- Bedrooms: 1 bedroom
- Flooring: Carpet; Linoleum; Tile
- Bathrooms: 1 full bath; 1 half bath
- Heating & cooling: Central heating (electric); Central air conditioning
- Interior features: Living room/dining room combo; Thermostat; Walk-in closet(s); Elevator in building
- Laundry & utility: No in-unit laundry (none listed)
Neighborhood map
What this means for you Summary
Snapshot
- This is a 1-bed/1.5-bath condo listed at $120k.
Deal economics
- At list price, monthly cash flow is $96 ($1k/yr) — positive.
- The deal already cash-flows at list — no discount required.
- Meets the 1% rule at list price ($2k rent vs $120k).
- Recommended offer: $118k (1.5% below list) — sets the bar for market timing.
- Cap rate 7.9% vs local median 2.9% in Clearwater — top-decile yield for the area; either an underpriced asset or a hidden risk that comps aren't pricing in. Stress-test before assuming the spread holds.
Location & tenants
- Location reads 82/100 on livability (#60 in FL, #988 nationally) — a professional / high-income tenant draw. Strengths: commute A+, housing A+, health & safety A+; Watch: schools C-, employment C-.
- Pinellas (suburban): math 51% / reading 51% proficiency, ranked #31 of 73 in FL (top 42%) — acceptable for families but not a draw, mixed tenant base, ~2y average lease.
- Market conditions: Rents falling (-5.6%/yr); 116 active listings in the ZIP; 14 comparable units currently listed for rent nearby; rentals at typical pace (median 17d on market — plan ~3-4 weeks tenant-placement turnaround); 2,676 units permitted in Pinellas County in 2024 (1,422 in 5+ unit buildings).
- This rent runs 32% of the median local income ($67k/yr) — at the standard rent-burdened threshold; future hikes will face affordability resistance.
Forward outlook
- Local home prices are declining (-3.0%/yr); year-one equity from $830 of loan paydown is wiped out by about $4k of value loss. Plan a longer hold.
- Pinellas County population projected at +14% by 2050 — modest demand growth; plan on rents tracking national, not racing it.
Negotiation context
- It's been on market 26 days — a 2% lower offer ($118k) is reasonable based on typical stale-listing flexibility.
- Current owner paid $33k; list at $120k implies a 264% gain — meaningful room to come down on a strong offer.
Risks & watch-outs
- Watch-outs: flood insurance adds $66/mo; HOA is 31% of rent.
- Climate carrying-cost: major flood risk; severe wind risk, 99% chance of damaging wind over 30y; extreme-heat days projected 7→28/yr by 2055 (HVAC capex compounding) — expect insurance premiums to compound above CPI over the hold.
Questions for the listing agent
- Built in 1972 — when were the roof, HVAC, electrical panel, plumbing, and water heater last replaced?
- What's the actual annual flood-insurance premium (NFIP or private), and is the property in a SFHA with mandatory coverage?
- What does the HOA fee cover, when was the last increase, and are there any pending special assessments or reserve-fund shortfalls?
- Any open or pending special assessments — roof, HVAC, plumbing, elevator, façade? What's the per-unit balance and payoff schedule, and is the seller paying it off at close or rolling it to the buyer?
- Is there a deadline driving the sale (1031 exchange, divorce, estate, relocation)? That informs how much negotiation room exists.
- What's the average days-on-market for RENTAL listings here right now (not sales)? A rising rental-DOM trend means longer vacancies and softer asking-rent achievability than the comps imply.
- What's the recent tenant-quality profile in this submarket — average credit score on applications, eviction rate, late-payment / NSF rate, and stable-employment percentage? A property-management company in the area should have these aggregated.
- How much new apartment / multifamily construction is in the pipeline within 1–3 miles? Heavy new supply (>2% of stock underway) typically softens rents 12–24 months out; light construction supports rent growth.
Investment metrics
- 1% rule
- 1.50% ✓
- Cap rate
- 7.92%
- Cash-on-cash
- 5.81%
- DSCR
- 1.26
- GRM
- 5.6
CMA / ARV
No comps found within radius.
Projected returns pro-forma
-3.0% appreciation · 0.0% rent growth · sell at horizon
- IRR
- -16.0%
- Equity multiple
- 0.46×
- Total profit
- $-18,250
- Equity at exit
- $17,892
- IRR
- -19.1%
- Equity multiple
- 0.20×
- Total profit
- $-27,023
- Equity at exit
- $10,375
Cash invested: $33,600 (down + closing). Projections, not guarantees.
Landlord ↔ Tenant lean methodology
- Overall (STATE)
- 87 Strongly Landlord-Friendly
- State Florida
- 87 Strongly Landlord-Friendly · R+3
- County
- — inherits STATE
- City
- — inherits STATE
ZIP-level market 33759
- Rents YoY
- -5.6%
- Active inventory
- 116
- Price-to-rent
- 5.6×
Monthly cashflow live
- Estimated rent
- $1,800 high interval (Pro) →
- Mortgage (P&I)
- −$629
- Tax from tax record
- −$31 /mo · $368/yr
- Insurance
- −$50
- Flood insurance flood zone
- −$66 /mo · $798/yr
- HOA
- −$549
- Vacancy / Maint / Mgmt
- −$378
- Net cashflow
- $96
Break-even live
UW: 25.0% down · 7.5% · 30yr · 1.5% tax · 5.0% vac · 8.0% maint · 8.0% mgmt
Financing live
Cash to close
- Down payment
- $30,000
- Closing costs
- $3,600
- Reserves months
- —
- Total cash needed
- —
Loan-product check · same deal, 3 products live
Conventional
25% down · 7.5% · 30yr
- Down + closing
- —
- Monthly P&I
- —
- Monthly cashflow
- —
- DSCR
- —
- Eligible?
- —
Personal DTI + credit; lowest rate.
DSCR
20% down · 8.5% · 30yr
- Down + closing
- —
- Monthly P&I
- —
- Monthly cashflow
- —
- DSCR
- —
- Eligible?
- —
No personal income docs; deal must DSCR.
Hard money
10% down · 12.0% · 12mo
- Down + closing
- —
- Monthly P&I
- —
- Monthly cashflow
- —
- DSCR
- —
- Eligible?
- —
Short-term bridge; refi at stabilization.
Rent comps 14 comps
| Address | Beds | Baths | Sqft | Rent | $/sqft | DOM | Units | Dist |
|---|---|---|---|---|---|---|---|---|
| 237 S McMullen Booth Rd #50 Clearwater, FL | 1.0 | 1.0 | 747 | $1,500 | $2.01 | 24d | 1 | 0.58mi |
| 359 S McMullen Booth Rd #122 Clearwater, FL | 1.0 | 1.0 | 747 | $1,290 | $1.73 | 7d | 1 | 0.62mi |
| 209 S McMullen Booth Rd #188 Clearwater, FL | 1.0 | 1.0 | 747 | $2,200 | $2.95 | 16d | 1 | 0.65mi |
| 239 S McMullen Booth Rd #38 Clearwater, FL | 1.0 | 1.0 | 747 | $2,000 | $2.68 | 24d | 1 | 0.65mi |
| 353 S McMullen Booth Rd #133 Clearwater, FL | 1.0 | 1.0 | 747 | $1,450 | $1.94 | 24d | 1 | 0.66mi |
| 361 S McMullen Booth Rd #112 Clearwater, FL | 1.0 | 1.0 | 747 | $2,000 | $2.68 | 24d | 1 | 0.72mi |
| 2975 Gulf To Bay Blvd Clearwater, FL | 2.0 | 1.0–2.0 | 874 | $3,691 | $4.22 | 4d | 49 | 1.00mi |
| 2981 Gulf To Bay Blvd Clearwater, FL | 1.0–3.0 | 1.0–2.0 | 1198 | $2,184 | $1.82 | 3d | 27 | 1.02mi |
| 1160 7th St S Safety Harbor, FL | 2.0 | 1.0 | 650 | $1,645 | $2.53 | 7d | 1 | 1.10mi |
| 1158 7th St S Unit 1160 Safety Harbor, FL | 2.0 | 1.0 | 650 | $1,645 | $2.53 | 7d | 1 | 1.11mi |
| 2909 Gulf To Bay Blvd Clearwater, FL | 1.0–2.0 | 1.0–2.0 | 931 | $1,279 | $1.37 | 3d | 9 | 1.14mi |
| 380 3rd St S Unit 3B Safety Harbor, FL | — | 1.0 | 375 | $1,195 | $3.19 | 3d | 1 | 1.48mi |
| 380 3rd St S Unit 4A Safety Harbor, FL | 2.0 | 1.0 | 700 | $2,395 | $3.42 | 17d | 1 | 1.48mi |
| 380 3rd St S Unit 2B Safety Harbor, FL | — | 1.0 | 375 | $1,595 | $4.25 | 24d | 1 | 1.48mi |
HOA detail condo
- Monthly dues
- $549 · $6,588/yr
- Likely covers
- pool
- Assessments
- None detected in remarks — confirm with the listing agent.
Listing history 17 events
-
2026-06-18days on market $120,000 Active 26 DOM
-
2026-06-17days on market $120,000 Active 25 DOM
-
2026-06-16days on market $120,000 Active 24 DOM
-
2026-06-15days on market $120,000 Active 23 DOM
-
2026-06-13days on market $120,000 Active 21 DOM
-
2026-06-09days on market $120,000 Active 17 DOM
-
2026-06-08days on market $120,000 Active 16 DOM
-
2026-06-07days on market $120,000 Active 15 DOM
-
2026-06-04days on market $120,000 Active 12 DOM
-
2026-06-03days on market $120,000 Active 11 DOM
-
2026-06-02days on market $120,000 Active 10 DOM
-
2026-06-01days on market $120,000 Active 9 DOM
-
2026-05-31days on market $120,000 Active 8 DOM
-
2026-05-23$120,000 Active
-
1986-05-08soldstatus $33,000
-
1985-07-01soldstatus $32,400
-
1981-09-01soldstatus $41,000
ⓘ Source: listings_history table (triggers on properties + properties_extension) + one-shot
backfill from property_details.listing_events for pre-trigger history.
Tax reassessment forecast FL · Resets to sale price
- Current annual tax
- $368 · $31/mo
- Projected year-2 tax
- $996 · $83/mo
- Expected delta
- +$628/yr (+$52/mo · 170.7%)
ⓘ Screening estimate from a state-policy table — verify with the county assessor before closing.
Climate risk First Street
- Flood 7/10 Severe FEMA zone X (unshaded) · 77% chance over 30 yrs
- Wildfire 1/10 Low
- Heat 10/10 Extreme 7 d/yr ≥107°F today · 28 d/yr by 30 yrs out
- Wind 10/10 Extreme 99% chance of damaging wind over 30 yrs
- Air quality 3/10 Moderate 3 unhealthy d/yr today · 3 by 30 yrs out
Nearby sold comps map
Loading sold comps map…
Walkable amenities ~0.75 mi
Loading nearby amenities…
Taxation est. · year 1
- Rental income
- $21,597
- − Mortgage interest
- −$6,722
- − Property taxes
- −$368
- − Insurance
- −$1,398
- − Repairs & maintenance
- −$1,728
- − Management
- −$1,728
- − HOA
- −$6,588
- − Depreciation
- −$3,491
- Taxable loss
- −$425
- Est. tax savings @ 24.0%
- +$102
- After-tax cash flow
- $1,258/yr
For passive investors: Depreciation is non-cash, so a rental often shows a tax loss while cash-flowing — sheltering income. Rental losses are passive: they offset passive income freely, and up to $25,000/yr can offset ordinary (W-2) income if you actively participate and your MAGI is under $100k (phasing out to $0 by $150k); unused losses carry forward. On sale, claimed depreciation is recaptured at up to 25%, and gains may owe capital-gains tax (a 1031 exchange can defer both). Figures are a year-1 estimate at your 24.0% rate — not tax advice; consult a CPA.
Schools (NCES district)
- District
- Pinellas
- NCES district ID
- 1201560
- Math proficiency
- 51% ▼ -5.00%
- Reading proficiency
- 51% ▼ -3.00%
- Median HH income
- $46,270
- Composite
- 43.27/100
- National rank
- #3046
- State rank
- #31 of 73 in FL
Livability — Clearwater
- Score
- 82/100
- State rank
- #60
- US rank
- #988
Category grades
Schools grade is shown separately in the Schools card above.
Census & demographics
- Census place
- Clearwater, FL
- County
- Pinellas County · 939,478 people
- City population
- 170,933
- Metro
- Tampa-St. Petersburg-Clearwater, FL
- Population (ZIP)
- 17,557
- Household income
- $67,492
- Rent vs Own
- Severe rent burden
- 1209.0
Population outlook (Pinellas County) Hauer SSP2
- Today (2025)
- 1,027,532 people
- By 2030
- 1,063,586 · +3.5%
- By 2040
- 1,125,020 · +9.5%
- By 2050
- 1,168,637 · +13.7%
- By 2075
- 1,265,188 · +23.1%
- By 2100
- 1,260,357 · +22.7%
Race, ethnicity, and origin ACS 2023
- Neighborhood character
- Majority White (65%)
- Race & ethnicity
- White 65% Hispanic / Latino 19% Two or more races 14% Black 7% Asian 3%
- Hispanic origin (detail)
- Mexican 7% Puerto Rican 3% Cuban 3%
- Common ancestry
- Romanian 4% Slovak 3% Italian 2%
- Foreign-born
- 16% · Canada, Jamaica, Vietnam
- Languages at home
- 79% English-only · Spanish 12% Other Indo-European 4% Russian/Polish/Slavic 1%
Political lean MEDSL · Pinellas
- 2024 margin
- Lean R (+5.2) · D 46.9% · R 52.1%
- 2008→2024 swing
- -13.5pp toward R · 2008: 8.3pp · 2024: -5.2pp
- All cycles
- 2024: R+5.2 2020: D+0.2 2016: R+1.1 2012: D+5.6 2008: D+8.3
Not yet ingested
- Civics
- —
Market trends
- HPI YoY
- ▼ -249.16%
- Current HPI
- 343.0721
- Rent YoY
- ▼ -5.57%
- Metro
- Tampa-St. Petersburg-Clearwater, FL
- State GDP YoY
- ▲ 3.28%
- F500 in state
- 36
Industry mix (Fortune 500 HQ in FL)
| Industry | F500 HQs | Revenue |
|---|---|---|
| Industrial Technology | 2 | $29B |
|
||
| Insurance | 2 | $17B |
|
||
| Retail | 1 | $60B |
|
||
| Technology Distribution | 1 | $58B |
|
||
| Homebuilding | 1 | $35B |
|
||
| Technology Manufacturing | 1 | $35B |
|
||
Price history
+192.7% since first listed4 events — show timeline
- 2026-05-23 Listed $120,000 Stellar MLS as Distributed by MLS Grid
- 1986-05-08 Sold (Public Records) $33,000 Public Records
- 1985-07-01 Sold (Public Records) $32,400 Public Records
- 1981-09-01 Sold (Public Records) $41,000 Public Records
Property tax history
-8.0%/yrLatest (2025): $368 · +9.3% YoY. Source: county tax records.
Cash-flow waterfall
monthlySold comps — $/sqft
last 12 mo · ≤1 miLoading sold comps…