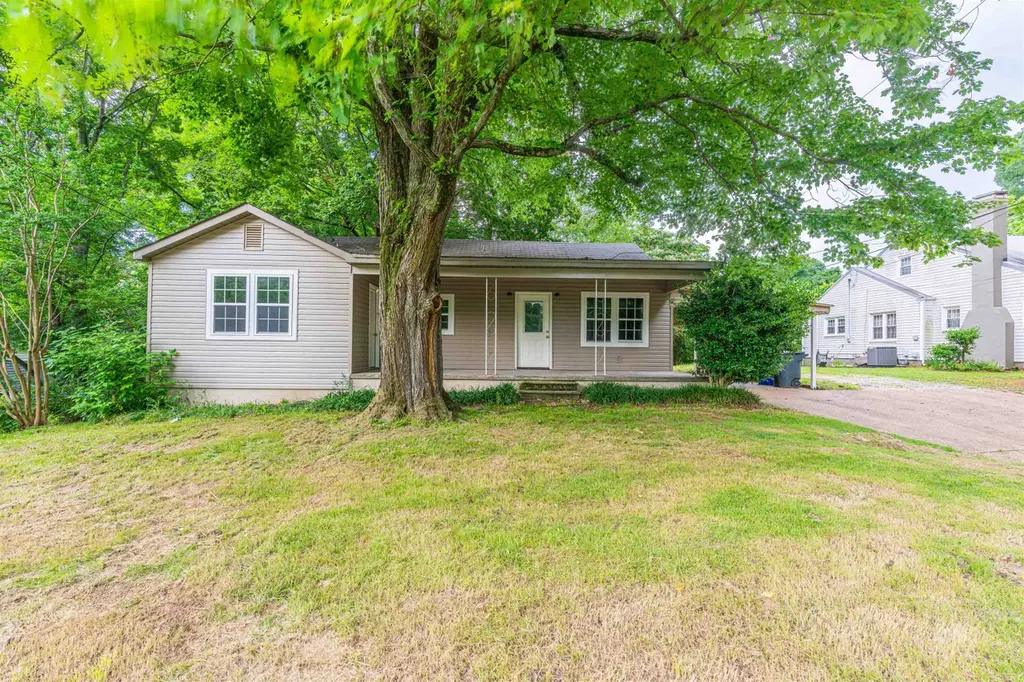
2232 N Wood Ave · Florence, AL
Flood risk 1/10 · Minimal
- FEMA flood zone
- X (unshaded)
- Chance of flooding over 30 yrs
- 0.0%
- Est. flood insurance / yr
- $507 – $1,088
Fire risk 3/10 · Minor
- Est. fire insurance / yr
- $916 – $1,700
Heat risk 6/10 · Moderate
- Hot days now (above 107°F)
- 7 days/yr
- Hot days in 30 yrs
- 19 days/yr
Wind risk 5/10 · Moderate
- Chance of severe wind over 30 yrs
- 23.0%
Air-quality risk 2/10 · Minimal
- Unhealthy air days now
- 0 days/yr
- Unhealthy air days in 30 yrs
- 1 days/yr
Risk factors via First Street. Map © Google.
Why this score? — see what drove the D+ grade
The composite is a weighted blend of 9 inputs, each scored 0–100. Each bar is that input's sub-score; the figure is the points it added to the 100-point composite (weight × sub-score).
- Cash flow +16.3/30.0
- ARV discount +8.1/15.0
- DSCR +5.0/10.0
- Livability +4.1/5.0
- Rent growth +4.0/5.0
- 1% rule +3.5/10.0
- Schools +3.0/10.0
- Condition / age +2.5/5.0
- Appreciation +0.0/10.0
$150,000
🖨 Deal sheet (PDF) 📄 Offer letter ✓ Due diligence
Listing remarks
Recently remodeled home minutes from UNA. This home has been remodeled, which includes new flooring, windows, kitchen, baths and laundry room. A perfect starter home for someone, or a great investment property. call today for your showing.
Key facts
- New kitchen
- New laundry room
- New baths
Tags
Property features AI
Exterior
- Parking: Carport (1 space)
- Utilities: Public sewer
- Home design: Single-family residential property
- Construction: Vinyl siding
- Exterior features: Shingle roof; 70' x 258' lot dimensions; Subdivision: Woodland Homes; Zoning: R1
Interior
- Kitchen: Dishwasher
- Bedrooms: 3 main-level bedrooms
- Flooring: Laminate
- Bathrooms: 2 full bathrooms
- Heating & cooling: Central air conditioning
- Interior features: Dishwasher; Laminate flooring; 8 total rooms
- Laundry & utility: Laundry inside
Neighborhood map
What this means for you Summary
Snapshot
- This is a 3-bed/2.0-bath single-family listed at $150k.
Deal economics
- At list price, monthly cash flow is $81 ($975/yr) — positive.
- The deal already cash-flows at list — no discount required.
- To meet the 1% rule (rent ≥ 1% of price), the offer needs to be $127k (15.1% below list).
- Recommended offer: $127k (15.1% below list) — sets the bar for 1% rule.
- Cap rate 6.9% vs local median 3.6% in Florence — top-decile yield for the area; either an underpriced asset or a hidden risk that comps aren't pricing in. Stress-test before assuming the spread holds.
Location & tenants
- Location reads 82/100 on livability (#4 in AL, #1,140 nationally) — a professional / high-income tenant draw. Strengths: amenities A+, commute A+, cost of living A+; Watch: crime F, employment F.
- Florence City (urban): math 28% / reading 44% proficiency, ranked #44 of 129 in AL (top 34%) — families likely to look elsewhere, expect single-tenant / working-renter base with shorter leases.
- Market conditions: Rents rising fast (+6.2%/yr); 268 active listings in the ZIP; 7 comparable units currently listed for rent nearby; rentals lingering (median 45d on market — plan ~5-8 weeks vacancy on turnover, expect pricing pressure); 100% of comp listings sitting > 30 days — soft ceiling on asking rent; 164 units permitted in Lauderdale County in 2024 (72 in 5+ unit buildings).
- This rent runs 33% of the median local income ($46k/yr) — at the standard rent-burdened threshold; future hikes will face affordability resistance.
Forward outlook
- Local home prices are declining (-3.0%/yr); year-one equity from $1k of loan paydown is wiped out by about $4k of value loss. Plan a longer hold.
Negotiation context
- Only 14 days on market — expect competitive offers; lowballing is unlikely to land.
- 3 sale attempts with the ask held roughly flat each time — persistent listings suggest the price (not the market) is what's stuck; bring a comps-based counter.
Risks & watch-outs
- Watch-outs: built in 1948 — expect roof / HVAC / electrical / plumbing capex.
- Climate carrying-cost: moderate wind risk, 23% chance of damaging wind over 30y; extreme-heat days projected 7→19/yr by 2055 (HVAC capex compounding) — expect insurance premiums to compound above CPI over the hold.
Questions for the listing agent
- Built in 1948 — when were the roof, HVAC, electrical panel, plumbing, and water heater last replaced?
- Is there a deadline driving the sale (1031 exchange, divorce, estate, relocation)? That informs how much negotiation room exists.
- Crime grade is F in this area — have there been break-ins, vandalism, or insurance claims at this property in the last 3 years? What carrier currently insures it and at what premium?
- The area grade is low — what's the realistic commute time and amenity access for the typical tenant pool here? Any planned neighborhood developments (good or bad) we should know about?
- What's the average days-on-market for RENTAL listings here right now (not sales)? A rising rental-DOM trend means longer vacancies and softer asking-rent achievability than the comps imply.
- What's the recent tenant-quality profile in this submarket — average credit score on applications, eviction rate, late-payment / NSF rate, and stable-employment percentage? A property-management company in the area should have these aggregated.
- How much new for-sale + rental construction is in the pipeline within 1–3 miles? Heavy new supply typically softens prices + rents 12–24 months out; constrained supply supports both.
Investment metrics
- 1% rule
- 0.85% ✗
- Cap rate
- 6.94%
- Cash-on-cash
- 2.32%
- DSCR
- 1.10
- GRM
- 9.8
CMA / ARV
- ARV (median comp)
- $151,912
- List price
- $150,000
- Delta
- -1.26%
- Verdict
- FAIR
- Comps
- 20 within 1.0 mi
Show comp detail 12 sales within ~0.75 mi
| Address | Dist | Beds/Ba | Sqft | Sold | Price | $/sf | Match |
|---|---|---|---|---|---|---|---|
| 120 Hampton Ave | 0.17mi | 3/2.0 | 1,048 (-9%) | 2mo | $145,000 | $138 | 75 |
| 2118 Mcburney Dr | 0.29mi | 3/1.0 | 1,289 (+12%) | 3mo | $177,000 | $137 | 60 |
| 142 Hampton Ave | 0.18mi | 2/1.0 (-1) | 1,274 (+11%) | 6mo | $145,000 | $114 | 59 |
| 145 E Duncan Ave | 0.54mi | 3/1.0 | 1,211 (+5%) | 4mo | $129,000 | $107 | 59 |
| 2326 Houston St | 0.16mi | 3/1.5 | 1,296 (+12%) | 14mo | $187,000 | $144 | 58 |
| 2021 Shade Ave | 0.40mi | 3/1.0 | 1,084 (-6%) | 13mo | $64,820 | $60 | 57 |
| 225 Garfield Ave | 0.69mi | 3/1.0 | 1,150 (-0%) | 11mo | $170,000 | $148 | 54 |
| 2254 Shade Ave | 0.43mi | 3/1.0 | 1,032 (-10%) | 15mo | $150,000 | $145 | 46 |
| 125 Foy Ave | 0.71mi | 3/1.0 | 1,248 (+8%) | 8mo | $185,000 | $148 | 43 |
| 1838 Shade Ave | 0.59mi | 2/1.0 (-1) | 1,272 (+10%) | 7mo | $127,450 | $100 | 41 |
| 124 Foy Ave | 0.73mi | 2/1.0 (-1) | 1,288 (+12%) | 4mo | $115,000 | $89 | 34 |
| 222 Garfield Ave | 0.66mi | 2/1.0 (-1) | 980 (-15%) | 6mo | $105,000 | $107 | 30 |
Match score weights: distance 35% · size 25% · config 20% · recency 20%. Top-matched comps best support the ARV.
Projected returns pro-forma
-3.0% appreciation · 6.18% rent growth · sell at horizon
- IRR
- -9.5%
- Equity multiple
- 0.64×
- Total profit
- $-14,974
- Equity at exit
- $22,365
- IRR
- 3.5%
- Equity multiple
- 1.28×
- Total profit
- $11,846
- Equity at exit
- $12,969
Cash invested: $42,000 (down + closing). Projections, not guarantees.
Landlord ↔ Tenant lean methodology
- Overall (STATE)
- 90 Strongly Landlord-Friendly
- State Alabama
- 90 Strongly Landlord-Friendly · R+15
- County
- — inherits STATE
- City
- — inherits STATE
ZIP-level market 35630
- Home prices YoY
- -33.7%
- Rents YoY
- 6.2%
- Active inventory
- 268
- Price-to-rent
- 9.8×
Monthly cashflow live
- Estimated rent
- $1,274 high interval (Pro) →
- Mortgage (P&I)
- −$787
- Tax from tax record
- −$76 /mo · $909/yr
- Insurance
- −$62
- HOA
- −$0
- Vacancy / Maint / Mgmt
- −$267
- Net cashflow
- $81
Break-even live
Sensitivity live
| Price | -10% $166 | -5% $124 | +0% $81 | +5% $39 | +10% $-4 |
|---|---|---|---|---|---|
| Rent | -10% $-19 | -5% $31 | +0% $81 | +5% $132 | +10% $182 |
| Rate | -1.0pp $157 | -0.5pp $119 | base $81 | +0.5pp $42 | +1.0pp $3 |
UW: 25.0% down · 7.5% · 30yr · 1.5% tax · 5.0% vac · 8.0% maint · 8.0% mgmt
Financing live
Cash to close
- Down payment
- $37,500
- Closing costs
- $4,500
- Reserves months
- —
- Total cash needed
- —
Loan-product check · same deal, 3 products live
Conventional
25% down · 7.5% · 30yr
- Down + closing
- —
- Monthly P&I
- —
- Monthly cashflow
- —
- DSCR
- —
- Eligible?
- —
Personal DTI + credit; lowest rate.
DSCR
20% down · 8.5% · 30yr
- Down + closing
- —
- Monthly P&I
- —
- Monthly cashflow
- —
- DSCR
- —
- Eligible?
- —
No personal income docs; deal must DSCR.
Hard money
10% down · 12.0% · 12mo
- Down + closing
- —
- Monthly P&I
- —
- Monthly cashflow
- —
- DSCR
- —
- Eligible?
- —
Short-term bridge; refi at stabilization.
Rent comps 7 comps
| Address | Beds | Baths | Sqft | Rent | $/sqft | DOM | Units | Dist |
|---|---|---|---|---|---|---|---|---|
| 2424 Roberts Ln Florence, AL | 2.0 | 2.0 | 1100 | $1,095 | $1.00 | 44d | 1 | 0.43mi |
| 1413 N Pine St Florence, AL | 4.0 | 2.0 | 1444 | $1,695 | $1.17 | 44d | 1 | 0.83mi |
| 1034 N Royal Ave Unit 2 Florence, AL | 2.0 | 1.0 | 900 | $850 | $0.94 | 44d | 1 | 1.20mi |
| 1252 Hermitage Dr Florence, AL | 2.0 | 2.0 | 1250 | $1,170 | $0.94 | 44d | 1 | 1.26mi |
| 939 N Royal Ave Florence, AL | 2.0 | 1.0 | 900 | $850 | $0.94 | 44d | 1 | 1.38mi |
| 3410 Chisholm Rd Florence, AL | 2.0 | 1.0–2.0 | 1008 | $872 | $0.87 | 44d | 3 | 1.43mi |
| Cypress Dr Florence, AL | 2.0 | 1.0 | 782 | $695 | $0.89 | 44d | 1 | 1.45mi |
Listing history 7 events
-
2026-05-05$150,000 Active 239-char remark
-
2025-11-11$159,900 Active
-
2025-10-21historical
-
2025-09-09price $164,900
-
2025-08-14price $169,900
-
2025-07-24price $172,500
-
2025-06-21$174,900 Active
ⓘ Source: listings_history table (triggers on properties + properties_extension) + one-shot
backfill from property_details.listing_events for pre-trigger history.
Tax reassessment forecast AL · Resets to sale price
- Current annual tax
- $909 · $76/mo
- Projected year-2 tax
- $909 · $76/mo
- Expected delta
- $0/yr ($0/mo · 0.0%)
ⓘ Screening estimate from a state-policy table — verify with the county assessor before closing.
Climate risk First Street
- Flood 1/10 Low FEMA zone X (unshaded) · 0% chance over 30 yrs
- Wildfire 3/10 Moderate
- Heat 6/10 Major 7 d/yr ≥107°F today · 19 d/yr by 30 yrs out
- Wind 5/10 Major 23% chance of damaging wind over 30 yrs
- Air quality 2/10 Low 0 unhealthy d/yr today · 1 by 30 yrs out
Nearby sold comps map
Loading sold comps map…
Walkable amenities ~0.75 mi
Loading nearby amenities…
Taxation est. · year 1
- Rental income
- $15,284
- − Mortgage interest
- −$8,402
- − Property taxes
- −$909
- − Insurance
- −$750
- − Repairs & maintenance
- −$1,223
- − Management
- −$1,223
- − Depreciation
- −$4,364
- Taxable loss
- −$1,587
- Est. tax savings @ 24.0%
- +$381
- After-tax cash flow
- $1,356/yr
For passive investors: Depreciation is non-cash, so a rental often shows a tax loss while cash-flowing — sheltering income. Rental losses are passive: they offset passive income freely, and up to $25,000/yr can offset ordinary (W-2) income if you actively participate and your MAGI is under $100k (phasing out to $0 by $150k); unused losses carry forward. On sale, claimed depreciation is recaptured at up to 25%, and gains may owe capital-gains tax (a 1031 exchange can defer both). Figures are a year-1 estimate at your 24.0% rate — not tax advice; consult a CPA.
Schools (NCES district)
- District
- Florence City
- NCES district ID
- 0101530
- Math proficiency
- 28% ▼ -28.00%
- Reading proficiency
- 44% ▼ -4.00%
- Median HH income
- $34,997
- Composite
- 29.69/100
- National rank
- #6456
- State rank
- #44 of 129 in AL
Livability — Florence
- Score
- 82/100
- State rank
- #4
- US rank
- #1140
Category grades
Schools grade is shown separately in the Schools card above.
Census & demographics
- Census place
- Florence, AL
- County
- Lauderdale County · 47,988 people
- City population
- 34,028
- Metro
- Florence-Muscle Shoals, AL
- Population (ZIP)
- 34,028
- Household income
- $46,304
- Rent vs Own
- Severe rent burden
- 1516.0
Population outlook (Lauderdale County) Hauer SSP2
- Today (2025)
- 93,386 people
- By 2030
- 93,634 · +0.3%
- By 2040
- 93,114 · -0.3%
- By 2050
- 91,586 · -1.9%
- By 2075
- 88,667 · -5.1%
- By 2100
- 81,098 · -13.2%
Race, ethnicity, and origin ACS 2023
- Neighborhood character
- Predominantly White (70%)
- Race & ethnicity
- White 70% Black 18% Two or more races 6% Hispanic / Latino 6%
- Hispanic origin (detail)
- Mexican 5%
- Common ancestry
- Slovak 3% Serbian 2% Romanian 1%
- Foreign-born
- 4% · Canada, Vietnam, Guatemala
- Languages at home
- 92% English-only · Spanish 6% Vietnamese 1%
Political lean MEDSL · Lauderdale
- 2024 margin
- Solid R (+51.5) · D 23.8% · R 75.3%
- 2008→2024 swing
- -23.3pp toward R · 2008: -28.2pp · 2024: -51.5pp
- All cycles
- 2024: R+51.5 2020: R+44.7 2016: R+46.0 2012: R+30.9 2008: R+28.2
Not yet ingested
- Civics
- —
Market trends
- HPI YoY
- ▼ -104.78%
- Current HPI
- 206.1364
- Rent YoY
- ▲ 6.18%
- Metro
- Florence-Muscle Shoals, AL
- State GDP YoY
- ▲ 2.94%
- F500 in state
- 4
Industry mix (Fortune 500 HQ in AL)
| Industry | F500 HQs | Revenue |
|---|---|---|
| Financial Services | 1 | $8B |
|
||
| Healthcare | 1 | $5B |
|
||
Price history
-14.2% since first listed8 events — show timeline
- 2026-05-19 Pending — SAARMLS
- 2026-05-05 Listed $150,000 SAARMLS
- 2025-11-11 Listed $159,900 SAARMLS
- 2025-10-21 Delisted — SAARMLS
- 2025-09-09 Price Changed $164,900 SAARMLS
- 2025-08-14 Price Changed $169,900 SAARMLS
- 2025-07-24 Price Changed $172,500 SAARMLS
- 2025-06-21 Listed $174,900 SAARMLS
Property tax history
+5.6%/yrLatest (2025): $909 · +6.9% YoY. Source: county tax records.
Cash-flow waterfall
monthlySold comps — $/sqft
last 12 mo · ≤1 miLoading sold comps…