1021 Smith Andrews Dr · Elberton, GA
Flood risk 1/10 · Minimal
- FEMA flood zone
- X (unshaded)
- Chance of flooding over 30 yrs
- 0.0%
- Est. flood insurance / yr
- $507 – $1,088
Fire risk 4/10 · Minor
- Est. fire insurance / yr
- $963 – $1,789
Heat risk 5/10 · Moderate
- Hot days now (above 105°F)
- 7 days/yr
- Hot days in 30 yrs
- 17 days/yr
Wind risk 5/10 · Moderate
- Chance of severe wind over 30 yrs
- 25.0%
Air-quality risk 3/10 · Minor
- Unhealthy air days now
- 2 days/yr
- Unhealthy air days in 30 yrs
- 3 days/yr
Risk factors via First Street. Map © Google.
Why this score? — see what drove the B grade
The composite is a weighted blend of 9 inputs, each scored 0–100. Each bar is that input's sub-score; the figure is the points it added to the 100-point composite (weight × sub-score).
- Cash flow +25.0/30.0
- ARV discount +15.0/15.0
- Appreciation +10.0/10.0
- DSCR +8.2/10.0
- 1% rule +5.5/10.0
- Livability +3.0/5.0
- Rent growth +2.5/5.0
- Condition / age +2.5/5.0
- Schools +2.1/10.0
$135,000
🖨 Deal sheet 📄 Offer letter ✓ Due diligence
Listing remarks
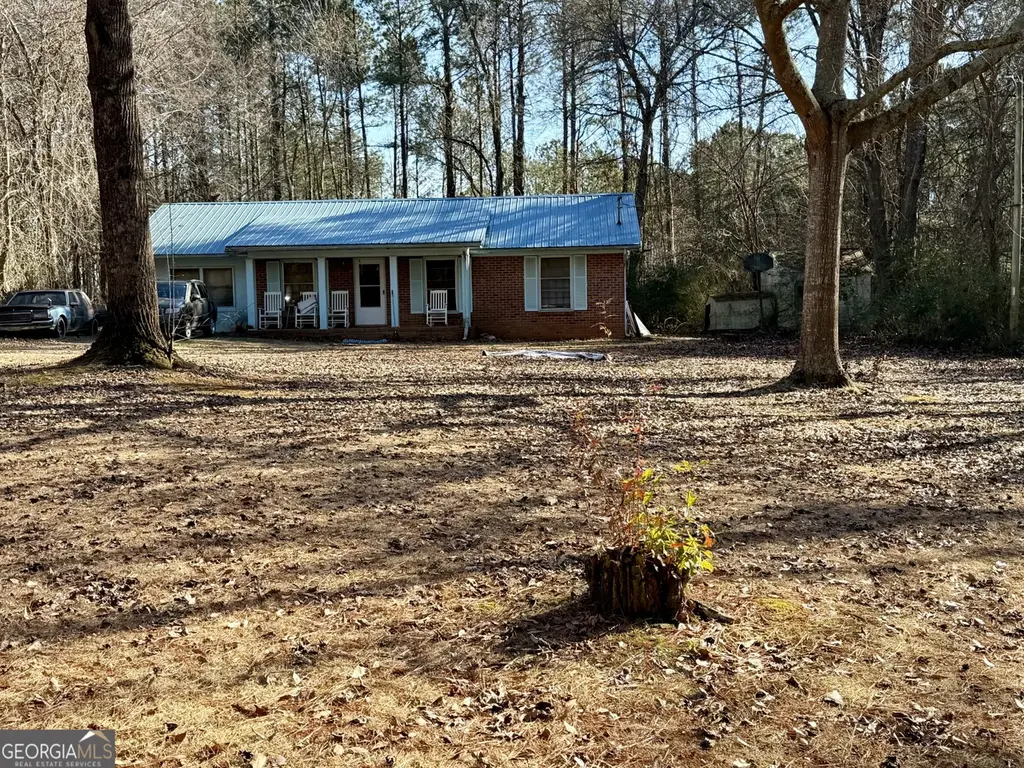
Looking for peace of mind? This four-sided brick beauty features a durable metal roof, offering years of low-maintenance living on a private . 52-acre lot. Located just outside Elberton, you're only a short drive from multiple Lake Russell boat ramps, making it easy to enjoy one of Georgia's most pristine lakes. With a cozy country feel and plenty of privacy, this home is the perfect retreat for those who value both stability and seclusion. Very affordable home and will not last long! Call today to view this property.
Key facts
- 0.5 acre lot
- Built 1986
- Listed 2 days
Property features AI
Finance
- Other: Home warranty included
- HOA & community: No HOA
Exterior
- Parking: Guest parking; Side/rear entrance parking; Kitchen-level access to parking
- Utilities: Well water; Septic sewer; Electricity available on property; Natural gas available; High-speed internet available; Cable available; Phone service available
- Home design: Single-family residence (house); One story; Resale property
- Construction: Built in 1986; Brick exterior; Metal roof
- Exterior features: Metal roof; Brick construction; Crawl space foundation; Lot approximately 0.5 acre; No notable lot features listed
Interior
- Kitchen: Refrigerator
- Bedrooms: 3 bedrooms on the main level
- Flooring: Carpet; Laminate
- Bathrooms: 1 full bathroom; 1 half bathroom (total 1.5)
- Heating & cooling: Central heating; Heat pump; Natural gas heating available; Central air conditioning; Heat pump cooling; Ceiling fans; Electric components
- Interior features: One-level living; Den; Common-area laundry; Electric water heater; Refrigerator
- Laundry & utility: Shared laundry in common area
Neighborhood map
What this means for you Summary
Snapshot
- This is a 3-bed/1.5-bath single-family listed at $135k.
Deal economics
- At list price, monthly cash flow is $296 ($4k/yr) — positive.
- The deal already cash-flows at list — no discount required.
- Meets the 1% rule at list price ($1k rent vs $135k).
- Cap rate 8.9% vs local median 3.6% in Elberton — top-decile yield for the area; either an underpriced asset or a hidden risk that comps aren't pricing in. Stress-test before assuming the spread holds.
Location & tenants
- Location reads 60/100 on livability (#375 in GA) — a middle-class / working-renter tenant base. Strengths: cost of living A+, health & safety A+, housing B; Watch: schools F, crime F, amenities F.
- Elbert County (rural): math 26% / reading 25% proficiency, ranked #124 of 174 in GA (top 71%) — low school quality limits family demand, transient renter base, plan for 1-2y turnover; 61% free/reduced lunch — lower-income household profile, screen leases tightly.
- Market conditions: 183 active listings in the ZIP; 77 units permitted in Elbert County in 2024 (0 in 5+ unit buildings).
Forward outlook
- In year one you build about $14k of equity ($933 loan paydown + $14k appreciation (10.0% local appreciation)).
- Elbert County population projected at -28% by 2050 — secular population decline; favor cash flow + early exit over multi-decade hold.
- At projected returns (10.0% appreciation + 3.0% rent growth), your $38k cash investment doubles in ~3 years — after that, you're playing with house money.
- By year 3, paydown + projected appreciation supports a ~$37k cash-out refi (75% LTV) — recoverable capital for the next deal without selling this one.
Negotiation context
- Only 2 days on market — expect competitive offers; lowballing is unlikely to land.
- 2 sale attempts; this cycle's ask has dropped $35k (21%) from the opening price — seller is motivated, your offer sets the floor, not the list.
Risks & watch-outs
- Climate carrying-cost: moderate wind risk, 25% chance of damaging wind over 30y; extreme-heat days projected 7→17/yr by 2055 (HVAC capex compounding) — expect insurance premiums to compound above CPI over the hold.
Questions for the listing agent
- Is there a deadline driving the sale (1031 exchange, divorce, estate, relocation)? That informs how much negotiation room exists.
- Schools are F-rated, which usually means shorter tenancies and higher turnover. Who's the typical renter profile here, and what's been the actual vacancy rate?
- Crime grade is F in this area — have there been break-ins, vandalism, or insurance claims at this property in the last 3 years? What carrier currently insures it and at what premium?
- What's the average days-on-market for RENTAL listings here right now (not sales)? A rising rental-DOM trend means longer vacancies and softer asking-rent achievability than the comps imply.
- What's the recent tenant-quality profile in this submarket — average credit score on applications, eviction rate, late-payment / NSF rate, and stable-employment percentage? A property-management company in the area should have these aggregated.
- How much new for-sale + rental construction is in the pipeline within 1–3 miles? Heavy new supply typically softens prices + rents 12–24 months out; constrained supply supports both.
Investment metrics
- 1% rule
- 1.05% ✓
- Cap rate
- 8.92%
- Cash-on-cash
- 9.40%
- DSCR
- 1.42
- GRM
- 7.9
CMA / ARV
- ARV (median comp)
- $221,639
- List price
- $135,000
- Delta
- -39.09%
- Verdict
- UNDERPRICED
- Comps
- 10 within 2.0 mi
Show comp detail 1 sale within ~0.75 mi
| Address | Dist | Beds/Ba | Sqft | Sold | Price | $/sf | Match |
|---|---|---|---|---|---|---|---|
| 1021 Smith Andrews Dr | 0.00mi | 3/1.5 | 1,463 (0%) | 0mo | $125,000 | $85 | 100 |
Match score weights: distance 35% · size 25% · config 20% · recency 20%. Top-matched comps best support the ARV.
Projected returns pro-forma
10.0% appreciation · 3.0% rent growth · sell at horizon
- IRR
- 31.1%
- Equity multiple
- 3.44×
- Total profit
- $92,337
- Equity at exit
- $121,619
- IRR
- 26.9%
- Equity multiple
- 7.80×
- Total profit
- $257,003
- Equity at exit
- $262,275
Cash invested: $37,800 (down + closing). Projections, not guarantees.
Landlord ↔ Tenant lean methodology
- Overall (STATE)
- 90 Strongly Landlord-Friendly
- State Georgia
- 90 Strongly Landlord-Friendly · R+3
- County
- — inherits STATE
- City
- — inherits STATE
ZIP-level market 30635
- Home prices YoY
- 4.1%
- Active inventory
- 183
- Price-to-rent
- 7.9×
Monthly cashflow live
- Estimated rent
- $1,423 medium interval (Pro) →
- Mortgage (P&I)
- −$708
- Tax from tax record
- −$64 /mo · $762/yr
- Insurance
- −$56
- HOA
- −$0
- Vacancy / Maint / Mgmt
- −$299
- Net cashflow
- $296
Break-even live
UW: 25.0% down · 7.5% · 30yr · 1.5% tax · 5.0% vac · 8.0% maint · 8.0% mgmt
Financing live
Cash to close
- Down payment
- $33,750
- Closing costs
- $4,050
- Reserves months
- —
- Total cash needed
- —
Loan-product check · same deal, 3 products live
Conventional
25% down · 7.5% · 30yr
- Down + closing
- —
- Monthly P&I
- —
- Monthly cashflow
- —
- DSCR
- —
- Eligible?
- —
Personal DTI + credit; lowest rate.
DSCR
20% down · 8.5% · 30yr
- Down + closing
- —
- Monthly P&I
- —
- Monthly cashflow
- —
- DSCR
- —
- Eligible?
- —
No personal income docs; deal must DSCR.
Hard money
10% down · 12.0% · 12mo
- Down + closing
- —
- Monthly P&I
- —
- Monthly cashflow
- —
- DSCR
- —
- Eligible?
- —
Short-term bridge; refi at stabilization.
Listing history 5 events
-
2026-05-08status Under Contract 522-char remark
-
2026-02-27historical
-
2026-02-16price $130,000
-
2026-02-06$135,000 New 522-char remark
-
2026-02-06$170,000 New
ⓘ Source: listings_history table (triggers on properties + properties_extension) + one-shot
backfill from property_details.listing_events for pre-trigger history.
Tax reassessment forecast GA · Resets to sale price
- Current annual tax
- $762 · $64/mo
- Projected year-2 tax
- $1,242 · $104/mo
- Expected delta
- +$480/yr (+$40/mo · 62.9%)
ⓘ Screening estimate from a state-policy table — verify with the county assessor before closing.
Climate risk First Street
- Flood 1/10 Low FEMA zone X (unshaded) · 0% chance over 30 yrs
- Wildfire 4/10 Moderate
- Heat 5/10 Major 7 d/yr ≥105°F today · 17 d/yr by 30 yrs out
- Wind 5/10 Major 25% chance of damaging wind over 30 yrs
- Air quality 3/10 Moderate 2 unhealthy d/yr today · 3 by 30 yrs out
Nearby sold comps map
Loading sold comps map…
Walkable amenities ~0.75 mi
Loading nearby amenities…
Taxation est. · year 1
- Rental income
- $17,070
- − Mortgage interest
- −$7,562
- − Property taxes
- −$762
- − Insurance
- −$675
- − Repairs & maintenance
- −$1,366
- − Management
- −$1,366
- − Depreciation
- −$3,927
- Taxable income
- $1,412
- Est. tax owed @ 24.0%
- −$339
- After-tax cash flow
- $3,214/yr
For passive investors: Depreciation is non-cash, so a rental often shows a tax loss while cash-flowing — sheltering income. Rental losses are passive: they offset passive income freely, and up to $25,000/yr can offset ordinary (W-2) income if you actively participate and your MAGI is under $100k (phasing out to $0 by $150k); unused losses carry forward. On sale, claimed depreciation is recaptured at up to 25%, and gains may owe capital-gains tax (a 1031 exchange can defer both). Figures are a year-1 estimate at your 24.0% rate — not tax advice; consult a CPA.
Schools (NCES district)
- District
- Elbert County
- NCES district ID
- 1302010
- Math proficiency
- 26% ▼ -3.00%
- Reading proficiency
- 25% ▼ -3.00%
- Median HH income
- $34,498
- Composite
- 21.0/100
- National rank
- #8458
- State rank
- #124 of 174 in GA
Livability — Elberton
- Score
- 60/100
- State rank
- #375
- US rank
- #19001
Category grades
Schools grade is shown separately in the Schools card above.
Census & demographics
- Population (ZIP)
- 15,107
Population outlook (Elbert County) Hauer SSP2
- Today (2025)
- 17,648 people
- By 2030
- 16,675 · -5.5%
- By 2040
- 14,631 · -17.1%
- By 2050
- 12,632 · -28.4%
- By 2075
- 8,704 · -50.7%
- By 2100
- 5,958 · -66.2%
Race, ethnicity, and origin ACS 2023
- Neighborhood character
- Diverse neighborhood (Simpson 0.57)
- Race & ethnicity
- White 58% Black 29% Two or more races 7% Hispanic / Latino 6% Asian 1%
- Hispanic origin (detail)
- Mexican 4% Cuban 1%
- Common ancestry
- Lithuanian 2% Slovak 1% Romanian 1%
- Foreign-born
- 5% · Canada, Dominican Republic, China
- Languages at home
- 94% English-only · Spanish 5%
Political lean MEDSL · Elbert
- 2024 margin
- Solid R (+43.4) · D 28.2% · R 71.5%
- 2008→2024 swing
- -25.3pp toward R · 2008: -18.1pp · 2024: -43.4pp
- All cycles
- 2024: R+43.4 2020: R+36.5 2016: R+34.9 2012: R+20.6 2008: R+18.1
Not yet ingested
- Civics
- —
Market trends
- HPI YoY
- ▲ 13.03%
- Current HPI
- 332.46
- Rent YoY
- —
- Metro
- —
- State GDP YoY
- ▲ 2.66%
- F500 in state
- 28
Industry mix (Fortune 500 HQ in GA)
| Industry | F500 HQs | Revenue |
|---|---|---|
| Paper / Packaging | 2 | $29B |
|
||
| Retail | 1 | $160B |
|
||
| Transportation / Logistics | 1 | $91B |
|
||
| Airlines | 1 | $62B |
|
||
| Consumer Goods | 1 | $47B |
|
||
| Utilities | 1 | $25B |
|
||
Price history
-7.4% since first listed6 events — show timeline
- 2026-06-16 Sold (MLS) $125,000 GAMLS
- 2026-05-08 Pending — GAMLS
- 2026-02-27 Listing Removed — GAMLS
- 2026-02-16 Price Changed $130,000 GAMLS
- 2026-02-06 Listed $170,000 GAMLS
- 2026-02-06 Listed $135,000 GAMLS
Property tax history
-0.6%/yrLatest (2025): $762 · -40.0% YoY. Source: county tax records.
Cash-flow waterfall
monthlySold comps — $/sqft
last 12 mo · ≤1 miLoading sold comps…