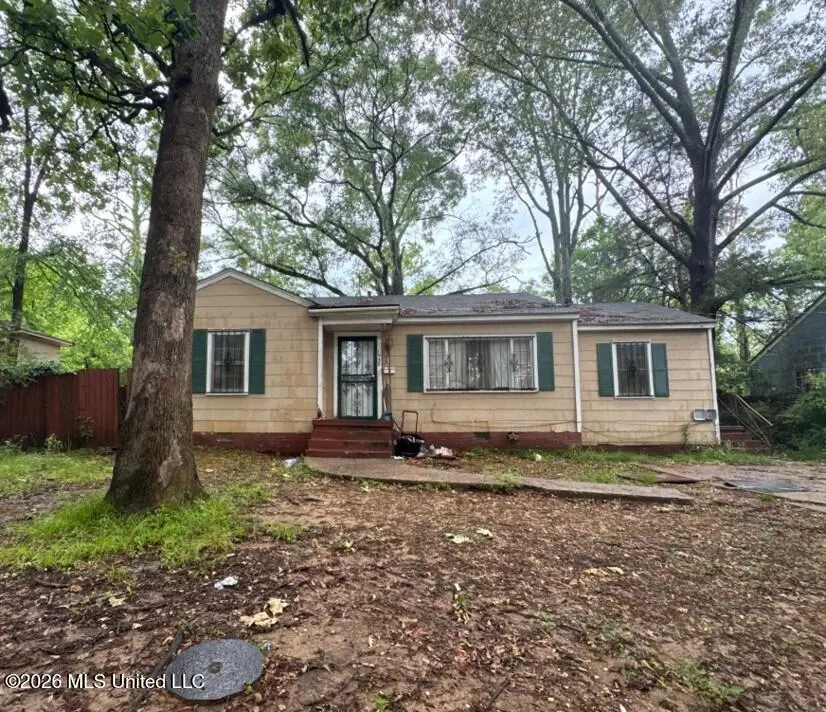
1939 Belvedere Dr · Jackson, MS
Flood risk 1/10 · Minimal
- FEMA flood zone
- X (unshaded)
- Chance of flooding over 30 yrs
- 0.0%
- Est. flood insurance / yr
- $507 – $1,088
Fire risk 1/10 · Minimal
- Est. fire insurance / yr
- $1,241 – $2,305
Heat risk 7/10 · Major
- Hot days now (above 108°F)
- 6 days/yr
- Hot days in 30 yrs
- 17 days/yr
Wind risk 8/10 · Major
- Chance of severe wind over 30 yrs
- 80.0%
Air-quality risk 1/10 · Minimal
- Unhealthy air days now
- 0 days/yr
- Unhealthy air days in 30 yrs
- 0 days/yr
Risk factors via First Street. Map © Google.
Why this score? — see what drove the C- grade
The composite is a weighted blend of 9 inputs, each scored 0–100. Each bar is that input's sub-score; the figure is the points it added to the 100-point composite (weight × sub-score).
- Cash flow +15.0/30.0
- Appreciation +10.0/10.0
- ARV discount +7.5/15.0
- 1% rule +5.0/10.0
- DSCR +5.0/10.0
- Rent growth +5.0/5.0
- Livability +3.4/5.0
- Condition / age +2.5/5.0
- Schools +1.1/10.0
$14,900
🖨 Deal sheet (PDF) 📄 Offer letter ✓ Due diligence
Listing remarks
Located in a residential neighborhood, this 3-bedroom, 2-bath home offers approximately 1,117 sq. ft. on a 0.27-acre lot. Built in 1949, the property has great potential for an owner-occupant or investor looking to update and personalize. Conveniently located near schools, shopping, and dining in the heart of Jackson. Property cannot be shown at this time.
Key facts
- 0.27 acre lot
- Built 1949
- Listed 28 days
Property features AI
Finance
- Other: Lot about 0.27 acres
Exterior
- Utilities: Public water; Public sewer; Electricity available; Water available; Sewer available
- Home design: Single family residence; One story
- Construction: Asbestos construction materials; Conventional foundation; Built (year source: public records)
- Exterior features: Asphalt shingle roof
Interior
- Bathrooms: 2 full bathrooms
- Heating & cooling: Forced air heating; Ceiling fan cooling
- Interior features: Ceiling fans
Neighborhood map
What this means for you Summary
Snapshot
- This is a 3-bed/2.0-bath single-family listed at $15k.
Deal economics
- At list price, monthly cash flow is $864 ($10k/yr) — positive.
- The deal already cash-flows at list — no discount required.
- Meets the 1% rule at list price ($1k rent vs $15k).
- Recommended offer: $15k (1.5% below list) — sets the bar for market timing.
- Cap rate 75.9% vs local median 9.9% in Jackson — top-decile yield for the area; either an underpriced asset or a hidden risk that comps aren't pricing in. Stress-test before assuming the spread holds.
Location & tenants
- Location reads 68/100 on livability (#66 in MS) — a middle-class / working-renter tenant base. Strengths: commute A+, cost of living A+, housing A+; Watch: amenities F, employment F, health & safety F.
- Jackson Public School District (urban): math 9% / reading 18% proficiency, ranked #112 of 130 in MS (top 86%) — low school quality limits family demand, transient renter base, plan for 1-2y turnover; 88% free/reduced lunch — lower-income household profile, screen leases tightly.
- Zoned schools: Lester Elementary School (math 8% / reading 42%, grade F, #220 of 375 statewide, top 59%, 187 students, 100% FRL); Peeples Middle School (math 11% / reading 15%, grade F, #141 of 179 statewide, top 79%, 298 students, 100% FRL); Jim Hill High School (math 4% / reading 15%, grade F, #179 of 197 statewide, top 92%, 908 students, 100% FRL).
- Market conditions: Rents rising fast (+13.6%/yr); 121 active listings in the ZIP; 15 comparable units currently listed for rent nearby; rentals at typical pace (median 25d on market — plan ~3-4 weeks tenant-placement turnaround); 40% of comp listings sitting > 30 days — soft ceiling on asking rent; lower-income renter base — watch delinquency; 167 units permitted in Hinds County in 2024 (0 in 5+ unit buildings).
- At $1,224/mo this rent would consume 49% of the median local household income ($30k/yr) (locally 1099% of renters already pay >50% of income on rent) — very limited rent-growth headroom before tenants either downsize or default.
Forward outlook
- In year one you build about $2k of equity ($103 loan paydown + $1k appreciation (10.0% local appreciation)).
- Hinds County population projected to shrink 6% by 2050 — rents likely to lag national; underwrite the cash flow, not the appreciation.
- At projected returns (10.0% appreciation + 8.0% rent growth), your $4k cash investment doubles in ~1 year — after that, you're playing with house money.
Negotiation context
- It's been on market 28 days — a 2% lower offer ($15k) is reasonable based on typical stale-listing flexibility.
- 3 sale attempts since 17y ago with the ask held roughly flat each time — persistent listings suggest the price (not the market) is what's stuck; bring a comps-based counter.
Risks & watch-outs
- Watch-outs: built in 1949 — expect roof / HVAC / electrical / plumbing capex.
- Climate carrying-cost: severe wind risk, 80% chance of damaging wind over 30y; extreme-heat days projected 6→17/yr by 2055 (HVAC capex compounding) — expect insurance premiums to compound above CPI over the hold.
Questions for the listing agent
- Built in 1949 — when were the roof, HVAC, electrical panel, plumbing, and water heater last replaced?
- Is there a deadline driving the sale (1031 exchange, divorce, estate, relocation)? That informs how much negotiation room exists.
- Schools are F-rated, which usually means shorter tenancies and higher turnover. Who's the typical renter profile here, and what's been the actual vacancy rate?
- What's the average days-on-market for RENTAL listings here right now (not sales)? A rising rental-DOM trend means longer vacancies and softer asking-rent achievability than the comps imply.
- What's the recent tenant-quality profile in this submarket — average credit score on applications, eviction rate, late-payment / NSF rate, and stable-employment percentage? A property-management company in the area should have these aggregated.
- How much new for-sale + rental construction is in the pipeline within 1–3 miles? Heavy new supply typically softens prices + rents 12–24 months out; constrained supply supports both.
Investment metrics
- 1% rule
- 8.21% ✓
- Cap rate
- 75.86%
- Cash-on-cash
- 248.47%
- DSCR
- 12.06
- GRM
- 1.0
CMA / ARV
- ARV (on-the-fly)
- $41,329
- Comps found
- 12
Show comp detail 12 sales within ~0.75 mi
| Address | Dist | Beds/Ba | Sqft | Sold | Price | $/sf | Match |
|---|---|---|---|---|---|---|---|
| 2023 Paden St | 0.10mi | 3/1.0 | 1,111 (-0%) | 6mo | $31,999 | $29 | 85 |
| 1906 Shamrock Dr | 0.08mi | 3/1.5 | 1,156 (+4%) | 5mo | $59,000 | $51 | 84 |
| 1904 Willaneel Dr | 0.12mi | 2/1.0 (-1) | 1,091 (-2%) | 6mo | $15,000 | $14 | 76 |
| 545 Merigold Dr | 0.24mi | 3/2.0 | 1,220 (+9%) | 4mo | $79,000 | $65 | 70 |
| 2112 Paden St | 0.16mi | 3/1.0 | 1,259 (+13%) | 1mo | $35,000 | $28 | 67 |
| 1725 Camellia Ln | 0.56mi | 3/1.5 | 1,134 (+2%) | 3mo | $40,000 | $35 | 67 |
| 715 Dorgan St | 0.58mi | 3/1.0 | 1,122 (+0%) | 6mo | $77,500 | $69 | 63 |
| 2416 Paden St | 0.54mi | 4/2.0 (+1) | 1,178 (+6%) | 0mo | $84,900 | $72 | 60 |
| 2364 Coronet Pl | 0.51mi | 3/1.0 | 1,190 (+6%) | 6mo | $74,500 | $63 | 57 |
| 2647 Glenn St | 0.67mi | 3/1.0 | 1,050 (-6%) | 2mo | $14,500 | $14 | 53 |
| 936 Winn St | 0.62mi | 3/2.5 | 1,196 (+7%) | 6mo | $44,500 | $37 | 52 |
| 2524 Coronet Pl | 0.74mi | 3/1.0 | 1,190 (+6%) | 3mo | $30,000 | $25 | 48 |
Match score weights: distance 35% · size 25% · config 20% · recency 20%. Top-matched comps best support the ARV.
Projected returns pro-forma
10.0% appreciation · 8.0% rent growth · sell at horizon
- IRR
- —
- Equity multiple
- 17.69×
- Total profit
- $69,619
- Equity at exit
- $13,423
- IRR
- —
- Equity multiple
- 43.62×
- Total profit
- $177,811
- Equity at exit
- $28,947
Cash invested: $4,172 (down + closing). Projections, not guarantees.
Landlord ↔ Tenant lean methodology
- Overall (STATE)
- 90 Strongly Landlord-Friendly
- State Mississippi
- 90 Strongly Landlord-Friendly · R+11
- County
- — inherits STATE
- City
- — inherits STATE
ZIP-level market 39204
- Home prices YoY
- 8.0%
- Rents YoY
- 13.6%
- Active inventory
- 121
- Price-to-rent
- 1.0×
Monthly cashflow live
- Estimated rent
- $1,224 high interval (Pro) →
- Mortgage (P&I)
- −$78
- Tax est. 1.5%
- −$19 /mo · $224/yr
- Insurance
- −$6
- HOA
- −$0
- Vacancy / Maint / Mgmt
- −$257
- Net cashflow
- $864
Break-even live
Sensitivity live
| Price | -10% $874 | -5% $869 | +0% $864 | +5% $859 | +10% $854 |
|---|---|---|---|---|---|
| Rent | -10% $767 | -5% $815 | +0% $864 | +5% $912 | +10% $961 |
| Rate | -1.0pp $871 | -0.5pp $868 | base $864 | +0.5pp $860 | +1.0pp $856 |
UW: 25.0% down · 7.5% · 30yr · 1.5% tax · 5.0% vac · 8.0% maint · 8.0% mgmt
Financing live
Cash to close
- Down payment
- $3,725
- Closing costs
- $447
- Reserves months
- —
- Total cash needed
- —
Loan-product check · same deal, 3 products live
Conventional
25% down · 7.5% · 30yr
- Down + closing
- —
- Monthly P&I
- —
- Monthly cashflow
- —
- DSCR
- —
- Eligible?
- —
Personal DTI + credit; lowest rate.
DSCR
20% down · 8.5% · 30yr
- Down + closing
- —
- Monthly P&I
- —
- Monthly cashflow
- —
- DSCR
- —
- Eligible?
- —
No personal income docs; deal must DSCR.
Hard money
10% down · 12.0% · 12mo
- Down + closing
- —
- Monthly P&I
- —
- Monthly cashflow
- —
- DSCR
- —
- Eligible?
- —
Short-term bridge; refi at stabilization.
Rent comps 15 comps
| Address | Beds | Baths | Sqft | Rent | $/sqft | DOM | Units | Dist |
|---|---|---|---|---|---|---|---|---|
| 2401 Coronet Pl Jackson, MS | 3.0 | 1.0 | 1200 | $1,400 | $1.17 | 25d | 1 | 0.49mi |
| 1645 Camellia Ln Jackson, MS | 3.0 | 2.0 | 1268 | $1,200 | $0.95 | 15d | 1 | 0.66mi |
| 843 Reaves St Jackson, MS | 3.0 | 2.0 | 1408 | $1,084 | $0.77 | 45d | 1 | 0.77mi |
| 2242 Castle Hill Dr Jackson, MS | 4.0 | 2.0 | 1500 | $1,475 | $0.98 | 25d | 1 | 0.81mi |
| 2242 Castle Hill Dr Jackson, MS | 4.0 | 2.0 | 1500 | $1,475 | $0.98 | 15d | 1 | 0.81mi |
| 225 W McDowell Rd Jackson, MS | 1.0–3.0 | 1.0–2.0 | 900 | $1,200 | $1.33 | 45d | 18 | 0.92mi |
| 2858 Fairhill Dr Jackson, MS | 2.0 | 1.0 | 900 | $825 | $0.92 | 45d | 1 | 1.00mi |
| 1126 Barbara Ann Dr Jackson, MS | 3.0 | 1.0 | 1343 | $1,000 | $0.74 | 15d | 1 | 1.13mi |
| 1126 Barbara Ann Dr Jackson, MS | 3.0 | 1.0 | 1343 | $1,000 | $0.74 | 45d | 1 | 1.13mi |
| 2786 Brookwood Dr Jackson, MS | 3.0 | 1.0 | 1003 | $1,100 | $1.10 | 45d | 1 | 1.20mi |
| 1513 Maria Dr Jackson, MS | 3.0 | 2.0 | 1120 | $1,200 | $1.07 | 15d | 1 | 1.24mi |
| 1513 Maria Dr Jackson, MS | 3.0 | 2.0 | 1120 | $1,200 | $1.07 | 25d | 1 | 1.24mi |
| 201 W Santa Clair St Jackson, MS | 2.0 | 1.0 | 1182 | $950 | $0.80 | 25d | 1 | 1.37mi |
| 201 W Santa Clair St Jackson, MS | 2.0 | 1.0 | 1182 | $950 | $0.80 | 15d | 1 | 1.37mi |
| 2873 Teresa Dr Jackson, MS | 3.0 | 1.0 | 1100 | $1,100 | $1.00 | 45d | 1 | 1.45mi |
Listing history 23 events
-
2026-06-18days on market $14,900 Active 28 DOM
-
2026-06-17days on market $14,900 Active 27 DOM
-
2026-06-16days on market $14,900 Active 26 DOM
-
2026-06-15days on market $14,900 Active 25 DOM
-
2026-06-14days on market $14,900 Active 23 DOM
-
2026-06-13days on market $14,900 Active 22 DOM
-
2026-06-10days on market $14,900 Active 20 DOM
-
2026-06-09days on market $14,900 Active 19 DOM
-
2026-06-08days on market $14,900 Active 18 DOM
-
2026-06-07days on market $14,900 Active 17 DOM
-
2026-06-05days on market $14,900 Active 14 DOM
-
2026-06-03days on market $14,900 Active 13 DOM
-
2026-06-02days on market $14,900 Active 12 DOM
-
2026-06-01days on market $14,900 Active 11 DOM
-
2026-05-31days on market $14,900 Active 10 DOM
-
2026-05-30days on market $14,900 Active 9 DOM
-
2026-05-21$14,900 Active
-
2026-04-24historical
-
2026-01-26$32,200 Active
-
2009-10-27historical
-
2009-03-09$69,000
-
1991-12-31soldstatus
-
1950-04-25soldstatus
ⓘ Source: listings_history table (triggers on properties + properties_extension) + one-shot
backfill from property_details.listing_events for pre-trigger history.
Climate risk First Street
- Flood 1/10 Low FEMA zone X (unshaded) · 0% chance over 30 yrs
- Wildfire 1/10 Low
- Heat 7/10 Severe 6 d/yr ≥108°F today · 17 d/yr by 30 yrs out
- Wind 8/10 Severe 80% chance of damaging wind over 30 yrs
- Air quality 1/10 Low 0 unhealthy d/yr today · 0 by 30 yrs out
Nearby sold comps map
Loading sold comps map…
Walkable amenities ~0.75 mi
Loading nearby amenities…
Taxation est. · year 1
- Rental income
- $14,686
- − Mortgage interest
- −$835
- − Property taxes
- −$224
- − Insurance
- −$74
- − Repairs & maintenance
- −$1,175
- − Management
- −$1,175
- − Depreciation
- −$433
- Taxable income
- $10,770
- Est. tax owed @ 24.0%
- −$2,585
- After-tax cash flow
- $7,781/yr
For passive investors: Depreciation is non-cash, so a rental often shows a tax loss while cash-flowing — sheltering income. Rental losses are passive: they offset passive income freely, and up to $25,000/yr can offset ordinary (W-2) income if you actively participate and your MAGI is under $100k (phasing out to $0 by $150k); unused losses carry forward. On sale, claimed depreciation is recaptured at up to 25%, and gains may owe capital-gains tax (a 1031 exchange can defer both). Figures are a year-1 estimate at your 24.0% rate — not tax advice; consult a CPA.
Schools (NCES district)
- District
- Jackson Public School District
- NCES district ID
- 2802190
- Math proficiency
- 9% ▼ -14.00%
- Reading proficiency
- 18% ▼ -7.00%
- Median HH income
- $33,234
- Composite
- 10.89/100
- National rank
- #9755
- State rank
- #112 of 130 in MS
Livability — Jackson
- Score
- 68/100
- State rank
- #66
- US rank
- #9695
Category grades
Schools grade is shown separately in the Schools card above.
Census & demographics
- Census place
- Jackson, MS
- County
- Hinds County · 167,040 people
- City population
- 140,204
- Metro
- Jackson, MS
- Population (ZIP)
- 13,249
- Household income
- $30,237
- Rent vs Own
- Severe rent burden
- 1099.0
Population outlook (Hinds County) Hauer SSP2
- Today (2025)
- 242,528 people
- By 2030
- 241,113 · -0.6%
- By 2040
- 235,557 · -2.9%
- By 2050
- 226,946 · -6.4%
- By 2075
- 199,995 · -17.5%
- By 2100
- 164,165 · -32.3%
Race, ethnicity, and origin ACS 2023
- Neighborhood character
- Predominantly Black (90%)
- Race & ethnicity
- Black 90% White 5% Two or more races 4% Hispanic / Latino 3%
- Foreign-born
- 2% · Canada
- Languages at home
- 97% English-only · Spanish 2%
Political lean MEDSL · Hinds
- 2024 margin
- Solid D (+46.1) · D 72.4% · R 26.3% · Other 1.4%
- 2008→2024 swing
- +7.1pp toward D · 2008: 39.0pp · 2024: 46.1pp
- All cycles
- 2024: D+46.1 2020: D+48.3 2016: D+43.7 2012: D+45.1 2008: D+39.0
Not yet ingested
- Civics
- —
Market trends
- HPI YoY
- ▲ 17.25%
- Current HPI
- 233.9061
- Rent YoY
- ▲ 13.56%
- Metro
- Jackson, MS
- State GDP YoY
- —
- F500 in state
- 0
Price history
-78.4% since first listed7 events — show timeline
- 2026-05-21 Listed $14,900 MLSU
- 2026-04-24 Listing Removed — MLSU
- 2026-01-26 Listed $32,200 MLSU
- 2009-10-27 Listing Removed — MLSU
- 2009-03-09 Listed $69,000 MLSU
- 1991-12-31 Sold (Public Records) — Public Records
- 1950-04-25 Sold (Public Records) — Public Records
Property tax history
+0.8%/yrLatest (2025): $981 · +1.3% YoY. Source: county tax records.
Cash-flow waterfall
monthlySold comps — $/sqft
last 12 mo · ≤1 miLoading sold comps…