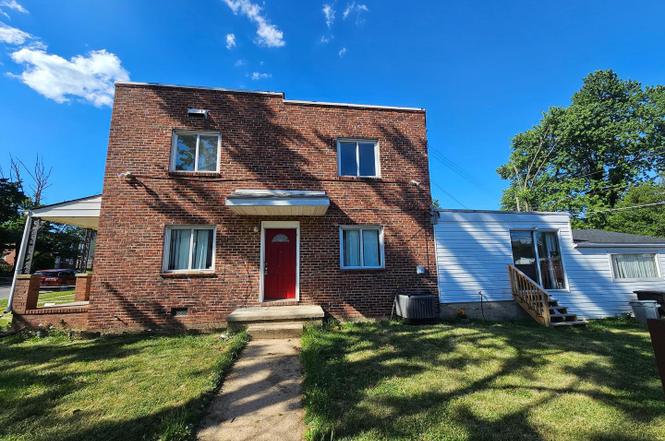
8501 Chestnut Oak · Parkville, MD
Flood risk 8/10 · Major
- FEMA flood zone
- X (unshaded)
- Chance of flooding over 30 yrs
- 0.99%
- Est. flood insurance / yr
- $507 – $1,088
Fire risk 1/10 · Minimal
- Est. fire insurance / yr
- $755 – $1,403
Heat risk 7/10 · Major
- Hot days now (above 103°F)
- 7 days/yr
- Hot days in 30 yrs
- 15 days/yr
Wind risk 6/10 · Moderate
- Chance of severe wind over 30 yrs
- 27.0%
Air-quality risk 4/10 · Minor
- Unhealthy air days now
- 3 days/yr
- Unhealthy air days in 30 yrs
- 6 days/yr
Risk factors via First Street. Map © Google.
Why this score? — see what drove the C- grade
The composite is a weighted blend of 9 inputs, each scored 0–100. Each bar is that input's sub-score; the figure is the points it added to the 100-point composite (weight × sub-score).
- Cash flow +15.1/30.0
- ARV discount +14.8/15.0
- DSCR +4.6/10.0
- Rent growth +4.2/5.0
- 1% rule +3.9/10.0
- Livability +3.9/5.0
- Condition / age +2.5/5.0
- Schools +2.3/10.0
- Appreciation +0.0/10.0
$279,000
🖨 Deal sheet (PDF) 📄 Offer letter ✓ Due diligence
Listing remarks MLS
Come see this EOG brick townhouse w/ 3 beds & 2 full baths. Huge family room addition, front patio, separate first floor laundry and storage area. Central vac included, plus parking pad, space for a garden and a wood privacy fence.
Key facts
- New bathrooms
- New floor
- New roof
Tags
Property features AI
Finance
- Financial info: Land assessed value listed; Tax information available
Exterior
- Parking: On-street parking
- Utilities: Public water; Public sewer
- Home design: End of row townhouse; Fee simple ownership; Finished above-grade area approximately 1,700 (estimated)
- Construction: Brick construction; Permanent foundation; Other structures above and below grade; Year built source: assessor
- Exterior features: Tidal water: none; Total below-grade finished area approximately 162
Interior
- Bedrooms: Three bedrooms on the first upper level; One bedroom on the main level
- Bathrooms: Two full bathrooms total (one on main level, one on first upper level)
- Heating & cooling: 90% forced air heating; Electric cooling (other type)
- Interior features: Estimated living area; No basement
Neighborhood map
What this means for you Summary
Snapshot
- This is a 4-bed/2.0-bath townhouse listed at $279k.
Deal economics
- At list price, monthly cash flow is $27 ($319/yr) — positive.
- The deal already cash-flows at list — no discount required.
- To meet the 1% rule (rent ≥ 1% of price), the offer needs to be $249k (10.6% below list).
- Recommended offer: $249k (10.6% below list) — sets the bar for 1% rule.
- Cap rate 6.7% vs local median 5.3% in Parkville — meaningfully above typical; check what's discounted (condition, days-on-market, listing class) to confirm the premium yield is real.
Location & tenants
- Location reads 77/100 on livability (#77 in MD, #2,839 nationally) — a middle-class / working-renter tenant base. Strengths: commute A+, housing A+, health & safety A+; Watch: crime F.
- Baltimore County Public Schools (suburban): math 15% / reading 34% proficiency, ranked #11 of 24 in MD (top 46%) — low school quality limits family demand, transient renter base, plan for 1-2y turnover.
- Zoned schools: Oakleigh Elementary (math 9% / reading 12%, grade F, #590 of 860 statewide, top 70%, 502 students, 67% FRL); Pine Grove Middle (math 11% / reading 42%, grade F, #86 of 225 statewide, top 40%, 916 students, 56% FRL); Loch Raven High (math 17% / reading 57%, grade F, #141 of 222 statewide, top 63%, 891 students, 56% FRL) — zoned schools average 60% FRL vs 39% district-wide (21 pts higher); higher-poverty schools than district average — tighter screening recommended.
- Market conditions: Rents rising fast (+6.7%/yr); 234 active listings in the ZIP; 32 comparable units currently listed for rent nearby; rentals at typical pace (median 20d on market — plan ~3-4 weeks tenant-placement turnaround); solid renter incomes; 1,511 units permitted in Baltimore County in 2024 (643 in 5+ unit buildings).
- This rent runs 36% of the median local income ($84k/yr) — at the standard rent-burdened threshold; future hikes will face affordability resistance.
Forward outlook
- Local home prices are declining (-3.0%/yr); year-one equity from $2k of loan paydown is wiped out by about $8k of value loss. Plan a longer hold.
- Baltimore County population projected at +12% by 2050 — modest demand growth; plan on rents tracking national, not racing it.
Negotiation context
- Only 1 days on market — expect competitive offers; lowballing is unlikely to land.
- 4 sale attempts since 22y ago; this cycle's ask is 55% above the opening price — seller raised mid-cycle; expect resistance to lowballs.
- Current owner paid $140k; list at $279k implies a 99% gain — meaningful room to come down on a strong offer.
Risks & watch-outs
- Watch-outs: flood insurance adds $66/mo; built in 1949 — expect roof / HVAC / electrical / plumbing capex.
- Climate carrying-cost: severe flood risk; major wind risk, 27% chance of damaging wind over 30y; extreme-heat days projected 7→15/yr by 2055 (HVAC capex compounding) — expect insurance premiums to compound above CPI over the hold.
Questions for the listing agent
- Built in 1949 — when were the roof, HVAC, electrical panel, plumbing, and water heater last replaced?
- What's the actual annual flood-insurance premium (NFIP or private), and is the property in a SFHA with mandatory coverage?
- Is there a deadline driving the sale (1031 exchange, divorce, estate, relocation)? That informs how much negotiation room exists.
- Schools are F-rated, which usually means shorter tenancies and higher turnover. Who's the typical renter profile here, and what's been the actual vacancy rate?
- Crime grade is F in this area — have there been break-ins, vandalism, or insurance claims at this property in the last 3 years? What carrier currently insures it and at what premium?
- What's the average days-on-market for RENTAL listings here right now (not sales)? A rising rental-DOM trend means longer vacancies and softer asking-rent achievability than the comps imply.
- What's the recent tenant-quality profile in this submarket — average credit score on applications, eviction rate, late-payment / NSF rate, and stable-employment percentage? A property-management company in the area should have these aggregated.
- How much new for-sale + rental construction is in the pipeline within 1–3 miles? Heavy new supply typically softens prices + rents 12–24 months out; constrained supply supports both.
Investment metrics
- 1% rule
- 0.89% ✗
- Cap rate
- 6.69%
- Cash-on-cash
- 1.43%
- DSCR
- 1.06
- GRM
- 9.3
CMA / ARV
- ARV (on-the-fly)
- $333,298
- Comps found
- 12
Show comp detail 12 sales within ~0.75 mi
| Address | Dist | Beds/Ba | Sqft | Sold | Price | $/sf | Match |
|---|---|---|---|---|---|---|---|
| 1738 Redwood | 0.17mi | 3/2.0 (-1) | 1,632 (-12%) | 1mo | $255,000 | $156 | 65 |
| 8222 Pleasant Plains Rd | 0.64mi | 3/2.0 (-1) | 1,800 (-3%) | 1mo | $392,000 | $218 | 59 |
| 8217 Pleasant Plains Rd | 0.65mi | 3/2.0 (-1) | 1,800 (-3%) | 6mo | $250,000 | $139 | 54 |
| 1582 Cottage Ln | 0.66mi | 3/1.0 (-1) | 1,800 (-3%) | 2mo | $250,000 | $139 | 53 |
| 1569 Glen Keith Blvd | 0.74mi | 3/2.0 (-1) | 1,830 (-2%) | 7mo | $310,000 | $169 | 52 |
| 1603 Thetford Rd | 0.43mi | 3/2.0 (-1) | 1,620 (-13%) | 3mo | $338,000 | $209 | 51 |
| 1637 Cottage Ln | 0.65mi | 3/2.0 (-1) | 1,705 (-8%) | 3mo | $300,000 | $176 | 48 |
| 8415 Pleasant Plns | 0.49mi | 3/1.5 (-1) | 1,620 (-13%) | 2mo | $291,000 | $180 | 46 |
| 2200 Ellen Ave | 0.68mi | 3/1.5 (-1) | 1,728 (-7%) | 4mo | $275,000 | $159 | 46 |
| 1859 Loch Shiel Rd | 0.61mi | 3/2.0 (-1) | 1,708 (-8%) | 9mo | $317,000 | $186 | 45 |
| 8151 Clyde Bank Rd | 0.75mi | 5/2.0 (+1) | 2,037 (+9%) | 7mo | $365,000 | $179 | 39 |
| 1574 Glen Keith Blvd | 0.72mi | 3/2.0 (-1) | 2,140 (+15%) | 2mo | $392,000 | $183 | 35 |
Match score weights: distance 35% · size 25% · config 20% · recency 20%. Top-matched comps best support the ARV.
Projected returns pro-forma
-3.0% appreciation · 6.68% rent growth · sell at horizon
- IRR
- -11.6%
- Equity multiple
- 0.57×
- Total profit
- $-33,897
- Equity at exit
- $41,600
- IRR
- 2.3%
- Equity multiple
- 1.19×
- Total profit
- $15,228
- Equity at exit
- $24,123
Cash invested: $78,120 (down + closing). Projections, not guarantees.
Landlord ↔ Tenant lean methodology
- Overall (STATE)
- 27 Tenant-Leaning
- State Maryland
- 27 Tenant-Leaning · D+14
- County
- — inherits STATE
- City
- — inherits STATE
ZIP-level market 21234
- Rents YoY
- 6.7%
- Active inventory
- 234
- Price-to-rent
- 9.3×
Monthly cashflow live
- Estimated rent
- $2,493 high interval (Pro) →
- Mortgage (P&I)
- −$1,463
- Tax from tax record
- −$297 /mo · $3,565/yr
- Insurance
- −$116
- Flood insurance flood zone
- −$66 /mo · $798/yr
- HOA
- −$0
- Vacancy / Maint / Mgmt
- −$524
- Net cashflow
- $27
Break-even live
Sensitivity live
| Price | -10% $185 | -5% $106 | +0% $27 | +5% $-52 | +10% $-131 |
|---|---|---|---|---|---|
| Rent | -10% $-170 | -5% $-72 | +0% $27 | +5% $125 | +10% $224 |
| Rate | -1.0pp $167 | -0.5pp $98 | base $27 | +0.5pp $-46 | +1.0pp $-119 |
UW: 25.0% down · 7.5% · 30yr · 1.5% tax · 5.0% vac · 8.0% maint · 8.0% mgmt
Financing live
Cash to close
- Down payment
- $69,750
- Closing costs
- $8,370
- Reserves months
- —
- Total cash needed
- —
Loan-product check · same deal, 3 products live
Conventional
25% down · 7.5% · 30yr
- Down + closing
- —
- Monthly P&I
- —
- Monthly cashflow
- —
- DSCR
- —
- Eligible?
- —
Personal DTI + credit; lowest rate.
DSCR
20% down · 8.5% · 30yr
- Down + closing
- —
- Monthly P&I
- —
- Monthly cashflow
- —
- DSCR
- —
- Eligible?
- —
No personal income docs; deal must DSCR.
Hard money
10% down · 12.0% · 12mo
- Down + closing
- —
- Monthly P&I
- —
- Monthly cashflow
- —
- DSCR
- —
- Eligible?
- —
Short-term bridge; refi at stabilization.
Rent comps 32 comps
| Address | Beds | Baths | Sqft | Rent | $/sqft | DOM | Units | Dist |
|---|---|---|---|---|---|---|---|---|
| 1726 Redwood Ave Parkville, MD | 4.0 | 2.0 | 1435 | $2,250 | $1.57 | 19d | 1 | 0.12mi |
| 1714 Pin Oak Rd Parkville, MD | 3.0 | 1.0 | 1534 | $2,800 | $1.83 | 7d | 1 | 0.14mi |
| 8533 Oak Rd Parkville, MD | 3.0 | 2.0 | 1480 | $2,100 | $1.42 | 45d | 1 | 0.19mi |
| 1717 Northview Rd Parkville, MD | 3.0 | 1.5 | 1260 | $1,980 | $1.57 | 7d | 1 | 0.19mi |
| 8623 Willow Oak Rd Parkville, MD | 3.0 | 2.0 | 1395 | $2,700 | $1.94 | 45d | 1 | 0.21mi |
| 8340 Edgedale Rd Parkville, MD | 3.0 | 2.0 | 1260 | $2,400 | $1.90 | 7d | 1 | 0.21mi |
| 1726 Yakona Rd Unit A Parkville, MD | 3.0 | 1.0 | 1865 | $1,400 | $0.75 | 45d | 1 | 0.25mi |
| 8650 Rock Oak Rd Parkville, MD | 4.0 | 2.0 | 1800 | $3,108 | $1.73 | 45d | 1 | 0.27mi |
| 1644 Yakona Rd Towson, MD | 3.0 | 2.0 | 1600 | $2,500 | $1.56 | 19d | 1 | 0.29mi |
| 8505 Pleasant Plains Rd Towson, MD | 3.0 | 2.0 | 1580 | $2,500 | $1.58 | 19d | 1 | 0.38mi |
| 8616 Pleasant Plains Rd Towson, MD | 3.0 | 2.0 | 1580 | $2,490 | $1.58 | 16d | 1 | 0.40mi |
| 1583 Doxbury Rd Towson, MD | 4.0 | 2.0 | 1920 | $3,000 | $1.56 | 7d | 1 | 0.43mi |
| 1612 Hardwick Rd Towson, MD | 4.0 | 2.0 | 1275 | $2,450 | $1.92 | 4d | 1 | 0.44mi |
| 8426 Pleasant Plains Rd Towson, MD | 3.0 | 1.5 | 1920 | $2,500 | $1.30 | 19d | 1 | 0.48mi |
| 8339 Wyton Rd Towson, MD | 4.0 | 2.0 | 1520 | $2,534 | $1.67 | 26d | 1 | 0.48mi |
| 1809 Glen Ridge Rd Towson, MD | 3.0 | 1.5 | 1640 | $2,100 | $1.28 | 45d | 1 | 0.52mi |
| 8592 Quentin Ave Parkville, MD | 3.0 | 1.5 | 1440 | $2,100 | $1.46 | 7d | 1 | 0.53mi |
| 8309 Pleasant Plains Rd Towson, MD | 3.0 | 1.0 | 1350 | $3,000 | $2.22 | 45d | 1 | 0.56mi |
| 1929 Edgewood Rd Unit 1929 Towson, MD | 3.0 | 2.0 | 1700 | $2,350 | $1.38 | 13d | 1 | 0.60mi |
| 8130 Kirkwall Ct Towson, MD | 3.0 | 1.5 | 1280 | $2,625 | $2.05 | 26d | 1 | 0.80mi |
| 8768 Cimarron Cir Parkville, MD | 4.0 | 1.5 | 1752 | $2,395 | $1.37 | 26d | 1 | 0.85mi |
| 1376 Halstead Rd Parkville, MD | 3.0 | 1.0 | 1440 | $2,400 | $1.67 | 26d | 1 | 0.89mi |
| 8500 Arry Pl Parkville, MD | 3.0 | 2.5 | 2100 | $2,500 | $1.19 | 45d | 1 | 0.98mi |
| 15 Treeway Ct Towson, MD | 1.0–3.0 | 1.0–2.0 | 1100 | $2,342 | $2.13 | 0d | 25 | 1.06mi |
| 931 Beaverbank Cir Towson, MD | 3.0 | 2.0 | 1725 | $2,500 | $1.45 | 45d | 1 | 1.07mi |
| 1127 Deanwood Rd Parkville, MD | 3.0 | 2.0 | 1730 | $2,350 | $1.36 | 45d | 1 | 1.17mi |
| 23 Roger Valley Ct Parkville, MD | 3.0 | 3.5 | 1678 | $2,850 | $1.70 | 7d | 1 | 1.19mi |
| 23 Roger Valley Ct Unit 1 Parkville, MD | 3.0 | 4.0 | 1678 | $2,850 | $1.70 | 7d | 1 | 1.19mi |
| 6906 Donachie Rd Baltimore, MD | 1.0–3.0 | 1.0–2.0 | 1102 | $2,363 | $2.14 | 0d | 34 | 1.23mi |
| 7202 Sindall Rd Unit 7202 Parkville, MD | 3.0 | 1.0 | 1350 | $1,850 | $1.37 | 45d | 1 | 1.33mi |
| 1112 Ivywood Ln Towson, MD | 1.0–3.0 | 1.0–2.0 | 1191 | $2,775 | $2.33 | 0d | 31 | 1.34mi |
| 2518 Linwood Rd Parkville, MD | 3.0 | 1.5 | 1946 | $2,200 | $1.13 | 18d | 1 | 1.44mi |
Listing history 3 events
-
2026-06-22remarks 250-char remark
-
2026-06-21remarks 248-char remark
-
2026-06-21$279,000 Coming Soon 1 DOM
ⓘ Source: listings_history table (triggers on properties + properties_extension) + one-shot
backfill from property_details.listing_events for pre-trigger history.
Tax reassessment forecast MD · Partial reset (capped growth)
- Current annual tax
- $3,565 · $297/mo
- Projected year-2 tax
- $3,565 · $297/mo
- Expected delta
- $0/yr ($0/mo · 0.0%)
ⓘ Screening estimate from a state-policy table — verify with the county assessor before closing.
Climate risk First Street
- Flood 8/10 Severe FEMA zone X (unshaded) · 99% chance over 30 yrs
- Wildfire 1/10 Low
- Heat 7/10 Severe 7 d/yr ≥103°F today · 15 d/yr by 30 yrs out
- Wind 6/10 Major 27% chance of damaging wind over 30 yrs
- Air quality 4/10 Moderate 3 unhealthy d/yr today · 6 by 30 yrs out
Nearby sold comps map
Loading sold comps map…
Walkable amenities ~0.75 mi
Loading nearby amenities…
Taxation est. · year 1
- Rental income
- $29,917
- − Mortgage interest
- −$15,628
- − Property taxes
- −$3,565
- − Insurance
- −$2,192
- − Repairs & maintenance
- −$2,393
- − Management
- −$2,393
- − Depreciation
- −$8,116
- Taxable loss
- −$4,372
- Est. tax savings @ 24.0%
- +$1,049
- After-tax cash flow
- $1,369/yr
For passive investors: Depreciation is non-cash, so a rental often shows a tax loss while cash-flowing — sheltering income. Rental losses are passive: they offset passive income freely, and up to $25,000/yr can offset ordinary (W-2) income if you actively participate and your MAGI is under $100k (phasing out to $0 by $150k); unused losses carry forward. On sale, claimed depreciation is recaptured at up to 25%, and gains may owe capital-gains tax (a 1031 exchange can defer both). Figures are a year-1 estimate at your 24.0% rate — not tax advice; consult a CPA.
Schools (NCES district)
- District
- Baltimore County Public Schools
- NCES district ID
- 2400120
- Math proficiency
- 15% ▼ -16.00%
- Reading proficiency
- 34% ▼ -5.00%
- Median HH income
- $66,746
- Composite
- 23.17/100
- National rank
- #7948
- State rank
- #11 of 24 in MD
Livability — Parkville
- Score
- 77/100
- State rank
- #77
- US rank
- #2839
Category grades
Schools grade is shown separately in the Schools card above.
Census & demographics
- Census place
- Parkville, MD
- County
- Baltimore County · 769,527 people
- City population
- 66,334
- Metro
- Baltimore-Columbia-Towson, MD
- Population (ZIP)
- 66,334
- Household income
- $83,517
- Rent vs Own
- Severe rent burden
- 2719.0
Population outlook (Baltimore County) Hauer SSP2
- Today (2025)
- 885,518 people
- By 2030
- 909,272 · +2.7%
- By 2040
- 951,547 · +7.5%
- By 2050
- 990,955 · +11.9%
- By 2075
- 1,086,411 · +22.7%
- By 2100
- 1,135,078 · +28.2%
Race, ethnicity, and origin ACS 2023
- Neighborhood character
- Diverse neighborhood (Simpson 0.58)
- Race & ethnicity
- White 58% Black 28% Asian 5% Hispanic / Latino 5% Two or more races 5%
- Common ancestry
- Romanian 5% Lithuanian 1% Italian 1%
- Foreign-born
- 10% · Canada, China, South Korea
- Languages at home
- 89% English-only · Spanish 3% Other Indo-European 2% Tagalog/Filipino 1%
Political lean MEDSL · Baltimore
- 2024 margin
- Strong D (+24.5) · D 61.0% · R 36.5% · Other 2.5%
- 2008→2024 swing
- +9.9pp toward D · 2008: 14.6pp · 2024: 24.5pp
- All cycles
- 2024: D+24.5 2020: D+27.0 2016: D+17.4 2012: D+16.4 2008: D+14.6
Not yet ingested
- Civics
- —
Market trends
- HPI YoY
- ▼ -247.04%
- Current HPI
- 254.3824
- Rent YoY
- ▲ 6.68%
- Metro
- Baltimore-Columbia-Towson, MD
- State GDP YoY
- ▲ 2.97%
- F500 in state
- 12
Industry mix (Fortune 500 HQ in MD)
| Industry | F500 HQs | Revenue |
|---|---|---|
| Aerospace / Defense | 1 | $71B |
|
||
| Utilities | 1 | $25B |
|
||
| Hotels | 1 | $24B |
|
||
| Consumer Goods | 1 | $7B |
|
||
| Real Estate | 1 | $6B |
|
||
| Chemicals | 1 | $2B |
|
||
Price history
+1043.4% since first listed18 events — show timeline
- 2026-06-20 Coming Soon $279,000 BRIGHT MLS
- 2026-05-19 Sold (Public Records) $140,000 Public Records
- 2026-04-03 Listing Removed — BRIGHT MLS
- 2026-03-17 Contingent — BRIGHT MLS
- 2026-03-10 Listed $179,900 BRIGHT MLS
- 2026-03-01 Coming Soon — BRIGHT MLS
- 2016-10-25 Sold (Public Records) $116,500 Public Records
- 2016-09-29 Sold (MLS) $116,500 BRIGHT MLS
- 2016-09-29 Sold (MLS) $116,500 MRIS
- 2016-08-22 Pending — MRIS
- 2016-08-20 Listing Removed — BRIGHT MLS
- 2016-08-15 Listed $112,000 MRIS
- 2016-08-15 Listed $112,000 BRIGHT MLS
- 2004-06-24 Sold (Public Records) $119,900 Public Records
- 2004-05-27 Sold (MLS) $119,900 MRIS
- 2004-04-07 Delisted — MRIS
- 2004-04-02 Listed $119,900 MRIS
- 1977-02-28 Sold (Public Records) $24,400 Public Records
Property tax history
+3.5%/yrLatest (2025): $3,565 · +8.8% YoY. Source: county tax records.
Cash-flow waterfall
monthlySold comps — $/sqft
last 12 mo · ≤1 miLoading sold comps…