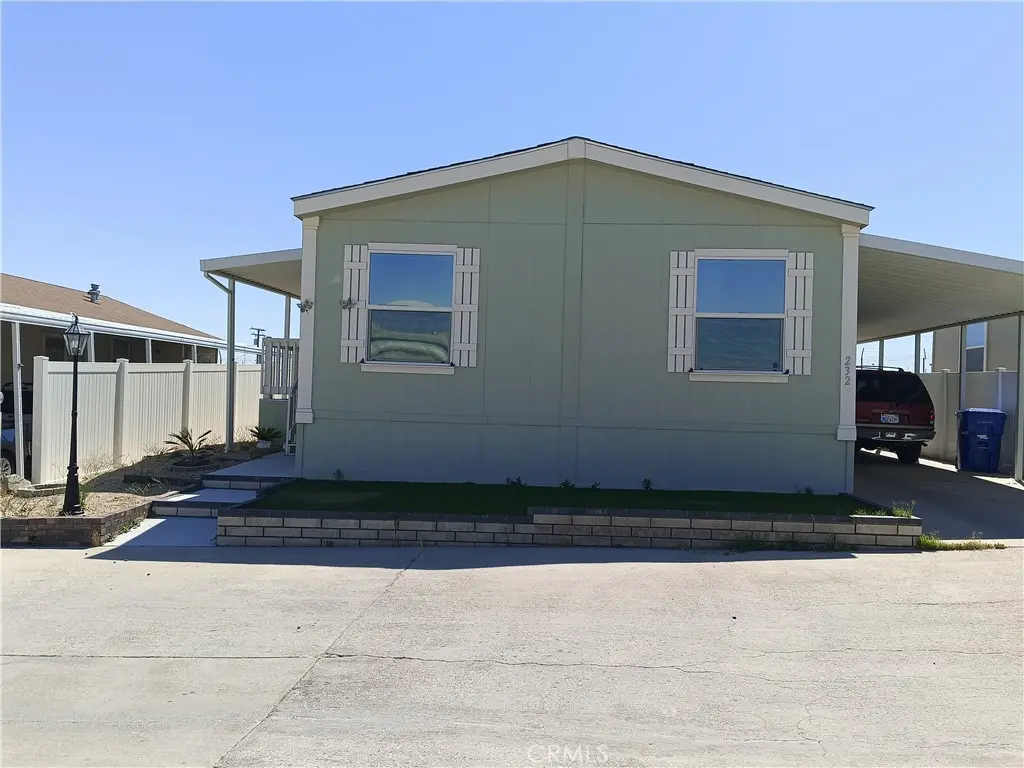
2494 W Main St #232 · Barstow, CA
Flood risk 1/10 · Minimal
- FEMA flood zone
- X (unshaded)
- Chance of flooding over 30 yrs
- 0.0%
- Est. flood insurance / yr
- $507 – $1,088
Fire risk 1/10 · Minimal
- Est. fire insurance / yr
- $659 – $1,223
Heat risk 8/10 · Major
- Hot days now (above 102°F)
- 7 days/yr
- Hot days in 30 yrs
- 20 days/yr
Wind risk 1/10 · Minimal
- Chance of severe wind over 30 yrs
- —
Air-quality risk 6/10 · Moderate
- Unhealthy air days now
- 10 days/yr
- Unhealthy air days in 30 yrs
- 14 days/yr
Risk factors via First Street. Map © Google.
Why this score? — see what drove the B- grade
The composite is a weighted blend of 9 inputs, each scored 0–100. Each bar is that input's sub-score; the figure is the points it added to the 100-point composite (weight × sub-score).
- Cash flow +30.0/30.0
- DSCR +10.0/10.0
- 1% rule +9.2/10.0
- ARV discount +5.9/15.0
- Condition / age +4.0/5.0
- Livability +3.2/5.0
- Rent growth +3.1/5.0
- Schools +1.4/10.0
- Appreciation +0.0/10.0
$120,000
🖨 Deal sheet (PDF) 📄 Offer letter ✓ Due diligence
Listing remarks
This newer mobile home is spacious, well maintained, and nicely priced. Featuring a clean, inviting interior and plenty of room to enjoy. A must-see opportunity that won’t last long — make it yours today!
Key facts
- Community pool
- Built 2021
- Listed 37 days
Property features AI
Finance
- Other: Suburban community setting
- HOA & community: Monthly land lease of $550
Exterior
- Parking: Located in Santiago Desert View mobile home park
- Utilities: Public sewer; District/public water
- Home design: Single-story mobile home (Creekside Manor model); Entry is on level 1
- Construction: Mobile home remains on site; Mobile dimensions approximately 11 ft by 48 ft; Year built per public records
- Exterior features: Community pool; Desert front and back landscaping
Interior
- Bathrooms: 2 full bathrooms
- Heating & cooling: Central furnace heating
- Interior features: Front door entry
- Laundry & utility: Inside laundry
Neighborhood map
What this means for you Summary
Snapshot
- This is a 3-bed/2.0-bath manufactured listed at $120k. Condition is rated good.
Deal economics
- At list price, monthly cash flow is $515 ($6k/yr) — positive.
- The deal already cash-flows at list — no discount required.
- Meets the 1% rule at list price ($2k rent vs $120k).
- Recommended offer: $116k (3.0% below list) — sets the bar for market timing.
- Cap rate 11.4% vs local median 4.5% in Barstow — top-decile yield for the area; either an underpriced asset or a hidden risk that comps aren't pricing in. Stress-test before assuming the spread holds.
Location & tenants
- Location reads 63/100 on livability (#444 in CA) — a middle-class / working-renter tenant base. Strengths: commute A+, housing A+; Watch: amenities C-, health & safety C-, crime F.
- Barstow Unified (town): math 11% / reading 22% proficiency, ranked #482 of 517 in CA (top 93%) — low school quality limits family demand, transient renter base, plan for 1-2y turnover; 68% free/reduced lunch — lower-income household profile, screen leases tightly.
- Zoned schools: Lenwood Elementary (math 7% / reading 11%, grade F, #1,544 of 1,571 statewide, top 98%, 505 students, 84% FRL); Barstow Junior High (math 4% / reading 13%, grade F, #495 of 498 statewide, top 100%, 742 students, 80% FRL); Barstow High (math 22% / reading 47%, grade F, #618 of 1,170 statewide, top 56%, 1,584 students, 67% FRL).
- Market conditions: Rents rising (+2.3%/yr); 349 active listings in the ZIP; 5 comparable units currently listed for rent nearby; rentals at typical pace (median 27d on market — plan ~3-4 weeks tenant-placement turnaround); 40% of comp listings sitting > 30 days — soft ceiling on asking rent; 5,458 units permitted in San Bernardino County in 2024 (1,500 in 5+ unit buildings).
- This rent runs 33% of the median local income ($62k/yr) — at the standard rent-burdened threshold; future hikes will face affordability resistance.
Forward outlook
- Local home prices are declining (-3.0%/yr); year-one equity from $830 of loan paydown is wiped out by about $4k of value loss. Plan a longer hold.
- San Bernardino County population projected at +15% by 2050 — modest demand growth; plan on rents tracking national, not racing it.
- At projected returns (-3.0% appreciation + 2.3% rent growth), your $34k cash investment doubles in ~7 years — after that, you're playing with house money.
Negotiation context
- It's been on market 37 days — a 3% lower offer ($116k) is reasonable based on typical stale-listing flexibility.
Risks & watch-outs
- Climate carrying-cost: extreme-heat days projected 7→20/yr by 2055 (HVAC capex compounding) — expect insurance premiums to compound above CPI over the hold.
Questions for the listing agent
- It's been on market 37 days. Have you received any prior offers? Is the seller open to a 3% concession, seller financing, or rate buy-down credit?
- Is there a deadline driving the sale (1031 exchange, divorce, estate, relocation)? That informs how much negotiation room exists.
- Schools are F-rated, which usually means shorter tenancies and higher turnover. Who's the typical renter profile here, and what's been the actual vacancy rate?
- Crime grade is F in this area — have there been break-ins, vandalism, or insurance claims at this property in the last 3 years? What carrier currently insures it and at what premium?
- What's the average days-on-market for RENTAL listings here right now (not sales)? A rising rental-DOM trend means longer vacancies and softer asking-rent achievability than the comps imply.
- What's the recent tenant-quality profile in this submarket — average credit score on applications, eviction rate, late-payment / NSF rate, and stable-employment percentage? A property-management company in the area should have these aggregated.
- How much new for-sale + rental construction is in the pipeline within 1–3 miles? Heavy new supply typically softens prices + rents 12–24 months out; constrained supply supports both.
Investment metrics
- 1% rule
- 1.42% ✓
- Cap rate
- 11.44%
- Cash-on-cash
- 18.38%
- DSCR
- 1.82
- GRM
- 5.9
CMA / ARV
- ARV (median comp)
- $116,000
- List price
- $120,000
- Delta
- 3.45%
- Verdict
- FAIR
- Comps
- 1 within 2.0 mi
Show comp detail 5 sales within ~0.75 mi
| Address | Dist | Beds/Ba | Sqft | Sold | Price | $/sf | Match |
|---|---|---|---|---|---|---|---|
| 2494 Main St #238 | 0.00mi | 3/2.0 | 1,152 (0%) | 13mo | $69,000 | $60 | 89 |
| 2494 W Main St #219 | 0.00mi | 3/2.0 | 1,248 (+8%) | 5mo | $116,000 | $93 | 82 |
| 2494 W Main St #51 | 0.00mi | 3/2.0 | 1,248 (+8%) | 13mo | $120,000 | $96 | 75 |
| 2494 W Main St #46 | 0.00mi | 2/2.0 (-1) | 1,248 (+8%) | 12mo | $69,999 | $56 | 71 |
| 2494 W Main St #96 | 0.00mi | 3/2.0 | 1,280 (+11%) | 16mo | $155,000 | $121 | 68 |
Match score weights: distance 35% · size 25% · config 20% · recency 20%. Top-matched comps best support the ARV.
Projected returns pro-forma
-3.0% appreciation · 2.32% rent growth · sell at horizon
- IRR
- 9.3%
- Equity multiple
- 1.36×
- Total profit
- $12,201
- Equity at exit
- $17,892
- IRR
- 17.9%
- Equity multiple
- 2.44×
- Total profit
- $48,255
- Equity at exit
- $10,375
Cash invested: $33,600 (down + closing). Projections, not guarantees.
Landlord ↔ Tenant lean methodology
- Overall (STATE)
- 18 Strongly Tenant-Friendly
- State California
- 18 Strongly Tenant-Friendly · D+13
- County
- — inherits STATE
- City
- — inherits STATE
ZIP-level market 92311
- Home prices YoY
- -30.6%
- Rents YoY
- 2.3%
- Active inventory
- 349
- Price-to-rent
- 5.9×
Monthly cashflow live
- Estimated rent
- $1,701 high interval (Pro) →
- Mortgage (P&I)
- −$629
- Tax est. 1.5%
- −$150 /mo · $1,800/yr
- Insurance
- −$50
- HOA
- −$0
- Vacancy / Maint / Mgmt
- −$357
- Net cashflow
- $515
Break-even live
Sensitivity live
| Price | -10% $598 | -5% $556 | +0% $515 | +5% $473 | +10% $432 |
|---|---|---|---|---|---|
| Rent | -10% $380 | -5% $447 | +0% $515 | +5% $582 | +10% $649 |
| Rate | -1.0pp $575 | -0.5pp $545 | base $515 | +0.5pp $484 | +1.0pp $452 |
UW: 25.0% down · 7.5% · 30yr · 1.5% tax · 5.0% vac · 8.0% maint · 8.0% mgmt
Financing live
Cash to close
- Down payment
- $30,000
- Closing costs
- $3,600
- Reserves months
- —
- Total cash needed
- —
Loan-product check · same deal, 3 products live
Conventional
25% down · 7.5% · 30yr
- Down + closing
- —
- Monthly P&I
- —
- Monthly cashflow
- —
- DSCR
- —
- Eligible?
- —
Personal DTI + credit; lowest rate.
DSCR
20% down · 8.5% · 30yr
- Down + closing
- —
- Monthly P&I
- —
- Monthly cashflow
- —
- DSCR
- —
- Eligible?
- —
No personal income docs; deal must DSCR.
Hard money
10% down · 12.0% · 12mo
- Down + closing
- —
- Monthly P&I
- —
- Monthly cashflow
- —
- DSCR
- —
- Eligible?
- —
Short-term bridge; refi at stabilization.
Rent comps 5 comps
| Address | Beds | Baths | Sqft | Rent | $/sqft | DOM | Units | Dist |
|---|---|---|---|---|---|---|---|---|
| 34465 J St Barstow, CA | 3.0 | 2.0 | 1258 | $2,200 | $1.75 | 45d | 1 | 0.99mi |
| 28188 Apache Ave Barstow, CA | 2.0 | 1.0 | 841 | $1,275 | $1.52 | 7d | 1 | 1.16mi |
| 27333 Mesquite St Barstow, CA | 3.0 | 2.0 | 1120 | $1,595 | $1.42 | 26d | 1 | 1.35mi |
| 1400 Nancy St Barstow, CA | 3.0 | 1.0 | 1041 | $1,595 | $1.53 | 26d | 1 | 1.38mi |
| 1411 Nancy St Barstow, CA | 3.0 | 1.0 | 1080 | $1,399 | $1.30 | 45d | 1 | 1.38mi |
Listing history 17 events
-
2026-06-21days on market $120,000 Active 37 DOM
-
2026-06-18days on market $120,000 Active 34 DOM
-
2026-06-17days on market $120,000 Active 33 DOM
-
2026-06-16days on market $120,000 Active 32 DOM
-
2026-06-15days on market $120,000 Active 31 DOM
-
2026-06-13days on market $120,000 Active 29 DOM
-
2026-06-13days on market $120,000 Active 28 DOM
-
2026-06-09days on market $120,000 Active 25 DOM
-
2026-06-08days on market $120,000 Active 24 DOM
-
2026-06-07pricedays on market $120,000 Active 23 DOM
-
2026-06-04days on market $130,000 Active 20 DOM
-
2026-06-03days on market $130,000 Active 19 DOM
-
2026-06-02days on market $130,000 Active 18 DOM
-
2026-06-01days on market $130,000 Active 17 DOM
-
2026-05-31days on market $130,000 Active 16 DOM
-
2026-05-15$130,000 Active 216-char remark
-
2026-05-11historical $130,000 216-char remark
ⓘ Source: listings_history table (triggers on properties + properties_extension) + one-shot
backfill from property_details.listing_events for pre-trigger history.
Climate risk First Street
- Flood 1/10 Low FEMA zone X (unshaded) · 0% chance over 30 yrs
- Wildfire 1/10 Low
- Heat 8/10 Severe 7 d/yr ≥102°F today · 20 d/yr by 30 yrs out
- Wind 1/10 Low
- Air quality 6/10 Major 10 unhealthy d/yr today · 14 by 30 yrs out
Nearby sold comps map
Loading sold comps map…
Walkable amenities ~0.75 mi
Loading nearby amenities…
Taxation est. · year 1
- Rental income
- $20,414
- − Mortgage interest
- −$6,722
- − Property taxes
- −$1,800
- − Insurance
- −$600
- − Repairs & maintenance
- −$1,633
- − Management
- −$1,633
- − Depreciation
- −$3,491
- Taxable income
- $4,535
- Est. tax owed @ 24.0%
- −$1,088
- After-tax cash flow
- $5,087/yr
For passive investors: Depreciation is non-cash, so a rental often shows a tax loss while cash-flowing — sheltering income. Rental losses are passive: they offset passive income freely, and up to $25,000/yr can offset ordinary (W-2) income if you actively participate and your MAGI is under $100k (phasing out to $0 by $150k); unused losses carry forward. On sale, claimed depreciation is recaptured at up to 25%, and gains may owe capital-gains tax (a 1031 exchange can defer both). Figures are a year-1 estimate at your 24.0% rate — not tax advice; consult a CPA.
Condition & rehab AI · 29 photos
This newer mobile home is in good condition with no visible damage. It is well-maintained and nicely priced, making it a must-see opportunity that won’t last long.
Value-add opportunities
- Resale Paint the exterior siding — A fresh coat of paint can significantly enhance the curb appeal and resale value.
- Resale Replace any damaged windows — New windows can improve energy efficiency and increase the home's value.
- Resale Replace any damaged flooring — New flooring can improve the home's appearance and increase its value.
- Resale Replace any damaged interior walls/paint — Fresh paint can improve the home's appearance and increase its value.
- Resale Replace any damaged kitchen appliances — New kitchen appliances can improve the home's functionality and increase its value.
- Resale Replace any damaged bathroom fixtures — New bathroom fixtures can improve the home's functionality and increase its value.
- Resale Replace any damaged HVAC and mechanical systems — New HVAC and mechanical systems can improve the home's functionality and increase its value.
- Resale Improve the landscaping and curb appeal — A well-maintained landscape can significantly enhance the home's curb appeal and increase its value.
- Rental Replace any damaged flooring — New flooring can improve the home's appearance and increase its rental value.
- Rental Replace any damaged interior walls/paint — Fresh paint can improve the home's appearance and increase its rental value.
- Rental Replace any damaged kitchen appliances — New kitchen appliances can improve the home's functionality and increase its rental value.
- Rental Replace any damaged bathroom fixtures — New bathroom fixtures can improve the home's functionality and increase its rental value.
- Rental Replace any damaged HVAC and mechanical systems — New HVAC and mechanical systems can improve the home's functionality and increase its rental value.
- Rental Improve the landscaping and curb appeal — A well-maintained landscape can significantly enhance the home's curb appeal and increase its rental value.
Renovation cost estimate screening
Value-add ROI direction
- Resale Paint the exterior siding — A fresh coat of paint can significantly enhance the curb appeal and resale value. ↑
- Resale Replace any damaged windows — New windows can improve energy efficiency and increase the home's value. ↑
- Resale Replace any damaged flooring — New flooring can improve the home's appearance and increase its value. ↑
- Resale Replace any damaged interior walls/paint — Fresh paint can improve the home's appearance and increase its value. ↑
- Resale Replace any damaged kitchen appliances — New kitchen appliances can improve the home's functionality and increase its value. ↑
- Resale Replace any damaged bathroom fixtures — New bathroom fixtures can improve the home's functionality and increase its value. ↑
- Resale Replace any damaged HVAC and mechanical systems — New HVAC and mechanical systems can improve the home's functionality and increase its value. ↑
- Resale Improve the landscaping and curb appeal — A well-maintained landscape can significantly enhance the home's curb appeal and increase its value. ↑
- Rental Replace any damaged flooring — New flooring can improve the home's appearance and increase its rental value. ↑
- Rental Replace any damaged interior walls/paint — Fresh paint can improve the home's appearance and increase its rental value. ↑
- Rental Replace any damaged kitchen appliances — New kitchen appliances can improve the home's functionality and increase its rental value. ↑
- Rental Replace any damaged bathroom fixtures — New bathroom fixtures can improve the home's functionality and increase its rental value. ↑
- Rental Replace any damaged HVAC and mechanical systems — New HVAC and mechanical systems can improve the home's functionality and increase its rental value. ↑
- Rental Improve the landscaping and curb appeal — A well-maintained landscape can significantly enhance the home's curb appeal and increase its rental value. ↑
ⓘ Cost ranges are severity-bucket heuristics (US national rule-of-thumb). Get contractor quotes + a written scope before underwriting a rehab budget.
Schools (NCES district)
- District
- Barstow Unified
- NCES district ID
- 0604020
- Math proficiency
- 11% ▼ -7.00%
- Reading proficiency
- 22% ▼ -7.00%
- Median HH income
- $44,505
- Composite
- 14.44/100
- National rank
- #9430
- State rank
- #482 of 517 in CA
Livability — Barstow
- Score
- 63/100
- State rank
- #444
- US rank
- #15099
Category grades
Schools grade is shown separately in the Schools card above.
Census & demographics
- Census place
- Barstow, CA
- County
- San Bernardino County · 2,030,291 people
- City population
- 33,954
- Metro
- Riverside-San Bernardino-Ontario, CA
- Population (ZIP)
- 33,954
- Household income
- $61,862
- Rent vs Own
- Severe rent burden
- 1305.0
Population outlook (San Bernardino County) Hauer SSP2
- Today (2025)
- 2,300,329 people
- By 2030
- 2,378,907 · +3.4%
- By 2040
- 2,523,137 · +9.7%
- By 2050
- 2,642,388 · +14.9%
- By 2075
- 2,880,769 · +25.2%
- By 2100
- 2,909,436 · +26.5%
Race, ethnicity, and origin ACS 2023
- Neighborhood character
- Diverse neighborhood (Simpson 0.68)
- Race & ethnicity
- Hispanic / Latino 46% White 29% Two or more races 22% Black 15% Native American 3% Asian 2% Pacific Islander 1%
- Hispanic origin (detail)
- Mexican 39% Puerto Rican 2%
- Common ancestry
- Portuguese 1% Lithuanian 1% Italian 1%
- Foreign-born
- 9% · Canada, South Korea
- Languages at home
- 77% English-only · Spanish 20% Tagalog/Filipino 1% Other Indo-European 1%
Political lean MEDSL · San Bernardino
- 2024 margin
- Toss-up / Even · D 47.5% · R 49.7% · Other 2.8%
- 2008→2024 swing
- -8.5pp toward R · 2008: 6.3pp · 2024: -2.1pp
- All cycles
- 2024: R+2.1 2020: D+10.7 2016: D+9.8 2012: D+5.4 2008: D+6.3
Not yet ingested
- Civics
- —
Market trends
- HPI YoY
- ▼ -139.26%
- Current HPI
- 316.4858
- Rent YoY
- ▲ 2.32%
- Metro
- Riverside-San Bernardino-Ontario, CA
- State GDP YoY
- ▲ 3.21%
- F500 in state
- 116
Industry mix (Fortune 500 HQ in CA)
| Industry | F500 HQs | Revenue |
|---|---|---|
| Technology | 27 | $1,492B |
|
||
| Financial Services | 3 | $174B |
|
||
| Retail | 3 | $44B |
|
||
| Insurance | 3 | $26B |
|
||
| Media / Entertainment | 2 | $115B |
|
||
| Pharmaceuticals / Biotech | 2 | $62B |
|
||
Price history
-7.7% since first listed3 events — show timeline
- 2026-06-04 Price Changed $120,000 CRMLS
- 2026-05-15 Listed $130,000 CRMLS
- 2026-05-11 Coming Soon $130,000 CRMLS
Cash-flow waterfall
monthlySold comps — $/sqft
last 12 mo · ≤1 miLoading sold comps…