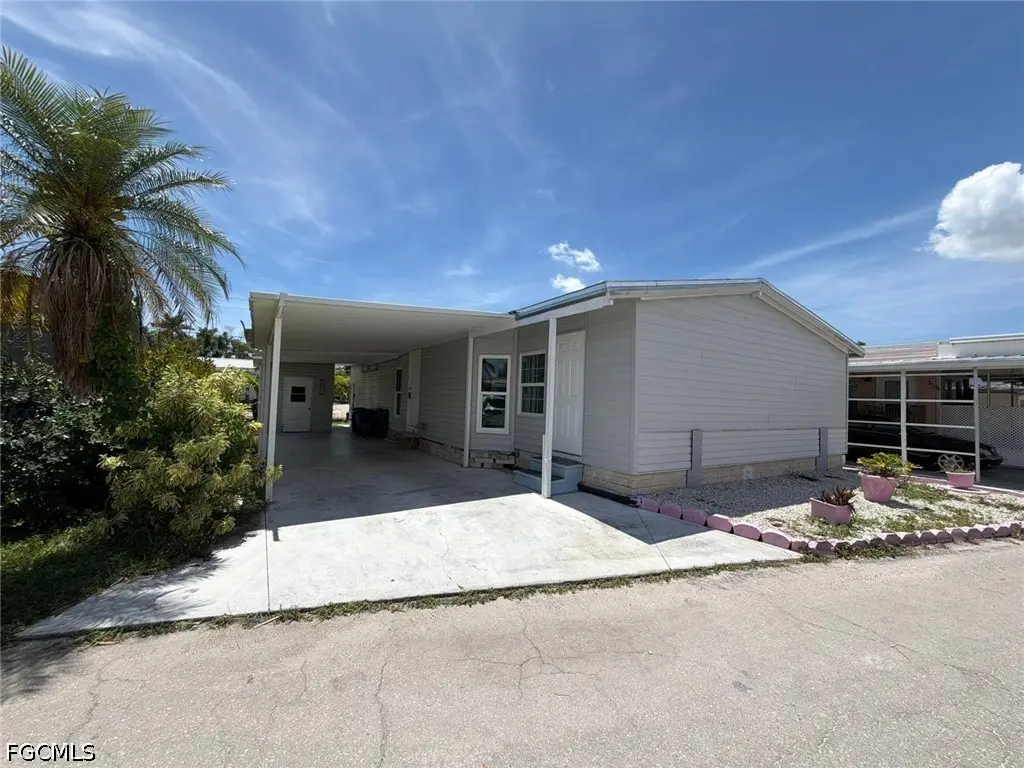
419 SW Pine Island Rd Lot 12 · Cape Coral, FL
Flood risk No data
- FEMA flood zone
- —
- Chance of flooding over 30 yrs
- —
- Est. flood insurance / yr
- —
Fire risk No data
- Est. fire insurance / yr
- —
Heat risk No data
- Hot days now (above threshold)
- —
- Hot days in 30 yrs
- —
Wind risk No data
- Chance of severe wind over 30 yrs
- —
Air-quality risk No data
- Unhealthy air days now
- —
- Unhealthy air days in 30 yrs
- —
Risk factors via First Street. Map © Google.
Why this score? — see what drove the B- grade
The composite is a weighted blend of 9 inputs, each scored 0–100. Each bar is that input's sub-score; the figure is the points it added to the 100-point composite (weight × sub-score).
- Cash flow +30.0/30.0
- 1% rule +10.0/10.0
- DSCR +10.0/10.0
- ARV discount +7.5/15.0
- Schools +4.1/10.0
- Condition / age +4.0/5.0
- Livability +3.9/5.0
- Rent growth +0.4/5.0
- Appreciation +0.0/10.0
$98,780
🖨 Deal sheet (PDF) 📄 Offer letter ✓ Due diligence
Listing remarks
Discover affordable Florida living with added flexibility at 419 SW Pine Island Rd, Lot 12 in Cape Coral, located within a welcoming 55+ community. This newly remodeled home is complete with its own entrance and full bathroom—perfect for guests, extended family, a hobby space, or added privacy. Bright living spaces and a practical design create an inviting atmosphere ideal for seasonal or year-round living. Residents can enjoy the relaxed lifestyle and sense of community that comes with 55+ living, all while being conveniently located near shopping, dining, entertainment, and major roadways. Whether you’re searching for an affordable primary residence, winter escape, or investme
Key facts
- Private ensuite
- Parking
- Built 1991
Tags
Property features AI
Finance
- Financial info: Monthly land lease: $485; Pets allowed with conditions (call for details)
- HOA & community: Senior community; 62 units in the community; No association fee listed
Exterior
- Parking: Attached carport; 1 covered carport space
- Security: Smoke detector(s)
- Utilities: Cable available; Septic tank; Well water
- Home design: Manufactured home; Vinyl siding; One story; Entry on level 1; Faces east; Resale property; Shingle roof; On-site management
- Construction: Manufactured construction; Vinyl siding; Shingle roof
- Exterior features: Security/high-impact doors; Storage; West exposure; Zero lot line
Interior
- Kitchen: Cooktop; Freezer; Microwave; Refrigerator
- Bedrooms: Bedroom on main level; Den
- Flooring: Vinyl flooring
- Bathrooms: 3 full bathrooms; Dual sinks
- Heating & cooling: Central heating (electric); Central air conditioning (electric); Ceiling fan(s)
- Interior features: Impact-resistant windows; Breakfast bar; Living/dining room; Tub/shower; Walk-in closet(s); Split bedrooms; Unfurnished
Neighborhood map
What this means for you Summary
Snapshot
- This is a 2-bed/3.0-bath manufactured listed at $99k. Condition is rated good.
Deal economics
- At list price, monthly cash flow is $798 ($10k/yr) — positive.
- The deal already cash-flows at list — no discount required.
- Meets the 1% rule at list price ($2k rent vs $99k).
- Recommended offer: $97k (1.5% below list) — sets the bar for market timing.
- Cap rate 16.0% vs local median 3.1% in Cape Coral — top-decile yield for the area; either an underpriced asset or a hidden risk that comps aren't pricing in. Stress-test before assuming the spread holds.
Location & tenants
- Location reads 77/100 on livability (#208 in FL, #3,098 nationally) — a middle-class / working-renter tenant base. Strengths: housing A+, health & safety A+, amenities B+; Watch: commute F.
- Lee (suburban): math 47% / reading 50% proficiency, ranked #42 of 73 in FL (top 58%) — families likely to look elsewhere, expect single-tenant / working-renter base with shorter leases.
- Zoned schools: Gulf Elementary School (math 70% / reading 65%, grade B+, #435 of 2,144 statewide, top 21%, 1,231 students, 38% FRL); Challenger Middle School (math 59% / reading 56%, grade B, #157 of 571 statewide, top 28%, 1,124 students, 50% FRL); Ida S. Baker High School (math 44% / reading 47%, grade D-, #223 of 667 statewide, top 34%, 1,933 students, 39% FRL) — zoned schools average 42% FRL vs 57% district-wide (15 pts lower); this property's tenant base skews higher-income than the district average.
- Market conditions: Rents falling (-8.6%/yr); 691 active listings in the ZIP; 40 comparable units currently listed for rent nearby; rentals at typical pace (median 17d on market — plan ~3-4 weeks tenant-placement turnaround); solid renter incomes; 15,411 units permitted in Lee County in 2024 (4,686 in 5+ unit buildings).
Forward outlook
- Local home prices are declining (-3.0%/yr); year-one equity from $683 of loan paydown is wiped out by about $3k of value loss. Plan a longer hold.
- Lee County population projected at +44% by 2050 — long-run rental-demand tailwind backs the buy-and-hold thesis.
- At projected returns (-3.0% appreciation + 0.0% rent growth), your $28k cash investment doubles in ~4 years — after that, you're playing with house money.
Negotiation context
- It's been on market 15 days — a 2% lower offer ($97k) is reasonable based on typical stale-listing flexibility.
Questions for the listing agent
- Is there a deadline driving the sale (1031 exchange, divorce, estate, relocation)? That informs how much negotiation room exists.
- Schools are B-rated — typically a magnet for longer-tenancy family renters. What's the average tenant stay here, and is there a school-zone premium baked into asking?
- What's the average days-on-market for RENTAL listings here right now (not sales)? A rising rental-DOM trend means longer vacancies and softer asking-rent achievability than the comps imply.
- What's the recent tenant-quality profile in this submarket — average credit score on applications, eviction rate, late-payment / NSF rate, and stable-employment percentage? A property-management company in the area should have these aggregated.
- How much new for-sale + rental construction is in the pipeline within 1–3 miles? Heavy new supply typically softens prices + rents 12–24 months out; constrained supply supports both.
Investment metrics
- 1% rule
- 1.90% ✓
- Cap rate
- 15.99%
- Cash-on-cash
- 34.62%
- DSCR
- 2.54
- GRM
- 4.4
CMA / ARV
No comps found within radius.
Projected returns pro-forma
-3.0% appreciation · 0.0% rent growth · sell at horizon
- IRR
- 26.7%
- Equity multiple
- 2.06×
- Total profit
- $29,353
- Equity at exit
- $14,728
- IRR
- 32.4%
- Equity multiple
- 3.53×
- Total profit
- $69,892
- Equity at exit
- $8,541
Cash invested: $27,658 (down + closing). Projections, not guarantees.
Landlord ↔ Tenant lean methodology
- Overall (STATE)
- 87 Strongly Landlord-Friendly
- State Florida
- 87 Strongly Landlord-Friendly · R+3
- County
- — inherits STATE
- City
- — inherits STATE
ZIP-level market 33991
- Home prices YoY
- -27.8%
- Rents YoY
- -8.6%
- Active inventory
- 691
- Price-to-rent
- 4.4×
Monthly cashflow live
- Estimated rent
- $1,874 high interval (Pro) →
- Mortgage (P&I)
- −$518
- Tax est. 1.5%
- −$123 /mo · $1,482/yr
- Insurance
- −$41
- HOA
- −$0
- Vacancy / Maint / Mgmt
- −$394
- Net cashflow
- $798
Break-even live
Sensitivity live
| Price | -10% $866 | -5% $832 | +0% $798 | +5% $764 | +10% $730 |
|---|---|---|---|---|---|
| Rent | -10% $650 | -5% $724 | +0% $798 | +5% $872 | +10% $946 |
| Rate | -1.0pp $848 | -0.5pp $823 | base $798 | +0.5pp $772 | +1.0pp $746 |
UW: 25.0% down · 7.5% · 30yr · 1.5% tax · 5.0% vac · 8.0% maint · 8.0% mgmt
Financing live
Cash to close
- Down payment
- $24,695
- Closing costs
- $2,963
- Reserves months
- —
- Total cash needed
- —
Loan-product check · same deal, 3 products live
Conventional
25% down · 7.5% · 30yr
- Down + closing
- —
- Monthly P&I
- —
- Monthly cashflow
- —
- DSCR
- —
- Eligible?
- —
Personal DTI + credit; lowest rate.
DSCR
20% down · 8.5% · 30yr
- Down + closing
- —
- Monthly P&I
- —
- Monthly cashflow
- —
- DSCR
- —
- Eligible?
- —
No personal income docs; deal must DSCR.
Hard money
10% down · 12.0% · 12mo
- Down + closing
- —
- Monthly P&I
- —
- Monthly cashflow
- —
- DSCR
- —
- Eligible?
- —
Short-term bridge; refi at stabilization.
Rent comps 40 comps
| Address | Beds | Baths | Sqft | Rent | $/sqft | DOM | Units | Dist |
|---|---|---|---|---|---|---|---|---|
| 315 SW Pine Island Rd Cape Coral, FL | 1.0–2.0 | 1.0–2.0 | 974 | $1,699 | $1.74 | 5d | 10 | 0.17mi |
| 186 Tierra De Paz Loop Cape Coral, FL | 1.0–3.0 | 1.0–2.0 | 935 | $1,846 | $1.97 | 4d | 153 | 0.33mi |
| 626 NW 2nd Ln Cape Coral, FL | 3.0 | 2.0 | 1272 | $2,200 | $1.73 | 18d | 1 | 0.44mi |
| 626 NW 2nd Ln Cape Coral, FL | 3.0 | 2.0 | 1272 | $2,200 | $1.73 | 25d | 1 | 0.44mi |
| 212 NW 1st St Cape Coral, FL | 3.0 | 2.0 | 1246 | $1,775 | $1.42 | 5d | 1 | 0.45mi |
| 701 SW Pine Island Rd Cape Coral, FL | 1.0–3.0 | 1.0–2.0 | 1138 | $1,579 | $1.39 | 3d | 11 | 0.46mi |
| 224 NW 2nd Pl Cape Coral, FL | 3.0 | 2.0 | 1733 | $2,750 | $1.59 | 25d | 1 | 0.51mi |
| 621 SW 3rd St Cape Coral, FL | 2.0 | 2.0 | 910 | $1,200 | $1.32 | 25d | 1 | 0.53mi |
| 419 SW 4th St Cape Coral, FL | 2.0 | 2.0 | 1168 | $1,695 | $1.45 | 18d | 1 | 0.54mi |
| 320 SW 3rd Pl Cape Coral, FL | 2.0 | 2.0 | 1008 | $1,495 | $1.48 | 25d | 1 | 0.55mi |
| 275 SW 4th St #220 Cape Coral, FL | 2.0 | 2.0 | 1156 | $1,475 | $1.28 | 5d | 1 | 0.59mi |
| 271 SW 4th St Unit 271 Cape Coral, FL | 3.0 | 2.0 | 1259 | $2,000 | $1.59 | 25d | 1 | 0.60mi |
| 149 Santa Barbara Blvd S Cape Coral, FL | 3.0 | 2.0 | 1250 | $1,520 | $1.22 | 25d | 1 | 0.64mi |
| 159 SE Santa Barbara Pl Cape Coral, FL | 3.0 | 2.0 | 1412 | $2,250 | $1.59 | 25d | 1 | 0.69mi |
| 134 SE 1st Ave Cape Coral, FL | 3.0 | 2.0 | 1680 | $2,331 | $1.39 | 5d | 1 | 0.71mi |
| 142 SE 1st Ave Cape Coral, FL | 3.0 | 2.0 | 1554 | $1,900 | $1.22 | 16d | 1 | 0.72mi |
| 713 SW 4th Ter Cape Coral, FL | 3.0 | 2.0 | 1756 | $2,085 | $1.19 | 4d | 1 | 0.72mi |
| 114 SE 3rd St Cape Coral, FL | 3.0 | 2.0 | 1747 | $2,000 | $1.14 | 25d | 1 | 0.80mi |
| 749 SW 5th Ter Cape Coral, FL | 3.0 | 2.0 | 1404 | $2,065 | $1.47 | 5d | 1 | 0.82mi |
| 229 Hancock Bridge Pkwy Cape Coral, FL | 2.0 | 2.0 | 1100 | $1,400 | $1.27 | 25d | 1 | 0.96mi |
| 604 Skyline Blvd Cape Coral, FL | 2.0 | 2.0 | 1121 | $1,550 | $1.38 | 5d | 1 | 0.99mi |
| 419 NW 7th Ter Cape Coral, FL | 3.0 | 2.0 | 1161 | $4,500 | $3.88 | 5d | 1 | 1.06mi |
| 114 NW 13th Ave Cape Coral, FL | 3.0 | 2.0 | 1422 | $2,000 | $1.41 | 16d | 1 | 1.06mi |
| 302 SE 3rd St Cape Coral, FL | 3.0 | 2.0 | 1404 | $2,055 | $1.46 | 4d | 1 | 1.06mi |
| 302 SE 3rd St Cape Coral, FL | 3.0 | 2.0 | 1404 | $2,240 | $1.60 | 23d | 1 | 1.06mi |
| 746 SW 8th Ter Unit 203 Cape Coral, FL | 2.0 | 2.0 | 1120 | $1,750 | $1.56 | 25d | 1 | 1.08mi |
| 910 SW 3rd Ave Cape Coral, FL | 3.0 | 2.0 | 1380 | $1,900 | $1.38 | 13d | 1 | 1.11mi |
| 318 NW 8th Ter Cape Coral, FL | 3.0 | 2.0 | 1500 | $1,900 | $1.27 | 5d | 1 | 1.15mi |
| 818 SW 8th Pl Cape Coral, FL | 3.0 | 2.0 | 1718 | $2,399 | $1.40 | 25d | 1 | 1.17mi |
| 1400 SW 1st Ter Cape Coral, FL | 3.0 | 2.0 | 1619 | $1,995 | $1.23 | 25d | 1 | 1.17mi |
| 639 NE Juanita Pl Cape Coral, FL | 3.0 | 2.0 | 1116 | $1,700 | $1.52 | 21d | 1 | 1.17mi |
| 633 SW 9th Ave Cape Coral, FL | 3.0 | 2.0 | 1720 | $2,191 | $1.27 | 5d | 1 | 1.18mi |
| 943 Skyline Blvd Cape Coral, FL | 3.0 | 2.0 | 1209 | $1,549 | $1.28 | 25d | 1 | 1.25mi |
| 817 SW 9th Ave Cape Coral, FL | 3.0 | 2.0 | 1420 | $1,880 | $1.32 | 5d | 1 | 1.29mi |
| 218 SE 8th St Cape Coral, FL | 3.0 | 2.0 | 1672 | $2,020 | $1.21 | 4d | 1 | 1.29mi |
| 910 NW 8th Ter Cape Coral, FL | 3.0 | 2.0 | 1619 | $2,100 | $1.30 | 18d | 1 | 1.29mi |
| 217 NW 9th St Cape Coral, FL | 3.0 | 2.0 | 1756 | $2,271 | $1.29 | 5d | 1 | 1.30mi |
| 525 SE Van Loon Ter Cape Coral, FL | 2.0 | 1.0 | 885 | $1,500 | $1.69 | 25d | 1 | 1.31mi |
| 527 Hancock Bridge Pkwy Cape Coral, FL | 2.0 | 2.0 | 1080 | $1,375 | $1.27 | 5d | 1 | 1.32mi |
| 376 Penley Lake Cir Cape Coral, FL | 1.0–3.0 | 1.0–2.0 | 1195 | $2,219 | $1.86 | 3d | 87 | 1.33mi |
Listing history 2 events
-
2026-05-18price $98,780
-
2026-05-08$120,000 Active
ⓘ Source: listings_history table (triggers on properties + properties_extension) + one-shot
backfill from property_details.listing_events for pre-trigger history.
Nearby sold comps map
Loading sold comps map…
Walkable amenities ~0.75 mi
Loading nearby amenities…
Taxation est. · year 1
- Rental income
- $22,491
- − Mortgage interest
- −$5,533
- − Property taxes
- −$1,482
- − Insurance
- −$494
- − Repairs & maintenance
- −$1,799
- − Management
- −$1,799
- − Depreciation
- −$2,874
- Taxable income
- $8,510
- Est. tax owed @ 24.0%
- −$2,042
- After-tax cash flow
- $7,533/yr
For passive investors: Depreciation is non-cash, so a rental often shows a tax loss while cash-flowing — sheltering income. Rental losses are passive: they offset passive income freely, and up to $25,000/yr can offset ordinary (W-2) income if you actively participate and your MAGI is under $100k (phasing out to $0 by $150k); unused losses carry forward. On sale, claimed depreciation is recaptured at up to 25%, and gains may owe capital-gains tax (a 1031 exchange can defer both). Figures are a year-1 estimate at your 24.0% rate — not tax advice; consult a CPA.
Condition & rehab AI · 12 photos
This remodeled manufactured home is in excellent condition with new finishes and systems, making it move-in ready and ideal for both resale and rental.
Value-add opportunities
- Both Painting exterior and interior — Enhances curb appeal and interior aesthetics
- Both Landscaping and curb appeal improvements — Improves curb appeal and enhances property value
- Both New outdoor lighting — Enhances safety and curb appeal
Renovation cost estimate screening
Value-add ROI direction
- Both Painting exterior and interior — Enhances curb appeal and interior aesthetics ↑
- Both Landscaping and curb appeal improvements — Improves curb appeal and enhances property value ↑
- Both New outdoor lighting — Enhances safety and curb appeal ↑
ⓘ Cost ranges are severity-bucket heuristics (US national rule-of-thumb). Get contractor quotes + a written scope before underwriting a rehab budget.
Schools (NCES district)
- District
- Lee
- NCES district ID
- 1201080
- Math proficiency
- 47% ▼ -11.00%
- Reading proficiency
- 50% ▼ -4.00%
- Median HH income
- $49,518
- Composite
- 41.49/100
- National rank
- #3458
- State rank
- #42 of 73 in FL
Livability — Cape Coral
- Score
- 77/100
- State rank
- #208
- US rank
- #3098
Category grades
Schools grade is shown separately in the Schools card above.
Census & demographics
- Census place
- Cape Coral, FL
- County
- Lee County · 788,662 people
- City population
- 217,388
- Metro
- Cape Coral-Fort Myers, FL
- Population (ZIP)
- 27,725
- Household income
- $84,470
- Rent vs Own
- Severe rent burden
- 760.0
Population outlook (Lee County) Hauer SSP2
- Today (2025)
- 871,946 people
- By 2030
- 955,468 · +9.6%
- By 2040
- 1,113,587 · +27.7%
- By 2050
- 1,256,891 · +44.1%
- By 2075
- 1,560,270 · +78.9%
- By 2100
- 1,726,848 · +98.0%
Race, ethnicity, and origin ACS 2023
- Neighborhood character
- Predominantly White (71%)
- Race & ethnicity
- White 71% Hispanic / Latino 20% Two or more races 14% Black 3% Asian 1%
- Hispanic origin (detail)
- Mexican 1% Puerto Rican 6% Cuban 6%
- Common ancestry
- Romanian 5% Lithuanian 3% Italian 3%
- Foreign-born
- 13% · Canada, Jamaica
- Languages at home
- 81% English-only · Spanish 15% Russian/Polish/Slavic 1% Tagalog/Filipino 1%
Political lean MEDSL · Lee
- 2024 margin
- Strong R (+28.4) · D 35.5% · R 63.9%
- 2008→2024 swing
- -18.0pp toward R · 2008: -10.4pp · 2024: -28.4pp
- All cycles
- 2024: R+28.4 2020: R+19.2 2016: R+20.4 2012: R+16.6 2008: R+10.4
Not yet ingested
- Civics
- —
Market trends
- HPI YoY
- ▼ -108.25%
- Current HPI
- 281.0735
- Rent YoY
- ▼ -8.55%
- Metro
- Cape Coral-Fort Myers, FL
- State GDP YoY
- ▲ 3.28%
- F500 in state
- 36
Industry mix (Fortune 500 HQ in FL)
| Industry | F500 HQs | Revenue |
|---|---|---|
| Industrial Technology | 2 | $29B |
|
||
| Insurance | 2 | $17B |
|
||
| Retail | 1 | $60B |
|
||
| Technology Distribution | 1 | $58B |
|
||
| Homebuilding | 1 | $35B |
|
||
| Technology Manufacturing | 1 | $35B |
|
||
Price history
-17.7% since first listed2 events — show timeline
- 2026-05-18 Price Changed $98,780 FORTMLS
- 2026-05-08 Listed $120,000 FORTMLS
Cash-flow waterfall
monthlySold comps — $/sqft
last 12 mo · ≤1 miLoading sold comps…