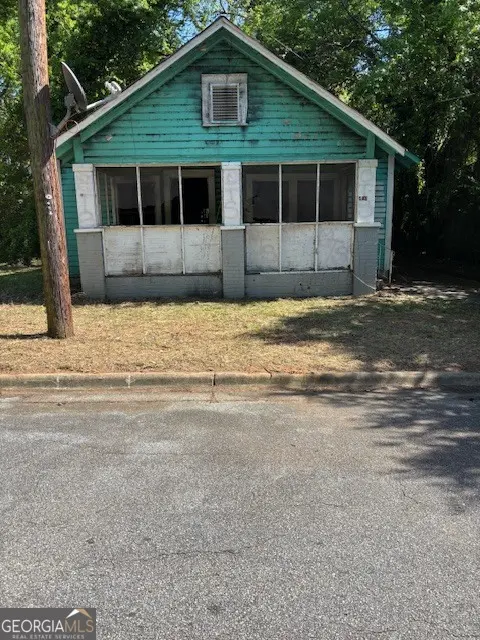
823 Peachtree St · Macon-Bibb County, GA
Flood risk 1/10 · Minimal
- FEMA flood zone
- X (unshaded)
- Chance of flooding over 30 yrs
- 0.0%
- Est. flood insurance / yr
- $507 – $1,088
Fire risk 3/10 · Minor
- Est. fire insurance / yr
- $963 – $1,789
Heat risk 7/10 · Major
- Hot days now (above 108°F)
- 7 days/yr
- Hot days in 30 yrs
- 17 days/yr
Wind risk 6/10 · Moderate
- Chance of severe wind over 30 yrs
- 65.0%
Air-quality risk 4/10 · Minor
- Unhealthy air days now
- 5 days/yr
- Unhealthy air days in 30 yrs
- 5 days/yr
Risk factors via First Street. Map © Google.
Why this score? — see what drove the A- grade
The composite is a weighted blend of 9 inputs, each scored 0–100. Each bar is that input's sub-score; the figure is the points it added to the 100-point composite (weight × sub-score).
- Cash flow +30.0/30.0
- ARV discount +15.0/15.0
- 1% rule +10.0/10.0
- DSCR +10.0/10.0
- Appreciation +7.2/10.0
- Rent growth +5.0/5.0
- Livability +2.5/5.0
- Condition / age +2.5/5.0
- Schools +1.2/10.0
$29,000
🖨 Deal sheet (PDF) 📄 Offer letter ✓ Due diligence
Listing remarks MLS
Two residential structures on one lot. Investors, this is an opportunity to invest in a location with quick and easy access to I-75, I-16, major employers, downtown Macon, eateries and schools. These two properties awaits your special touches after making the repairs and renovations. CALL TODAY!
Key facts
- Downtown macon
- Eateries
- Quick access to i-16
Tags
Property features AI
Finance
- Other: Located in Shurling Cross Keys subdivision, Macon, GA 31217
- HOA & community: No HOA
Exterior
- Parking: Off-street parking
- Utilities: Public water; Public sewer; No other utilities listed
- Home design: Single family residence (house); Resale property; Built in 1900
- Construction: Wood siding exterior; Composition roof; Block and pillar/post/pier foundation
- Exterior features: City lot
Interior
- Kitchen: No appliances listed
- Bedrooms: 3 bedrooms on the main level
- Flooring: Other
- Bathrooms: 1 full bathroom on the main level
- Heating & cooling: No heating; No cooling
- Interior features: One-level home; Crawl space basement; No fireplaces; Other flooring
- Laundry & utility: No laundry features listed
Neighborhood map
What this means for you Summary
Snapshot
- This is a 3-bed/1.0-bath single-family listed at $29k.
Deal economics
- At list price, monthly cash flow is $660 ($8k/yr) — positive.
- The deal already cash-flows at list — no discount required.
- Meets the 1% rule at list price ($1k rent vs $29k).
- Recommended offer: $28k (3.0% below list) — sets the bar for market timing.
- Cap rate 33.6% vs local median 5.5% in Macon-Bibb County — top-decile yield for the area; either an underpriced asset or a hidden risk that comps aren't pricing in. Stress-test before assuming the spread holds.
Location & tenants
- Location reads: area grade A — affects rentability + tenant quality, not the cash-flow math above.
- Bibb County (urban): math 11% / reading 18% proficiency, ranked #161 of 174 in GA (top 92%) — low school quality limits family demand, transient renter base, plan for 1-2y turnover; 75% free/reduced lunch — lower-income household profile, screen leases tightly.
- Zoned schools: Burdell Elementary School (math 12% / reading 17%, grade F, #996 of 1,228 statewide, top 83%, 442 students, 100% FRL); Appling Middle School (math 7% / reading 14%, grade F, #429 of 470 statewide, top 91%, 648 students, 100% FRL); Northeast High School (math 2% / reading 5%, grade F, #413 of 424 statewide, top 99%, 742 students, 100% FRL) — zoned schools average 100% FRL vs 75% district-wide (25 pts higher); higher-poverty schools than district average — tighter screening recommended.
- Market conditions: Rents rising fast (+10.8%/yr); 124 active listings in the ZIP; 27 comparable units currently listed for rent nearby; rentals at typical pace (median 23d on market — plan ~3-4 weeks tenant-placement turnaround); 44% of comp listings sitting > 30 days — soft ceiling on asking rent; lower-income renter base — watch delinquency; 154 units permitted in Bibb County in 2024 (0 in 5+ unit buildings).
Forward outlook
- In year one you build about $1k of equity ($200 loan paydown + $1k appreciation (4.3% local appreciation)).
- Bibb County population projected at -12% by 2050 — secular population decline; favor cash flow + early exit over multi-decade hold.
- At projected returns (4.3% appreciation + 8.0% rent growth), your $8k cash investment doubles in ~1 year — after that, you're playing with house money.
Negotiation context
- It's been on market 56 days — a 3% lower offer ($28k) is reasonable based on typical stale-listing flexibility.
- 5 sale attempts with the ask held roughly flat each time — persistent listings suggest the price (not the market) is what's stuck; bring a comps-based counter.
- Current owner paid $18k; list at $29k implies a 66% gain — meaningful room to come down on a strong offer.
Risks & watch-outs
- Watch-outs: built in 1900 — expect roof / HVAC / electrical / plumbing capex.
- Climate carrying-cost: major wind risk, 65% chance of damaging wind over 30y; extreme-heat days projected 7→17/yr by 2055 (HVAC capex compounding) — expect insurance premiums to compound above CPI over the hold.
Questions for the listing agent
- It's been on market 56 days. Have you received any prior offers? Is the seller open to a 3% concession, seller financing, or rate buy-down credit?
- Built in 1900 — when were the roof, HVAC, electrical panel, plumbing, and water heater last replaced?
- Is there a deadline driving the sale (1031 exchange, divorce, estate, relocation)? That informs how much negotiation room exists.
- What's the average days-on-market for RENTAL listings here right now (not sales)? A rising rental-DOM trend means longer vacancies and softer asking-rent achievability than the comps imply.
- What's the recent tenant-quality profile in this submarket — average credit score on applications, eviction rate, late-payment / NSF rate, and stable-employment percentage? A property-management company in the area should have these aggregated.
- How much new for-sale + rental construction is in the pipeline within 1–3 miles? Heavy new supply typically softens prices + rents 12–24 months out; constrained supply supports both.
Investment metrics
- 1% rule
- 3.84% ✓
- Cap rate
- 33.61%
- Cash-on-cash
- 97.57%
- DSCR
- 5.34
- GRM
- 2.2
CMA / ARV
- ARV (median comp)
- $50,885
- List price
- $29,000
- Delta
- -43.01%
- Verdict
- UNDERPRICED
- Comps
- 20 within 1.0 mi
Show comp detail 7 sales within ~0.75 mi
| Address | Dist | Beds/Ba | Sqft | Sold | Price | $/sf | Match |
|---|---|---|---|---|---|---|---|
| 261 Balkcom Ave | 0.10mi | 3/1.0 | 1,006 (-9%) | 1mo | $80,300 | $80 | 80 |
| 823 Applewood St | 0.06mi | 3/1.0 | 1,219 (+10%) | 5mo | $52,500 | $43 | 75 |
| 260 Balkcom Ave | 0.12mi | 3/2.0 | 1,180 (+7%) | 10mo | $97,000 | $82 | 70 |
| 575 Cowan St | 0.55mi | 3/2.0 | 1,208 (+9%) | 10mo | $68,900 | $57 | 46 |
| 1244 Hall St | 0.69mi | 2/1.0 (-1) | 988 (-10%) | 3mo | $19,000 | $19 | 43 |
| 1010 Maynard St | 0.69mi | 3/2.0 | 1,254 (+14%) | 12mo | $140,000 | $112 | 31 |
| 1041 Hall St | 0.59mi | 4/2.0 (+1) | 1,232 (+12%) | 20mo | $50,000 | $41 | 27 |
Match score weights: distance 35% · size 25% · config 20% · recency 20%. Top-matched comps best support the ARV.
Projected returns pro-forma
4.31% appreciation · 8.0% rent growth · sell at horizon
- IRR
- —
- Equity multiple
- 7.59×
- Total profit
- $53,528
- Equity at exit
- $15,236
- IRR
- —
- Equity multiple
- 18.27×
- Total profit
- $140,234
- Equity at exit
- $25,353
Cash invested: $8,120 (down + closing). Projections, not guarantees.
Landlord ↔ Tenant lean methodology
- Overall (STATE)
- 90 Strongly Landlord-Friendly
- State Georgia
- 90 Strongly Landlord-Friendly · R+3
- County
- — inherits STATE
- City
- — inherits STATE
ZIP-level market 31217
- Home prices YoY
- 2.1%
- Rents YoY
- 10.8%
- Active inventory
- 124
- Price-to-rent
- 2.2×
Monthly cashflow live
- Estimated rent
- $1,115 high interval (Pro) →
- Mortgage (P&I)
- −$152
- Tax from tax record
- −$56 /mo · $676/yr
- Insurance
- −$12
- HOA
- −$0
- Vacancy / Maint / Mgmt
- −$234
- Net cashflow
- $660
Break-even live
Sensitivity live
| Price | -10% $677 | -5% $668 | +0% $660 | +5% $652 | +10% $644 |
|---|---|---|---|---|---|
| Rent | -10% $572 | -5% $616 | +0% $660 | +5% $704 | +10% $748 |
| Rate | -1.0pp $675 | -0.5pp $668 | base $660 | +0.5pp $653 | +1.0pp $645 |
UW: 25.0% down · 7.5% · 30yr · 1.5% tax · 5.0% vac · 8.0% maint · 8.0% mgmt
Financing live
Cash to close
- Down payment
- $7,250
- Closing costs
- $870
- Reserves months
- —
- Total cash needed
- —
Loan-product check · same deal, 3 products live
Conventional
25% down · 7.5% · 30yr
- Down + closing
- —
- Monthly P&I
- —
- Monthly cashflow
- —
- DSCR
- —
- Eligible?
- —
Personal DTI + credit; lowest rate.
DSCR
20% down · 8.5% · 30yr
- Down + closing
- —
- Monthly P&I
- —
- Monthly cashflow
- —
- DSCR
- —
- Eligible?
- —
No personal income docs; deal must DSCR.
Hard money
10% down · 12.0% · 12mo
- Down + closing
- —
- Monthly P&I
- —
- Monthly cashflow
- —
- DSCR
- —
- Eligible?
- —
Short-term bridge; refi at stabilization.
Rent comps 27 comps
| Address | Beds | Baths | Sqft | Rent | $/sqft | DOM | Units | Dist |
|---|---|---|---|---|---|---|---|---|
| 892 Applewood St Macon, GA | 4.0 | 2.0 | 1250 | $850 | $0.68 | 45d | 1 | 0.06mi |
| 1143 Woolfolk St Unit 3 Macon, GA | 2.0 | 1.0 | 900 | $800 | $0.89 | 45d | 1 | 0.47mi |
| 1233 Woolfolk Ter Macon, GA | 2.0 | 1.0 | 740 | $750 | $1.01 | 15d | 1 | 0.54mi |
| 390 Cowan St Unit 394 Macon, GA | 2.0 | 1.5 | 1166 | $900 | $0.77 | 22d | 1 | 0.68mi |
| 382 Cowan St Macon, GA | 2.0 | 1.5 | 1166 | $900 | $0.77 | 45d | 1 | 0.69mi |
| 378 Cowan St Unit 382 Macon, GA | 2.0 | 1.5 | 1166 | $900 | $0.77 | 22d | 1 | 0.70mi |
| 854 Trinity Pl Macon, GA | 2.0 | 1.0 | 1260 | $875 | $0.69 | 45d | 1 | 0.74mi |
| 720 Baker St Macon, GA | 2.0 | 1.0 | 1020 | $900 | $0.88 | 46d | 1 | 0.76mi |
| 1224 Appling Ct Apt B Macon, GA | 2.0 | 1.0 | 1000 | $925 | $0.93 | 22d | 1 | 0.95mi |
| 853 North Ave Macon, GA | 2.0 | 1.5 | 950 | $865 | $0.91 | 45d | 1 | 0.98mi |
| 1161 Boulevard Macon, GA | 2.0 | 1.5 | 1050 | $1,300 | $1.24 | 15d | 1 | 1.11mi |
| 1143 Sunnydale Dr Macon, GA | 3.0 | 1.0 | 1053 | $975 | $0.93 | 45d | 1 | 1.12mi |
| 370 Cherry St Macon, GA | 2.0 | 2.0 | 1500 | $1,400 | $0.93 | 45d | 1 | 1.13mi |
| 462 Cherry St Macon, GA | 2.0 | 1.0–2.0 | 988 | $3,000 | $3.03 | 15d | 25 | 1.16mi |
| 1126 Boulevard Macon, GA | 4.0 | 1.5 | 1228 | $1,260 | $1.03 | 22d | 1 | 1.17mi |
| 1069 Boulevard Macon, GA | 2.0 | 1.0 | 832 | $900 | $1.08 | 15d | 1 | 1.19mi |
| 476 3rd St Macon, GA | 2.0 | 1.0 | 942 | $1,850 | $1.96 | 15d | 8 | 1.23mi |
| 470 Poplar St Unit 202 Macon, GA | 2.0 | 2.0 | 1000 | $1,425 | $1.43 | 45d | 1 | 1.27mi |
| 482 Poplar St Macon, GA | 1.0–2.0 | 1.0–2.0 | 850 | $1,425 | $1.68 | 22d | 4 | 1.28mi |
| 955 Walnut St Unit B Macon, GA | 2.0 | 1.0 | 840 | $1,075 | $1.28 | 45d | 1 | 1.29mi |
| 484 1st St #300 Macon, GA | 2.0 | 1.0 | 1400 | $1,625 | $1.16 | 15d | 1 | 1.33mi |
| 941 Hill Park Unit 2 Macon, GA | 2.0 | 1.0 | 800 | $850 | $1.06 | 22d | 1 | 1.33mi |
| 384 Spring St Unit 1 Macon, GA | 3.0 | 2.0 | 1200 | $1,250 | $1.04 | 45d | 1 | 1.38mi |
| 952 Georgia Ave Macon, GA | 2.0 | 2.0 | 1115 | $1,295 | $1.16 | 45d | 1 | 1.41mi |
| 952 Georgia Ave Unit 3 Macon, GA | 2.0 | 1.0 | 900 | $950 | $1.06 | 15d | 1 | 1.42mi |
| 147 Orange St Macon, GA | 3.0 | 2.0 | 1500 | $1,695 | $1.13 | 15d | 1 | 1.47mi |
| 218 Orange St Macon, GA | 2.0 | 1.0 | 1100 | $1,300 | $1.18 | 22d | 1 | 1.47mi |
Listing history 32 events
-
2026-06-21days on market $29,000 Active 56 DOM
-
2026-06-19days on market $29,000 Active 54 DOM
-
2026-06-18days on market $29,000 Active 53 DOM
-
2026-06-17days on market $29,000 Active 52 DOM
-
2026-06-16days on market $29,000 Active 51 DOM
-
2026-06-15days on market $29,000 Active 50 DOM
-
2026-06-14days on market $29,000 Active 48 DOM
-
2026-06-13days on market $29,000 Active 47 DOM
-
2026-06-10days on market $29,000 Active 45 DOM
-
2026-06-09days on market $29,000 Active 44 DOM
-
2026-06-09days on market $29,000 Active 43 DOM
-
2026-06-07days on market $29,000 Active 42 DOM
-
2026-06-03days on market $29,000 Active 38 DOM
-
2026-06-02days on market $29,000 Active 37 DOM
-
2026-06-01days on market $29,000 Active 36 DOM
-
2026-05-31days on market $29,000 Active 35 DOM
-
2026-05-30days on market $29,000 Active 34 DOM
-
2026-04-28$29,000 Active 296-char remark
Show marketing remark (296 chars)
Two residential structures on one lot. Investors, this is an opportunity to invest in a location with quick and easy access to I-75, I-16, major employers, downtown Macon, eateries and schools. These two properties awaits your special touches after making the repairs and renovations. CALL TODAY!
-
2026-04-25$29,000 New 299-char remark
-
2025-05-03status Pending
-
2025-05-02historical Active Under Contract
-
2025-05-02soldstatus $17,500 Closed
-
2025-05-02soldstatus $17,500 Sold
-
2025-04-22status Pending
-
2025-04-16status Under Contract
-
2025-04-16historical Active Under Contract
-
2025-03-13price $19,950
-
2025-03-13price $19,950
-
2025-01-30$25,000 Active
-
2025-01-30$25,000 New
-
2004-11-24soldstatus $39,308
-
2001-08-10soldstatus $19,000
ⓘ Source: listings_history table (triggers on properties + properties_extension) + one-shot
backfill from property_details.listing_events for pre-trigger history.
Tax reassessment forecast GA · Resets to sale price
- Current annual tax
- $676 · $56/mo
- Projected year-2 tax
- $676 · $56/mo
- Expected delta
- $0/yr ($0/mo · 0.0%)
ⓘ Screening estimate from a state-policy table — verify with the county assessor before closing.
Climate risk First Street
- Flood 1/10 Low FEMA zone X (unshaded) · 0% chance over 30 yrs
- Wildfire 3/10 Moderate
- Heat 7/10 Severe 7 d/yr ≥108°F today · 17 d/yr by 30 yrs out
- Wind 6/10 Major 65% chance of damaging wind over 30 yrs
- Air quality 4/10 Moderate 5 unhealthy d/yr today · 5 by 30 yrs out
Nearby sold comps map
Loading sold comps map…
Walkable amenities ~0.75 mi
Loading nearby amenities…
Taxation est. · year 1
- Rental income
- $13,378
- − Mortgage interest
- −$1,624
- − Property taxes
- −$676
- − Insurance
- −$145
- − Repairs & maintenance
- −$1,070
- − Management
- −$1,070
- − Depreciation
- −$844
- Taxable income
- $7,948
- Est. tax owed @ 24.0%
- −$1,908
- After-tax cash flow
- $6,015/yr
For passive investors: Depreciation is non-cash, so a rental often shows a tax loss while cash-flowing — sheltering income. Rental losses are passive: they offset passive income freely, and up to $25,000/yr can offset ordinary (W-2) income if you actively participate and your MAGI is under $100k (phasing out to $0 by $150k); unused losses carry forward. On sale, claimed depreciation is recaptured at up to 25%, and gains may owe capital-gains tax (a 1031 exchange can defer both). Figures are a year-1 estimate at your 24.0% rate — not tax advice; consult a CPA.
Schools (NCES district)
- District
- Bibb County
- NCES district ID
- 1300420
- Math proficiency
- 11% ▼ -14.00%
- Reading proficiency
- 18% ▼ -11.00%
- Median HH income
- $37,426
- Composite
- 12.13/100
- National rank
- #9654
- State rank
- #161 of 174 in GA
Livability — Macon-Bibb County
No livability data for this city. (Only ~50 U.S. cities are tracked.)
Census & demographics
- Census place
- Macon-Bibb County, GA
- County
- Bibb County · 164,332 people
- City population
- 143,186
- Metro
- Macon-Bibb County, GA
- Population (ZIP)
- 17,732
- Household income
- $44,809
- Rent vs Own
- Severe rent burden
- 391.0
Population outlook (Bibb County) Hauer SSP2
- Today (2025)
- 148,772 people
- By 2030
- 145,904 · -1.9%
- By 2040
- 139,404 · -6.3%
- By 2050
- 131,603 · -11.5%
- By 2075
- 111,050 · -25.4%
- By 2100
- 83,346 · -44.0%
Race, ethnicity, and origin ACS 2023
- Neighborhood character
- Majority Black (57%)
- Race & ethnicity
- Black 57% White 38% Two or more races 4% Hispanic / Latino 2%
- Common ancestry
- Slovak 1% Italian 1%
- Foreign-born
- 1% · Canada
- Languages at home
- 98% English-only · Spanish 1%
Political lean MEDSL · Bibb
- 2024 margin
- Strong D (+22.4) · D 61.0% · R 38.5%
- 2008→2024 swing
- +4.4pp toward D · 2008: 18.0pp · 2024: 22.4pp
- All cycles
- 2024: D+22.4 2020: D+23.8 2016: D+20.2 2012: D+20.0 2008: D+18.0
Not yet ingested
- Civics
- —
Market trends
- HPI YoY
- ▲ 4.31%
- Current HPI
- 209.9166
- Rent YoY
- ▲ 10.85%
- Metro
- Macon-Bibb County, GA
- State GDP YoY
- ▲ 2.66%
- F500 in state
- 28
Industry mix (Fortune 500 HQ in GA)
| Industry | F500 HQs | Revenue |
|---|---|---|
| Paper / Packaging | 2 | $29B |
|
||
| Retail | 1 | $160B |
|
||
| Transportation / Logistics | 1 | $91B |
|
||
| Airlines | 1 | $62B |
|
||
| Consumer Goods | 1 | $47B |
|
||
| Utilities | 1 | $25B |
|
||
Price history
+52.6% since first listed16 events — show timeline
- 2026-04-28 Listed $29,000 CGMLS
- 2026-04-28 Listed $29,000 MGMLS
- 2026-04-25 Listed $29,000 GAMLS
- 2025-05-03 Pending — FMLS
- 2025-05-02 Contingent — FMLS
- 2025-05-02 Sold (MLS) $17,500 GAMLS
- 2025-05-02 Sold (MLS) $17,500 FMLS
- 2025-04-22 Pending — FMLS
- 2025-04-16 Pending — GAMLS
- 2025-04-16 Contingent — FMLS
- 2025-03-13 Price Changed $19,950 FMLS
- 2025-03-13 Price Changed $19,950 GAMLS
- 2025-01-30 Listed $25,000 GAMLS
- 2025-01-30 Listed $25,000 FMLS
- 2004-11-24 Sold (Public Records) $39,308 Public Records
- 2001-08-10 Sold (Public Records) $19,000 Public Records
Property tax history
+16.7%/yrLatest (2025): $676 · +21.1% YoY. Source: county tax records.
Cash-flow waterfall
monthlySold comps — $/sqft
last 12 mo · ≤1 miLoading sold comps…