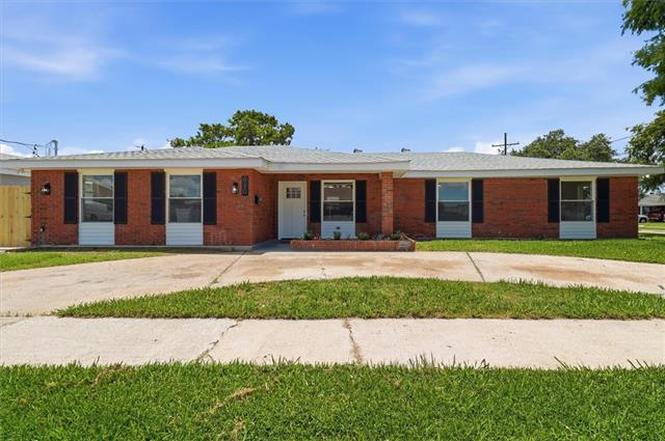
930 Cedre Dr · Westwego, LA
Flood risk No data
- FEMA flood zone
- —
- Chance of flooding over 30 yrs
- —
- Est. flood insurance / yr
- —
Fire risk No data
- Est. fire insurance / yr
- —
Heat risk No data
- Hot days now (above threshold)
- —
- Hot days in 30 yrs
- —
Wind risk No data
- Chance of severe wind over 30 yrs
- —
Air-quality risk No data
- Unhealthy air days now
- —
- Unhealthy air days in 30 yrs
- —
Risk factors via First Street. Map © Google.
Why this score? — see what drove the D- grade
The composite is a weighted blend of 9 inputs, each scored 0–100. Each bar is that input's sub-score; the figure is the points it added to the 100-point composite (weight × sub-score).
- Cash flow +16.6/30.0
- DSCR +5.2/10.0
- 1% rule +3.5/10.0
- Livability +3.4/5.0
- Schools +2.5/10.0
- Condition / age +2.5/5.0
- Rent growth +2.3/5.0
- ARV discount +0.0/15.0
- Appreciation +0.0/10.0
$259,000
🖨 Deal sheet (PDF) 📄 Offer letter ✓ Due diligence
Listing remarks MLS
For the first time in years, a fully renovated home is available in this highly sought-after Westwego subdivision! Situated on a desirable corner lot in a quiet, established neighborhood, this property has been completely transformed from top to bottom with virtually everything brand new. Enjoy peace of mind with a new roof, HVAC system, windows, plumbing, electrical wiring and panel, along with countless other upgrades throughout the home. Inside, you'll find a spacious open-concept layout that still maintains a defined formal dining room, creating the perfect balance of modern living and functional space. The stunning kitchen features quartz countertops, stainless steel appliances, and ample workspace for cooking and entertaining. Beautiful laminate flooring runs throughout the home, while the bathrooms showcase custom tile work and designer finishes. Outside, the detached garage offers additional storage space in the rear half, and the rear yard access provides plenty of room for boats, trailers, or additional parking. With quality renovations, thoughtful design, and a location that's hard to beat, this is a rare opportunity to own a truly move-in-ready home in one of the area's most desirable neighborhoods! Owner/Agent
Key facts
- New plumbing
- Fully renovated home
- Corner lot
Tags
Property features AI
Exterior
- Parking: Garage; Off-street parking
- Security: Smoke detector(s)
- Utilities: Public water; Public sewer
- Home design: Single-story; Excellent condition
- Construction: Brick construction; Shingle roof; Slab foundation; Built with excellent maintenance/condition
- Exterior features: Concrete patio/porch; Corner lot; City lot; Rectangular lot
Interior
- Kitchen: Dishwasher; Microwave; Oven; Range
- Bathrooms: 2 full bathrooms
- Heating & cooling: Central heating; Central air conditioning
- Interior features: Ceiling fan(s); Carbon monoxide detector; Pantry; Stone counters; Stainless steel appliances
- Laundry & utility: Washer hookup; Dryer hookup
Neighborhood map
What this means for you Summary
Snapshot
- This is a 4-bed/2.0-bath single-family listed at $259k.
Deal economics
- At list price, monthly cash flow is $158 ($2k/yr) — positive.
- The deal already cash-flows at list — no discount required.
- To meet the 1% rule (rent ≥ 1% of price), the offer needs to be $219k (15.3% below list).
- Recommended offer: $219k (15.3% below list) — sets the bar for 1% rule.
Location & tenants
- Location reads 68/100 on livability (#97 in LA) — a middle-class / working-renter tenant base. Strengths: cost of living A+, health & safety A+; Watch: crime D, amenities D-, commute F.
- Jefferson Parish (suburban): math 24% / reading 34% proficiency, ranked #44 of 98 in LA (top 45%) — low school quality limits family demand, transient renter base, plan for 1-2y turnover; 70% free/reduced lunch — lower-income household profile, screen leases tightly.
- Zoned schools: Isaac G Joseph Elementary School (math 12% / reading 16%, grade F, #534 of 646 statewide, top 83%, 531 students, 81% FRL); Stella Worley Middle School (math 7% / reading 19%, grade F, #189 of 218 statewide, top 87%, 470 students, 80% FRL); L.W. Higgins High School (math 14% / reading 25%, grade F, #186 of 265 statewide, top 73%, 996 students, 70% FRL).
- Zoned-school proficiency averages 16% at this address vs 29% district-wide (-14 pts) — the specific schools serving this property underperform the Jefferson Parish average; the district grade overstates school quality for this exact location.
- Market conditions: Rents soft (-0.8%/yr); 188 active listings in the ZIP; 11 comparable units currently listed for rent nearby; rentals at typical pace (median 26d on market — plan ~3-4 weeks tenant-placement turnaround); 518 units permitted in Jefferson Parish in 2024 (43 in 5+ unit buildings).
- At $2,194/mo this rent would consume 49% of the median local household income ($54k/yr) (locally 1457% of renters already pay >50% of income on rent) — very limited rent-growth headroom before tenants either downsize or default.
Forward outlook
- Local home prices are declining (-3.0%/yr); year-one equity from $2k of loan paydown is wiped out by about $8k of value loss. Plan a longer hold.
Negotiation context
- Only 10 days on market — expect competitive offers; lowballing is unlikely to land.
- 2 sale attempts with the ask held roughly flat each time — persistent listings suggest the price (not the market) is what's stuck; bring a comps-based counter.
- Current owner paid $85k; list at $259k implies a 205% gain — meaningful room to come down on a strong offer.
Questions for the listing agent
- Built in 1972 — when were the roof, HVAC, electrical panel, plumbing, and water heater last replaced?
- Is there a deadline driving the sale (1031 exchange, divorce, estate, relocation)? That informs how much negotiation room exists.
- Crime grade is D in this area — have there been break-ins, vandalism, or insurance claims at this property in the last 3 years? What carrier currently insures it and at what premium?
- The area grade is low — what's the realistic commute time and amenity access for the typical tenant pool here? Any planned neighborhood developments (good or bad) we should know about?
- What's the average days-on-market for RENTAL listings here right now (not sales)? A rising rental-DOM trend means longer vacancies and softer asking-rent achievability than the comps imply.
- What's the recent tenant-quality profile in this submarket — average credit score on applications, eviction rate, late-payment / NSF rate, and stable-employment percentage? A property-management company in the area should have these aggregated.
- How much new for-sale + rental construction is in the pipeline within 1–3 miles? Heavy new supply typically softens prices + rents 12–24 months out; constrained supply supports both.
Investment metrics
- 1% rule
- 0.85% ✗
- Cap rate
- 7.03%
- Cash-on-cash
- 2.61%
- DSCR
- 1.12
- GRM
- 9.8
CMA / ARV
- ARV (on-the-fly)
- $193,024
- Comps found
- 11
Show comp detail 11 sales within ~0.75 mi
| Address | Dist | Beds/Ba | Sqft | Sold | Price | $/sf | Match |
|---|---|---|---|---|---|---|---|
| 927 Cedre Dr | 0.02mi | 3/2.0 (-1) | 1,801 (-3%) | 18mo | $187,000 | $104 | 74 |
| 718 West Dr | 0.35mi | 4/2.0 | 1,827 (-2%) | 10mo | $275,000 | $151 | 73 |
| 440 Klein St | 0.39mi | 4/2.0 | 1,835 (-1%) | 21mo | $220,000 | $120 | 63 |
| 725 Chipley St | 0.52mi | 5/2.0 (+1) | 1,828 (-2%) | 10mo | $153,000 | $84 | 60 |
| 855 1/2 Avenue D Ave | 0.43mi | 3/2.0 (-1) | 1,947 (+5%) | 18mo | $145,000 | $74 | 52 |
| 801 Central Ave | 0.46mi | 4/2.0 | 1,741 (-6%) | 21mo | $233,000 | $134 | 51 |
| 714 West Dr | 0.34mi | 3/1.0 (-1) | 1,600 (-14%) | 3mo | $55,000 | $34 | 50 |
| 533 Chipley St | 0.39mi | 3/2.5 (-1) | 2,020 (+9%) | 15mo | $240,000 | $119 | 47 |
| 628 Keller Ave | 0.38mi | 3/2.0 (-1) | 1,700 (-8%) | 22mo | $235,000 | $138 | 45 |
| 802 Avenue B Ave | 0.57mi | 4/2.0 | 1,700 (-8%) | 22mo | $175,000 | $103 | 41 |
| 875 Avenue D | 0.58mi | 4/2.0 | 2,099 (+13%) | 13mo | $170,000 | $81 | 40 |
Match score weights: distance 35% · size 25% · config 20% · recency 20%. Top-matched comps best support the ARV.
Projected returns pro-forma
-3.0% appreciation · 0.0% rent growth · sell at horizon
- IRR
- -15.3%
- Equity multiple
- 0.47×
- Total profit
- $-38,432
- Equity at exit
- $38,618
- IRR
- -12.1%
- Equity multiple
- 0.37×
- Total profit
- $-45,752
- Equity at exit
- $22,394
Cash invested: $72,520 (down + closing). Projections, not guarantees.
Landlord ↔ Tenant lean methodology
- Overall (STATE)
- 90 Strongly Landlord-Friendly
- State Louisiana
- 90 Strongly Landlord-Friendly · R+12
- County
- — inherits STATE
- City
- — inherits STATE
ZIP-level market 70094
- Rents YoY
- -0.8%
- Active inventory
- 188
- Price-to-rent
- 9.8×
Monthly cashflow live
- Estimated rent
- $2,194 high interval (Pro) →
- Mortgage (P&I)
- −$1,358
- Tax from tax record
- −$109 /mo · $1,306/yr
- Insurance
- −$108
- HOA
- −$0
- Vacancy / Maint / Mgmt
- −$461
- Net cashflow
- $158
Break-even live
Sensitivity live
| Price | -10% $305 | -5% $231 | +0% $158 | +5% $85 | +10% $11 |
|---|---|---|---|---|---|
| Rent | -10% $-15 | -5% $71 | +0% $158 | +5% $245 | +10% $331 |
| Rate | -1.0pp $288 | -0.5pp $224 | base $158 | +0.5pp $91 | +1.0pp $23 |
UW: 25.0% down · 7.5% · 30yr · 1.5% tax · 5.0% vac · 8.0% maint · 8.0% mgmt
Financing live
Cash to close
- Down payment
- $64,750
- Closing costs
- $7,770
- Reserves months
- —
- Total cash needed
- —
Loan-product check · same deal, 3 products live
Conventional
25% down · 7.5% · 30yr
- Down + closing
- —
- Monthly P&I
- —
- Monthly cashflow
- —
- DSCR
- —
- Eligible?
- —
Personal DTI + credit; lowest rate.
DSCR
20% down · 8.5% · 30yr
- Down + closing
- —
- Monthly P&I
- —
- Monthly cashflow
- —
- DSCR
- —
- Eligible?
- —
No personal income docs; deal must DSCR.
Hard money
10% down · 12.0% · 12mo
- Down + closing
- —
- Monthly P&I
- —
- Monthly cashflow
- —
- DSCR
- —
- Eligible?
- —
Short-term bridge; refi at stabilization.
Rent comps 11 comps
| Address | Beds | Baths | Sqft | Rent | $/sqft | DOM | Units | Dist |
|---|---|---|---|---|---|---|---|---|
| 181 Louisiana St Westwego, LA | 4.0 | 2.0 | 1500 | $1,550 | $1.03 | 45d | 1 | 0.68mi |
| 525 Emile Ave Westwego, LA | 3.0 | 2.0 | 1329 | $800 | $0.60 | 25d | 1 | 0.74mi |
| 7804 Britt St Westwego, LA | 5.0 | 2.0 | 1512 | $1,800 | $1.19 | 45d | 1 | 0.84mi |
| 1233 Central Ave Westwego, LA | 3.0 | 1.5 | 1357 | $1,500 | $1.11 | 25d | 1 | 0.97mi |
| 653 Vic a Pitre Dr Westwego, LA | 3.0 | 2.0 | 1491 | $2,200 | $1.48 | 6d | 1 | 0.98mi |
| 1226 Kenny Dr Westwego, LA | 4.0 | 2.0 | 1300 | $1,650 | $1.27 | 25d | 1 | 1.09mi |
| 1029 Joyce St Marrero, LA | 3.0 | 2.0 | 1300 | $1,650 | $1.27 | 16d | 1 | 1.10mi |
| 6035 Tchoupitoulas St New Orleans, LA | 3.0 | 2.0 | 2592 | $3,750 | $1.45 | 25d | 1 | 1.12mi |
| 617 Henry Clay Ave New Orleans, LA | 3.0 | 2.0 | 2000 | $3,200 | $1.60 | 5d | 1 | 1.29mi |
| 735 State St Unit D New Orleans, LA | 3.0 | 2.0 | 1225 | $2,800 | $2.29 | 25d | 1 | 1.43mi |
| 22 Gladiola Ct Marrero, LA | 3.0 | 2.0 | 1933 | $2,200 | $1.14 | 45d | 1 | 1.45mi |
Listing history 7 events
-
2026-06-21days on market $259,000 Active 10 DOM
-
2026-06-18days on market $259,000 Active 7 DOM
-
2026-06-17days on market $259,000 Active 6 DOM
-
2026-06-16days on market $259,000 Active 5 DOM
-
2026-06-15days on market $259,000 Active 4 DOM
-
2026-06-13remarks 699-char remark
-
2026-06-13$259,000 Active 2 DOM
ⓘ Source: listings_history table (triggers on properties + properties_extension) + one-shot
backfill from property_details.listing_events for pre-trigger history.
Tax reassessment forecast LA · Resets to sale price
- Current annual tax
- $1,306 · $109/mo
- Projected year-2 tax
- $1,424 · $119/mo
- Expected delta
- +$119/yr (+$10/mo · 9.1%)
ⓘ Screening estimate from a state-policy table — verify with the county assessor before closing.
Nearby sold comps map
Loading sold comps map…
Walkable amenities ~0.75 mi
Loading nearby amenities…
Taxation est. · year 1
- Rental income
- $26,324
- − Mortgage interest
- −$14,508
- − Property taxes
- −$1,306
- − Insurance
- −$1,295
- − Repairs & maintenance
- −$2,106
- − Management
- −$2,106
- − Depreciation
- −$7,535
- Taxable loss
- −$2,531
- Est. tax savings @ 24.0%
- +$608
- After-tax cash flow
- $2,504/yr
For passive investors: Depreciation is non-cash, so a rental often shows a tax loss while cash-flowing — sheltering income. Rental losses are passive: they offset passive income freely, and up to $25,000/yr can offset ordinary (W-2) income if you actively participate and your MAGI is under $100k (phasing out to $0 by $150k); unused losses carry forward. On sale, claimed depreciation is recaptured at up to 25%, and gains may owe capital-gains tax (a 1031 exchange can defer both). Figures are a year-1 estimate at your 24.0% rate — not tax advice; consult a CPA.
Schools (NCES district)
- District
- Jefferson Parish
- NCES district ID
- 2200840
- Math proficiency
- 24% ▼ -36.00%
- Reading proficiency
- 34% ▼ -30.00%
- Median HH income
- $48,421
- Composite
- 25.19/100
- National rank
- #7511
- State rank
- #44 of 98 in LA
Livability — Westwego
- Score
- 68/100
- State rank
- #97
- US rank
- #9851
Category grades
Schools grade is shown separately in the Schools card above.
Census & demographics
- Census place
- Westwego, LA
- County
- Jefferson Parish · 426,999 people
- City population
- 32,130
- Metro
- New Orleans-Metairie, LA
- Population (ZIP)
- 32,130
- Household income
- $53,597
- Rent vs Own
- Severe rent burden
- 1457.0
Population outlook (Jefferson County) Hauer SSP2
- Today (2025)
- 451,696 people
- By 2030
- 455,451 · +0.8%
- By 2040
- 458,308 · +1.5%
- By 2050
- 461,031 · +2.1%
- By 2075
- 476,351 · +5.5%
- By 2100
- 499,377 · +10.6%
Race, ethnicity, and origin ACS 2023
- Neighborhood character
- Diverse neighborhood (Simpson 0.65)
- Race & ethnicity
- Black 46% White 36% Hispanic / Latino 13% Two or more races 6% Asian 2%
- Hispanic origin (detail)
- Mexican 2% Dominican 2%
- Common ancestry
- Lithuanian 9% Scottish 1%
- Foreign-born
- 8% · Canada, Vietnam
- Languages at home
- 86% English-only · Spanish 11% Vietnamese 2% French/Haitian/Cajun 1%
Political lean MEDSL · Jefferson
- 2024 margin
- R (+12.9) · D 42.5% · R 55.5% · Other 2.1%
- 2008→2024 swing
- +13.6pp toward D · 2008: -26.6pp · 2024: -12.9pp
- All cycles
- 2024: R+12.9 2020: R+11.1 2016: R+14.8 2012: R+18.4 2008: R+26.6
Not yet ingested
- Civics
- —
Market trends
- HPI YoY
- ▼ -111.56%
- Current HPI
- 102.9992
- Rent YoY
- ▼ -0.80%
- Metro
- New Orleans-Metairie, LA
- State GDP YoY
- ▲ 3.29%
- F500 in state
- 10
Industry mix (Fortune 500 HQ in LA)
| Industry | F500 HQs | Revenue |
|---|---|---|
| Telecommunications | 2 | $23B |
|
||
| Utilities | 1 | $12B |
|
||
| Wholesale / Distribution | 1 | $5B |
|
||
| Advertising | 1 | $2B |
|
||
Price history
+204.7% since first listed3 events — show timeline
- 2026-06-11 Listed $259,000 AcadianaMLS
- 2026-06-11 Listed $259,000 GSREIN
- 1996-05-01 Sold (Public Records) $85,000 Public Records
Property tax history
+3.0%/yrLatest (2025): $1,306 · -0.2% YoY. Source: county tax records.
Cash-flow waterfall
monthlySold comps — $/sqft
last 12 mo · ≤1 miLoading sold comps…