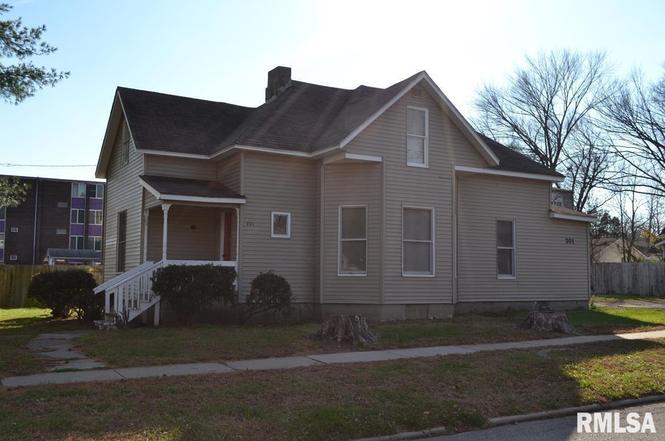
701 W Cherry St #1 · Carbondale, IL
Flood risk 1/10 · Minimal
- FEMA flood zone
- X (unshaded)
- Chance of flooding over 30 yrs
- 0.0%
- Est. flood insurance / yr
- $507 – $1,088
Fire risk 2/10 · Minimal
- Est. fire insurance / yr
- $804 – $1,492
Heat risk 5/10 · Moderate
- Hot days now (above 107°F)
- 7 days/yr
- Hot days in 30 yrs
- 21 days/yr
Wind risk 2/10 · Minimal
- Chance of severe wind over 30 yrs
- 2.0%
Air-quality risk 2/10 · Minimal
- Unhealthy air days now
- 0 days/yr
- Unhealthy air days in 30 yrs
- 1 days/yr
Risk factors via First Street. Map © Google.
Why this score? — see what drove the C+ grade
The composite is a weighted blend of 9 inputs, each scored 0–100. Each bar is that input's sub-score; the figure is the points it added to the 100-point composite (weight × sub-score).
- Cash flow +27.6/30.0
- DSCR +9.7/10.0
- 1% rule +7.5/10.0
- ARV discount +7.5/15.0
- Rent growth +3.6/5.0
- Livability +3.5/5.0
- Condition / age +2.5/5.0
- Schools +2.4/10.0
- Appreciation +0.0/10.0
$56,800
🖨 Deal sheet 📄 Offer letter ✓ Due diligence
Listing remarks
OWNER IS RETIRING and selling several properties. This particular one is one large unit with 6 bedrooms and 2 baths. There is wood, carpet and vinyl flooring throughout. And a basement with w/ d hookups. The property is being sold AS IS with no warranties. It has been vacant and shows no expenses.
Key facts
- 7,200 sq ft lot
- Listed 86 days
Property features AI
Finance
- Other: Single building unit (1 unit in building); Not rebuilt or rehabbed
- Financial info: No special service area
Exterior
- Parking: Parking lot
- Utilities: Public water; Public sewer
- Home design: Two- to four-unit property; Fee simple ownership; Over 100 years old; Built before 1978; Address on a south-facing side of the street (701 W Cherry St)
- Construction: Vinyl siding exterior
- Exterior features: Corner, level lot; Lot dimensions approximately 60 x 120
Interior
- Bedrooms: Up to 6 possible bedrooms
- Bathrooms: 2 full baths
- Heating & cooling: Electric heating available; Natural gas heating available
- Interior features: 10 rooms total; Partial basement
Neighborhood map
What this means for you Summary
Snapshot
- This is a ?-bed/2.0-bath condo listed at $57k.
Deal economics
- At list price, monthly cash flow is $169 ($2k/yr) — positive.
- The deal already cash-flows at list — no discount required.
- Meets the 1% rule at list price ($711 rent vs $57k).
- Recommended offer: $53k (6.0% below list) — sets the bar for market timing.
- Cap rate 9.9% vs local median 4.9% in Carbondale — top-decile yield for the area; either an underpriced asset or a hidden risk that comps aren't pricing in. Stress-test before assuming the spread holds.
Location & tenants
- Location reads 70/100 on livability (#375 in IL) — a middle-class / working-renter tenant base. Strengths: amenities A+, commute A+, cost of living A+; Watch: housing C-, schools D+, crime F.
- Carbondale Chsd 165 (urban): math 26% / reading 35% proficiency, ranked #279 of 620 in IL (top 45%) — families likely to look elsewhere, expect single-tenant / working-renter base with shorter leases.
- Market conditions: Rents rising fast (+4.5%/yr); 202 active listings in the ZIP; 4 comparable units currently listed for rent nearby; rentals lingering (median 44d on market — plan ~5-8 weeks vacancy on turnover, expect pricing pressure); 100% of comp listings sitting > 30 days — soft ceiling on asking rent; lower-income renter base — watch delinquency; 5 units permitted in Jackson County in 2024 (0 in 5+ unit buildings).
Forward outlook
- Local home prices are declining (-3.0%/yr); year-one equity from $393 of loan paydown is wiped out by about $2k of value loss. Plan a longer hold.
- At projected returns (-3.0% appreciation + 4.5% rent growth), your $16k cash investment doubles in ~8 years — after that, you're playing with house money.
Negotiation context
- It's been on market 87 days — a 6% lower offer ($53k) is reasonable based on typical stale-listing flexibility.
Risks & watch-outs
- Climate carrying-cost: extreme-heat days projected 7→21/yr by 2055 (HVAC capex compounding) — expect insurance premiums to compound above CPI over the hold.
Questions for the listing agent
- It's been on market 87 days. Have you received any prior offers? Is the seller open to a 6% concession, seller financing, or rate buy-down credit?
- Any open or pending special assessments — roof, HVAC, plumbing, elevator, façade? What's the per-unit balance and payoff schedule, and is the seller paying it off at close or rolling it to the buyer?
- Why hasn't it sold? Are there any deal-killer items the seller is aware of (foundation, flood, title, zoning, code violations)?
- Is there a deadline driving the sale (1031 exchange, divorce, estate, relocation)? That informs how much negotiation room exists.
- Schools are D-rated, which usually means shorter tenancies and higher turnover. Who's the typical renter profile here, and what's been the actual vacancy rate?
- Crime grade is F in this area — have there been break-ins, vandalism, or insurance claims at this property in the last 3 years? What carrier currently insures it and at what premium?
- What's the average days-on-market for RENTAL listings here right now (not sales)? A rising rental-DOM trend means longer vacancies and softer asking-rent achievability than the comps imply.
- What's the recent tenant-quality profile in this submarket — average credit score on applications, eviction rate, late-payment / NSF rate, and stable-employment percentage? A property-management company in the area should have these aggregated.
- How much new apartment / multifamily construction is in the pipeline within 1–3 miles? Heavy new supply (>2% of stock underway) typically softens rents 12–24 months out; light construction supports rent growth.
Investment metrics
- 1% rule
- 1.25% ✓
- Cap rate
- 9.87%
- Cash-on-cash
- 12.78%
- DSCR
- 1.57
- GRM
- 6.7
CMA / ARV
No comps found within radius.
Show comp detail 8 sales within ~0.75 mi
| Address | Dist | Beds/Ba | Sqft | Sold | Price | $/sf | Match |
|---|---|---|---|---|---|---|---|
| 505 W Cherry St #2 | 0.13mi | —/— | — | 7mo | $35,000 | — | 75 |
| 502 W Freeman St #1 | 0.19mi | —/— | — | 4mo | $700,000 | — | 75 |
| 801 W College St Unit A/B | 0.13mi | —/— | 1,644 | 10mo | $88,100 | $54 | 73 |
| 310-312 W Monroe St #4 | 0.32mi | —/— | — | 3mo | $255,000 | — | 70 |
| 314 W Elm St #3 | 0.23mi | —/— | — | 10mo | $30,000 | — | 69 |
| 401 W Monroe St #3 | 0.29mi | —/— | — | 10mo | $75,000 | — | 66 |
| 514 S Logan St #2 | 0.63mi | —/— | — | 18mo | $120,000 | — | 43 |
| 603 S Logan St Unit A and B | 0.71mi | —/— | — | 24mo | $75,000 | — | 35 |
Match score weights: distance 35% · size 25% · config 20% · recency 20%. Top-matched comps best support the ARV.
Projected returns pro-forma
-3.0% appreciation · 4.51% rent growth · sell at horizon
- IRR
- 4.3%
- Equity multiple
- 1.17×
- Total profit
- $2,693
- Equity at exit
- $8,469
- IRR
- 15.2%
- Equity multiple
- 2.32×
- Total profit
- $20,925
- Equity at exit
- $4,911
Cash invested: $15,904 (down + closing). Projections, not guarantees.
Landlord ↔ Tenant lean methodology
- Overall (STATE)
- 43 Moderately Tenant-Leaning
- State Illinois
- 43 Moderately Tenant-Leaning · D+7
- County
- — inherits STATE
- City
- — inherits STATE
ZIP-level market 62901
- Rents YoY
- 4.5%
- Active inventory
- 202
- Price-to-rent
- 6.7×
Monthly cashflow live
- Estimated rent
- $711 medium interval (Pro) →
- Mortgage (P&I)
- −$298
- Tax est. 1.5%
- −$71 /mo · $852/yr
- Insurance
- −$24
- HOA
- −$0
- Vacancy / Maint / Mgmt
- −$149
- Net cashflow
- $169
Break-even live
UW: 25.0% down · 7.5% · 30yr · 1.5% tax · 5.0% vac · 8.0% maint · 8.0% mgmt
Financing live
Cash to close
- Down payment
- $14,200
- Closing costs
- $1,704
- Reserves months
- —
- Total cash needed
- —
Loan-product check · same deal, 3 products live
Conventional
25% down · 7.5% · 30yr
- Down + closing
- —
- Monthly P&I
- —
- Monthly cashflow
- —
- DSCR
- —
- Eligible?
- —
Personal DTI + credit; lowest rate.
DSCR
20% down · 8.5% · 30yr
- Down + closing
- —
- Monthly P&I
- —
- Monthly cashflow
- —
- DSCR
- —
- Eligible?
- —
No personal income docs; deal must DSCR.
Hard money
10% down · 12.0% · 12mo
- Down + closing
- —
- Monthly P&I
- —
- Monthly cashflow
- —
- DSCR
- —
- Eligible?
- —
Short-term bridge; refi at stabilization.
Rent comps 4 comps
| Address | Beds | Baths | Sqft | Rent | $/sqft | DOM | Units | Dist |
|---|---|---|---|---|---|---|---|---|
| 516 S Rawlings St Carbondale, IL | 1.0 | 1.0 | 450 | $625 | $1.39 | 44d | 5 | 0.08mi |
| 600 W Mill St Carbondale, IL | 1.0 | 1.0 | 615 | $750 | $1.22 | 44d | 2 | 0.24mi |
| 405 E College St Carbondale, IL | 1.0 | 1.0 | 351 | $690 | $1.96 | 44d | 10 | 0.68mi |
| 250 S Lewis Ln Carbondale, IL | 3.0 | 1.0 | 622 | $650 | $1.04 | 44d | 1 | 1.26mi |
HOA detail condo
- Monthly dues
- $0 · $0/yr
- Assessments
- None detected in remarks — confirm with the listing agent.
Listing history 21 events
-
2026-06-19days on market $56,800 Active 87 DOM
-
2026-06-18days on market $56,800 Active 86 DOM
-
2026-06-17days on market $56,800 Active 85 DOM
-
2026-06-16days on market $56,800 Active 84 DOM
-
2026-06-15days on market $56,800 Active 83 DOM
-
2026-06-14days on market $56,800 Active 81 DOM
-
2026-06-13days on market $56,800 Active 80 DOM
-
2026-06-10days on market $56,800 Active 78 DOM
-
2026-06-09days on market $56,800 Active 77 DOM
-
2026-06-08days on market $56,800 Active 76 DOM
-
2026-06-07days on market $56,800 Active 75 DOM
-
2026-06-02days on market $56,800 Active 70 DOM
-
2026-06-01days on market $56,800 Active 69 DOM
-
2026-05-31days on market $56,800 Active 68 DOM
-
2026-05-30days on market $56,800 Active 67 DOM
-
2026-05-22status Active
-
2026-02-20status Pending
-
2026-01-08status Active
-
2026-01-06historical
-
2026-01-05historical
-
2025-12-12Active
ⓘ Source: listings_history table (triggers on properties + properties_extension) + one-shot
backfill from property_details.listing_events for pre-trigger history.
Climate risk First Street
- Flood 1/10 Low FEMA zone X (unshaded) · 0% chance over 30 yrs
- Wildfire 2/10 Low
- Heat 5/10 Major 7 d/yr ≥107°F today · 21 d/yr by 30 yrs out
- Wind 2/10 Low 2% chance of damaging wind over 30 yrs
- Air quality 2/10 Low 0 unhealthy d/yr today · 1 by 30 yrs out
Nearby sold comps map
Loading sold comps map…
Walkable amenities ~0.75 mi
Loading nearby amenities…
Taxation est. · year 1
- Rental income
- $8,536
- − Mortgage interest
- −$3,182
- − Property taxes
- −$852
- − Insurance
- −$284
- − Repairs & maintenance
- −$683
- − Management
- −$683
- − Depreciation
- −$1,652
- Taxable income
- $1,200
- Est. tax owed @ 24.0%
- −$288
- After-tax cash flow
- $1,745/yr
For passive investors: Depreciation is non-cash, so a rental often shows a tax loss while cash-flowing — sheltering income. Rental losses are passive: they offset passive income freely, and up to $25,000/yr can offset ordinary (W-2) income if you actively participate and your MAGI is under $100k (phasing out to $0 by $150k); unused losses carry forward. On sale, claimed depreciation is recaptured at up to 25%, and gains may owe capital-gains tax (a 1031 exchange can defer both). Figures are a year-1 estimate at your 24.0% rate — not tax advice; consult a CPA.
Schools (NCES district)
- District
- Carbondale Chsd 165
- NCES district ID
- 1708370
- Math proficiency
- 26% ▼ -10.00%
- Reading proficiency
- 35% ▼ -2.00%
- Median HH income
- $22,075
- Composite
- 23.92/100
- National rank
- #7787
- State rank
- #279 of 620 in IL
Livability — Carbondale
- Score
- 70/100
- State rank
- #375
- US rank
- #7806
Category grades
Schools grade is shown separately in the Schools card above.
Census & demographics
- Census place
- Carbondale, IL
- County
- Jackson County · 22,946 people
- City population
- 22,946
- Metro
- Carbondale-Marion, IL
- Population (ZIP)
- 22,946
- Household income
- $35,089
- Rent vs Own
- Severe rent burden
- 2038.0
Population outlook (Jackson County) Hauer SSP2
- Today (2025)
- 59,093 people
- By 2030
- 59,628 · +0.9%
- By 2040
- 59,495 · +0.7%
- By 2050
- 58,811 · -0.5%
- By 2075
- 57,683 · -2.4%
- By 2100
- 55,337 · -6.4%
Race, ethnicity, and origin ACS 2023
- Neighborhood character
- Diverse neighborhood (Simpson 0.58)
- Race & ethnicity
- White 59% Black 26% Asian 6% Hispanic / Latino 5% Two or more races 5%
- Hispanic origin (detail)
- Mexican 4%
- Common ancestry
- Romanian 2% Italian 2% Slovak 2%
- Foreign-born
- 9% · Canada, China, South Korea
- Languages at home
- 87% English-only · Other Indo-European 4% Spanish 4% Arabic 2%
Political lean MEDSL · Jackson
- 2024 margin
- Toss-up / Even · D 51.0% · R 47.5% · Other 1.4%
- 2008→2024 swing
- -18.3pp toward R · 2008: 21.8pp · 2024: 3.5pp
- All cycles
- 2024: D+3.5 2020: D+1.3 2016: D+3.0 2012: D+10.3 2008: D+21.8
Not yet ingested
- Civics
- —
Market trends
- HPI YoY
- ▼ -75.62%
- Current HPI
- 88.7209
- Rent YoY
- ▲ 4.51%
- Metro
- Carbondale-Marion, IL
- State GDP YoY
- ▲ 1.59%
- F500 in state
- 60
Industry mix (Fortune 500 HQ in IL)
| Industry | F500 HQs | Revenue |
|---|---|---|
| Insurance | 4 | $201B |
|
||
| Consumer Goods | 4 | $87B |
|
||
| Industrial Machinery | 3 | $64B |
|
||
| Healthcare | 2 | $55B |
|
||
| Retail / Pharmacy | 1 | $148B |
|
||
| Agriculture / Food | 1 | $86B |
|
||
Cash-flow waterfall
monthlySold comps — $/sqft
last 12 mo · ≤1 miLoading sold comps…