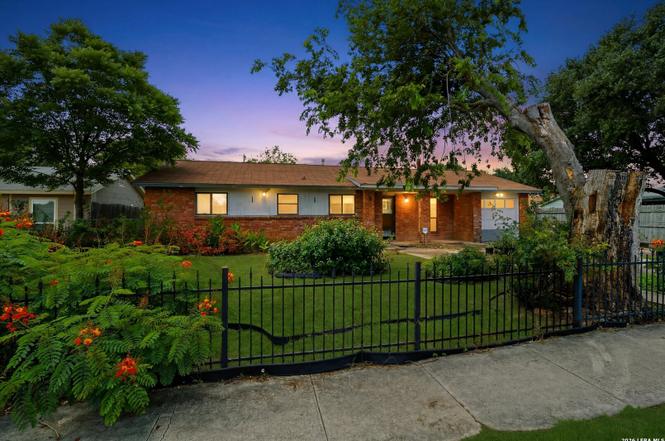
4030 Judivan · San Antonio, TX
Flood risk 1/10 · Minimal
- FEMA flood zone
- X (unshaded)
- Chance of flooding over 30 yrs
- 0.0%
- Est. flood insurance / yr
- $507 – $1,088
Fire risk 1/10 · Minimal
- Est. fire insurance / yr
- $1,222 – $2,270
Heat risk 8/10 · Major
- Hot days now (above 108°F)
- 7 days/yr
- Hot days in 30 yrs
- 23 days/yr
Wind risk 8/10 · Major
- Chance of severe wind over 30 yrs
- 80.0%
Air-quality risk 2/10 · Minimal
- Unhealthy air days now
- 0 days/yr
- Unhealthy air days in 30 yrs
- 1 days/yr
Risk factors via First Street. Map © Google.
Why this score? — see what drove the C- grade
The composite is a weighted blend of 9 inputs, each scored 0–100. Each bar is that input's sub-score; the figure is the points it added to the 100-point composite (weight × sub-score).
- ARV discount +15.0/15.0
- Cash flow +14.9/30.0
- 1% rule +5.3/10.0
- DSCR +4.6/10.0
- Livability +4.0/5.0
- Schools +3.8/10.0
- Condition / age +2.5/5.0
- Rent growth +1.1/5.0
- Appreciation +0.0/10.0
$149,900
🖨 Deal sheet (PDF) 📄 Offer letter ✓ Due diligence
Listing remarks
Single-family CASH ONLY investment opportunity SOLD AS IS featuring 4 bedrooms, 1.5 bathrooms, and 1,146 square feet of living space. The property offers a functional open layout with a natural flow between the living and dining areas, providing a solid foundation for future updates, customization, or reconfiguration. Includes a one-car garage and a large backyard, adding strong upside potential for exterior improvements, expansion, or enhanced outdoor use. This property is ideal for investors or buyers looking for a value-add opportunity. With renovation, it has strong potential for resale or rental income. Sold as is.
Key facts
- 7,710 sq ft lot
- Garage
- Built 1971
Property features AI
Finance
- Other: Possession at closing/funding; For sale
- Financial info: Down payment resource not indicated
- HOA & community: Located in EAST TERRELL HILLS HEIGHTS / EAST TERRELL HILLS NE subdivision
Exterior
- Parking: 1-car garage
- Utilities: City water and sewer
- Home design: Pre-owned single-family home; Approximately 55 years old
- Construction: Slab foundation; Composition roof
- Exterior features: Brick and siding exterior
Interior
- Kitchen: Kitchen (12 x 8); Includes Stove/Range, Refrigerator, Dishwasher
- Bedrooms: Master bedroom on lower level (13 x 10); Bedroom 2 (12 x 10); Bedroom 3 (12 x 10); Bedroom 4 (10 x 10)
- Flooring: Vinyl flooring
- Bathrooms: 2 total bathrooms (1 full, 1 half); Master bath with single vanity (5 x 5); no tub or shower
- Heating & cooling: Central heating (natural gas); Central air conditioning
- Interior features: Living area and separate dining room; Laundry located in garage; Washer, Dryer, Stove/Range, Refrigerator, Dishwasher
- Laundry & utility: Washer and Dryer (laundry in garage)
Neighborhood map
What this means for you Summary
Snapshot
- This is a 3-bed/1.5-bath single-family listed at $150k.
Deal economics
- At list price, monthly cash flow is $44 ($525/yr) — positive.
- The deal already cash-flows at list — no discount required.
- Meets the 1% rule at list price ($2k rent vs $150k).
- Recommended offer: $148k (1.5% below list) — sets the bar for market timing.
- Cap rate 6.6% vs local median 3.8% in San Antonio — top-decile yield for the area; either an underpriced asset or a hidden risk that comps aren't pricing in. Stress-test before assuming the spread holds.
Location & tenants
- Location reads 80/100 on livability (#31 in TX, #1,616 nationally) — a professional / high-income tenant draw. Strengths: amenities A+, commute A+, cost of living A+; Watch: crime F.
- North East ISD (urban): math 38% / reading 49% proficiency, ranked #276 of 826 in TX (top 33%) — families likely to look elsewhere, expect single-tenant / working-renter base with shorter leases.
- Zoned schools: East Terrell Hills El (math 19% / reading 38%, grade F, #2,706 of 4,322 statewide, top 63%, 601 students, 92% FRL); Krueger Middle (math 37% / reading 34%, grade F, #827 of 1,662 statewide, top 51%, 813 students, 77% FRL); Roosevelt H S (math 20% / reading 40%, grade F, #1,096 of 1,632 statewide, top 68%, 2,599 students, 72% FRL) — zoned schools average 80% FRL vs 41% district-wide (39 pts higher); higher-poverty schools than district average — tighter screening recommended.
- Zoned-school proficiency averages 31% at this address vs 44% district-wide (-12 pts) — the specific schools serving this property underperform the North East ISD average; the district grade overstates school quality for this exact location.
- Market conditions: Rents falling (-5.6%/yr); 135 active listings in the ZIP; 40 comparable units currently listed for rent nearby; rentals at typical pace (median 20d on market — plan ~3-4 weeks tenant-placement turnaround); 8,308 units permitted in Bexar County in 2024 (2,506 in 5+ unit buildings).
- This rent runs 32% of the median local income ($57k/yr) — at the standard rent-burdened threshold; future hikes will face affordability resistance.
Forward outlook
- Local home prices are declining (-3.0%/yr); year-one equity from $1k of loan paydown is wiped out by about $4k of value loss. Plan a longer hold.
- Bexar County population projected at +50% by 2050 — long-run rental-demand tailwind backs the buy-and-hold thesis.
Negotiation context
- It's been on market 17 days — a 2% lower offer ($148k) is reasonable based on typical stale-listing flexibility.
Risks & watch-outs
- Watch-outs: property tax is 2.6% of price.
- Climate carrying-cost: severe wind risk, 80% chance of damaging wind over 30y; extreme-heat days projected 7→23/yr by 2055 (HVAC capex compounding) — expect insurance premiums to compound above CPI over the hold.
Questions for the listing agent
- Built in 1971 — when were the roof, HVAC, electrical panel, plumbing, and water heater last replaced?
- Property tax is high relative to price — has the assessment been appealed recently, and will the sale trigger a re-assessment?
- Is there a deadline driving the sale (1031 exchange, divorce, estate, relocation)? That informs how much negotiation room exists.
- Crime grade is F in this area — have there been break-ins, vandalism, or insurance claims at this property in the last 3 years? What carrier currently insures it and at what premium?
- What's the average days-on-market for RENTAL listings here right now (not sales)? A rising rental-DOM trend means longer vacancies and softer asking-rent achievability than the comps imply.
- What's the recent tenant-quality profile in this submarket — average credit score on applications, eviction rate, late-payment / NSF rate, and stable-employment percentage? A property-management company in the area should have these aggregated.
- How much new for-sale + rental construction is in the pipeline within 1–3 miles? Heavy new supply typically softens prices + rents 12–24 months out; constrained supply supports both.
Investment metrics
- 1% rule
- 1.03% ✓
- Cap rate
- 6.64%
- Cash-on-cash
- 1.25%
- DSCR
- 1.06
- GRM
- 8.1
CMA / ARV
- ARV (on-the-fly)
- $195,966
- Comps found
- 12
Show comp detail 12 sales within ~0.75 mi
| Address | Dist | Beds/Ba | Sqft | Sold | Price | $/sf | Match |
|---|---|---|---|---|---|---|---|
| 4106 Tropical | 0.16mi | 4/2.0 (+1) | 1,161 (+1%) | 9mo | $220,000 | $189 | 76 |
| 4207 Tallulah | 0.30mi | 3/2.0 | 1,100 (-4%) | 9mo | $195,000 | $177 | 70 |
| 4163 Judivan | 0.21mi | 3/2.0 | 1,244 (+9%) | 8mo | $175,000 | $141 | 67 |
| 3730 La Sabre Dr | 0.48mi | 3/2.0 | 1,104 (-4%) | 6mo | $149,000 | $135 | 65 |
| 6718 Pear Tree | 0.09mi | 3/1.5 | 1,308 (+14%) | 9mo | $135,000 | $103 | 65 |
| 1127 Olney | 0.36mi | 3/2.0 | 1,284 (+12%) | 2mo | $219,900 | $171 | 59 |
| 4334 Diamondhead | 0.54mi | 3/2.0 | 1,204 (+5%) | 10mo | $174,900 | $145 | 56 |
| 4411 Bikini Dr | 0.55mi | 3/2.0 | 1,212 (+6%) | 9mo | $215,000 | $177 | 55 |
| 215 Antrim | 0.53mi | 3/1.0 | 988 (-14%) | 8mo | $150,000 | $152 | 43 |
| 339 Timberlane | 0.68mi | 3/2.0 | 1,033 (-10%) | 10mo | $175,000 | $169 | 42 |
| 3702 La Sabre Dr | 0.57mi | 2/1.0 (-1) | 1,027 (-10%) | 9mo | $185,000 | $180 | 41 |
| 215 Artemis | 0.73mi | 3/1.0 | 984 (-14%) | 4mo | $185,000 | $188 | 37 |
Match score weights: distance 35% · size 25% · config 20% · recency 20%. Top-matched comps best support the ARV.
Projected returns pro-forma
-3.0% appreciation · 0.0% rent growth · sell at horizon
- IRR
- -18.1%
- Equity multiple
- 0.38×
- Total profit
- $-25,911
- Equity at exit
- $22,351
- IRR
- -18.9%
- Equity multiple
- 0.14×
- Total profit
- $-35,991
- Equity at exit
- $12,961
Cash invested: $41,972 (down + closing). Projections, not guarantees.
Landlord ↔ Tenant lean methodology
- Overall (STATE)
- 87 Strongly Landlord-Friendly
- State Texas
- 87 Strongly Landlord-Friendly · R+5
- County
- — inherits STATE
- City
- — inherits STATE
ZIP-level market 78218
- Home prices YoY
- -16.1%
- Rents YoY
- -5.6%
- Active inventory
- 135
- Price-to-rent
- 8.1×
Monthly cashflow live
- Estimated rent
- $1,541 high interval (Pro) →
- Mortgage (P&I)
- −$786
- Tax from tax record
- −$325 /mo · $3,904/yr
- Insurance
- −$62
- HOA
- −$0
- Vacancy / Maint / Mgmt
- −$324
- Net cashflow
- $44
Break-even live
Sensitivity live
| Price | -10% $129 | -5% $86 | +0% $44 | +5% $1 | +10% $-41 |
|---|---|---|---|---|---|
| Rent | -10% $-78 | -5% $-17 | +0% $44 | +5% $105 | +10% $166 |
| Rate | -1.0pp $119 | -0.5pp $82 | base $44 | +0.5pp $5 | +1.0pp $-35 |
UW: 25.0% down · 7.5% · 30yr · 1.5% tax · 5.0% vac · 8.0% maint · 8.0% mgmt
Financing live
Cash to close
- Down payment
- $37,475
- Closing costs
- $4,497
- Reserves months
- —
- Total cash needed
- —
Loan-product check · same deal, 3 products live
Conventional
25% down · 7.5% · 30yr
- Down + closing
- —
- Monthly P&I
- —
- Monthly cashflow
- —
- DSCR
- —
- Eligible?
- —
Personal DTI + credit; lowest rate.
DSCR
20% down · 8.5% · 30yr
- Down + closing
- —
- Monthly P&I
- —
- Monthly cashflow
- —
- DSCR
- —
- Eligible?
- —
No personal income docs; deal must DSCR.
Hard money
10% down · 12.0% · 12mo
- Down + closing
- —
- Monthly P&I
- —
- Monthly cashflow
- —
- DSCR
- —
- Eligible?
- —
Short-term bridge; refi at stabilization.
Rent comps 40 comps
| Address | Beds | Baths | Sqft | Rent | $/sqft | DOM | Units | Dist |
|---|---|---|---|---|---|---|---|---|
| 4102 Waikiki Dr San Antonio, TX | 3.0 | 1.0 | 1167 | $1,395 | $1.20 | 15d | 1 | 0.32mi |
| 354 Brettonwood Dr Unit 1 San Antonio, TX | 3.0 | 1.0 | 1056 | $1,395 | $1.32 | 45d | 1 | 0.39mi |
| 4207 Waikiki Dr San Antonio, TX | 3.0 | 2.0 | 1144 | $1,475 | $1.29 | 45d | 1 | 0.41mi |
| 339 Brettonwood Dr San Antonio, TX | 3.0 | 2.0 | 1063 | $2,000 | $1.88 | 25d | 1 | 0.41mi |
| 258 Antrim Dr San Antonio, TX | 3.0 | 2.0 | 1252 | $1,595 | $1.27 | 45d | 1 | 0.43mi |
| 3730 La Sabre Dr San Antonio, TX | 4.0 | 2.0 | 1434 | $1,900 | $1.32 | 45d | 1 | 0.50mi |
| 4229 Renault Dr San Antonio, TX | 3.0 | 2.0 | 1152 | $1,525 | $1.32 | 19d | 1 | 0.50mi |
| 226 Antrim Dr San Antonio, TX | 3.0 | 1.0 | 960 | $1,395 | $1.45 | 4d | 1 | 0.51mi |
| 258 Cresham Dr San Antonio, TX | 3.0 | 2.0 | 1383 | $1,650 | $1.19 | 45d | 1 | 0.55mi |
| 106 Covina Ave San Antonio, TX | 3.0 | 2.0 | 1421 | $2,000 | $1.41 | 3d | 1 | 0.56mi |
| 1006 Sumner Dr San Antonio, TX | 3.0 | 2.0 | 1314 | $1,697 | $1.29 | 25d | 1 | 0.57mi |
| 206 Covina Ave San Antonio, TX | 3.0 | 2.0 | 1332 | $2,000 | $1.50 | 25d | 1 | 0.60mi |
| 4431 Myrna Dr San Antonio, TX | 2.0 | 2.0 | 1186 | $1,035 | $0.87 | 16d | 1 | 0.63mi |
| 842 Corinne Dr #21 San Antonio, TX | 3.0 | 2.0 | 1248 | $49,000 | $39.26 | 23d | 1 | 0.69mi |
| 6810 Glendora Ave Unit 15 San Antonio, TX | 2.0 | 1.0 | 1000 | $865 | $0.86 | 45d | 1 | 0.75mi |
| 3600 Eisenhauer Rd San Antonio, TX | 1.0–2.0 | 1.0–2.0 | 681 | $1,579 | $2.32 | 0d | 17 | 0.82mi |
| 343 Blaze Ave San Antonio, TX | 3.0 | 2.0 | 1438 | $1,750 | $1.22 | 18d | 1 | 0.85mi |
| 2530 Harry Wurzbach Rd San Antonio, TX | 1.0–3.0 | 1.0–2.0 | 950 | $1,420 | $1.49 | 0d | 11 | 0.89mi |
| 3400 Northeast Pkwy Apt 1116 San Antonio, TX | 2.0 | 1.5 | 950 | $1,199 | $1.26 | 45d | 1 | 0.90mi |
| 3400 Northeast Pkwy Apt 710 San Antonio, TX | 2.0 | 2.0 | 950 | $1,035 | $1.09 | 0d | 1 | 0.93mi |
| 3400 Northeast Pkwy Unit 1808 San Antonio, TX | 2.0 | 2.0 | 1039 | $1,199 | $1.15 | 45d | 1 | 0.93mi |
| 2447 Harry Wurzbach Rd Unit 210-D San Antonio, TX | 2.0 | 1.0 | 900 | $775 | $0.86 | 0d | 1 | 0.95mi |
| 547 Cicero Ave Unit NA San Antonio, TX | 3.0 | 2.0 | 1500 | $1,525 | $1.02 | 45d | 1 | 0.96mi |
| 2447 Harry Wurzbach Rd Unit 231-I San Antonio, TX | 2.0 | 2.0 | 1000 | $899 | $0.90 | 16d | 1 | 0.97mi |
| 2447 Harry Wurzbach Rd Unit 203-B San Antonio, TX | 2.0 | 2.0 | 1000 | $950 | $0.95 | 23d | 1 | 0.97mi |
| 742 Olney Dr San Antonio, TX | 3.0 | 2.0 | 1469 | $1,445 | $0.98 | 45d | 1 | 1.00mi |
| 143 Huxley Dr San Antonio, TX | 3.0 | 2.0 | 1290 | $2,000 | $1.55 | 25d | 1 | 1.03mi |
| 538 Lanark Dr San Antonio, TX | 2.0 | 1.0 | 987 | $1,295 | $1.31 | 25d | 1 | 1.10mi |
| 538 Lanark Dr San Antonio, TX | 2.0 | 1.0 | 987 | $1,295 | $1.31 | 18d | 1 | 1.10mi |
| 630 Sumner Dr San Antonio, TX | 4.0 | 2.0 | 1368 | $1,975 | $1.44 | 19d | 1 | 1.21mi |
| 4848 Goldfield San Antonio, TX | 2.0 | 1.0 | 930 | $1,325 | $1.42 | 45d | 1 | 1.22mi |
| 2355 Austin Hwy Apt 710 San Antonio, TX | 2.0 | 2.0 | 908 | $873 | $0.96 | 0d | 1 | 1.28mi |
| 245 Deerwood Dr San Antonio, TX | 2.0 | 1.0 | 770 | $695 | $0.90 | 4d | 1 | 1.32mi |
| 3202 Eisenhauer Rd San Antonio, TX | 2.0–3.0 | 2.0–2.5 | 1375 | $1,795 | $1.30 | 4d | 2 | 1.33mi |
| 3202 Eisenhauer Rd #801 San Antonio, TX | 2.0 | 2.0 | 1407 | $1,795 | $1.28 | 4d | 1 | 1.33mi |
| 3158 Eisenhauer Rd San Antonio, TX | 2.0 | 1.0 | 733 | $1,099 | $1.50 | 45d | 1 | 1.36mi |
| 236 Deerwood Dr San Antonio, TX | 1.0–2.0 | 1.0 | 712 | $1,004 | $1.41 | 15d | 10 | 1.36mi |
| 4811 Village Vw San Antonio, TX | 3.0 | 2.0 | 1288 | $1,450 | $1.13 | 9d | 1 | 1.37mi |
| 515 Blakeley Dr San Antonio, TX | 3.0 | 2.0 | 1118 | $2,000 | $1.79 | 18d | 1 | 1.37mi |
| 438 Sumner Dr San Antonio, TX | 2.0 | 1.0 | 816 | $1,350 | $1.65 | 9d | 1 | 1.41mi |
Listing history 11 events
-
2026-06-21days on market $149,900 Active 17 DOM
-
2026-06-18days on market $149,900 Active 14 DOM
-
2026-06-17days on market $149,900 Active 13 DOM
-
2026-06-16days on market $149,900 Active 12 DOM
-
2026-06-15statusdays on market $149,900 Active 11 DOM
-
2026-06-13days on market $149,900 New 9 DOM
-
2026-06-13days on market $149,900 New 8 DOM
-
2026-06-09days on market $149,900 New 5 DOM
-
2026-06-08days on market $149,900 New 4 DOM
-
2026-06-07remarks 627-char remark
-
2026-06-07$149,900 New 3 DOM
ⓘ Source: listings_history table (triggers on properties + properties_extension) + one-shot
backfill from property_details.listing_events for pre-trigger history.
Tax reassessment forecast TX · Resets to sale price
- Current annual tax
- $3,904 · $325/mo
- Projected year-2 tax
- $3,904 · $325/mo
- Expected delta
- $0/yr ($0/mo · 0.0%)
ⓘ Screening estimate from a state-policy table — verify with the county assessor before closing.
Climate risk First Street
- Flood 1/10 Low FEMA zone X (unshaded) · 0% chance over 30 yrs
- Wildfire 1/10 Low
- Heat 8/10 Severe 7 d/yr ≥108°F today · 23 d/yr by 30 yrs out
- Wind 8/10 Severe 80% chance of damaging wind over 30 yrs
- Air quality 2/10 Low 0 unhealthy d/yr today · 1 by 30 yrs out
Nearby sold comps map
Loading sold comps map…
Walkable amenities ~0.75 mi
Loading nearby amenities…
Taxation est. · year 1
- Rental income
- $18,496
- − Mortgage interest
- −$8,397
- − Property taxes
- −$3,904
- − Insurance
- −$750
- − Repairs & maintenance
- −$1,480
- − Management
- −$1,480
- − Depreciation
- −$4,361
- Taxable loss
- −$1,874
- Est. tax savings @ 24.0%
- +$450
- After-tax cash flow
- $975/yr
For passive investors: Depreciation is non-cash, so a rental often shows a tax loss while cash-flowing — sheltering income. Rental losses are passive: they offset passive income freely, and up to $25,000/yr can offset ordinary (W-2) income if you actively participate and your MAGI is under $100k (phasing out to $0 by $150k); unused losses carry forward. On sale, claimed depreciation is recaptured at up to 25%, and gains may owe capital-gains tax (a 1031 exchange can defer both). Figures are a year-1 estimate at your 24.0% rate — not tax advice; consult a CPA.
Schools (NCES district)
- District
- North East ISD
- NCES district ID
- 4832940
- Math proficiency
- 38% ▼ -14.00%
- Reading proficiency
- 49% ▼ -4.00%
- Median HH income
- $57,715
- Composite
- 38.1/100
- National rank
- #4276
- State rank
- #276 of 826 in TX
Livability — San Antonio
- Score
- 80/100
- State rank
- #31
- US rank
- #1616
Category grades
Schools grade is shown separately in the Schools card above.
Census & demographics
- Census place
- San Antonio, TX
- County
- Bexar County · 1,990,555 people
- City population
- 1,806,925
- Metro
- San Antonio-New Braunfels, TX
- Population (ZIP)
- 39,428
- Household income
- $57,285
- Rent vs Own
- Severe rent burden
- 2508.0
Population outlook (Bexar County) Hauer SSP2
- Today (2025)
- 2,336,851 people
- By 2030
- 2,560,728 · +9.6%
- By 2040
- 3,020,569 · +29.3%
- By 2050
- 3,493,522 · +49.5%
- By 2075
- 4,668,459 · +99.8%
- By 2100
- 5,533,242 · +136.8%
Race, ethnicity, and origin ACS 2023
- Neighborhood character
- Diverse neighborhood (Simpson 0.64)
- Race & ethnicity
- Hispanic / Latino 53% Two or more races 26% White 25% Black 14% Asian 3% Native American 2%
- Hispanic origin (detail)
- Mexican 41% Puerto Rican 3%
- Common ancestry
- Serbian 2% Italian 1% Romanian 1%
- Foreign-born
- 18% · Canada, Vietnam, China
- Languages at home
- 60% English-only · Spanish 34% Vietnamese 1% Other Asian/Pacific 1%
Political lean MEDSL · Bexar
- 2024 margin
- Lean D (+9.8) · D 54.3% · R 44.6% · Other 1.1%
- 2008→2024 swing
- +4.2pp toward D · 2008: 5.6pp · 2024: 9.8pp
- All cycles
- 2024: D+9.8 2020: D+18.2 2016: D+13.5 2012: D+4.6 2008: D+5.6
Not yet ingested
- Civics
- —
Market trends
- HPI YoY
- ▼ -52.17%
- Current HPI
- 271.2807
- Rent YoY
- ▼ -5.56%
- Metro
- San Antonio-New Braunfels, TX
- State GDP YoY
- ▲ 3.95%
- F500 in state
- 110
Industry mix (Fortune 500 HQ in TX)
| Industry | F500 HQs | Revenue |
|---|---|---|
| Energy | 16 | $1,198B |
|
||
| Technology | 5 | $198B |
|
||
| Engineering / Construction | 4 | $72B |
|
||
| Energy Services | 3 | $60B |
|
||
| Utilities | 3 | $41B |
|
||
| Healthcare | 2 | $330B |
|
||
Price history
1 event — show timeline
- 2026-06-04 Listed $149,900 LERA
Property tax history
+5.8%/yrLatest (2025): $3,904 · +4.0% YoY. Source: county tax records.
Cash-flow waterfall
monthlySold comps — $/sqft
last 12 mo · ≤1 miLoading sold comps…