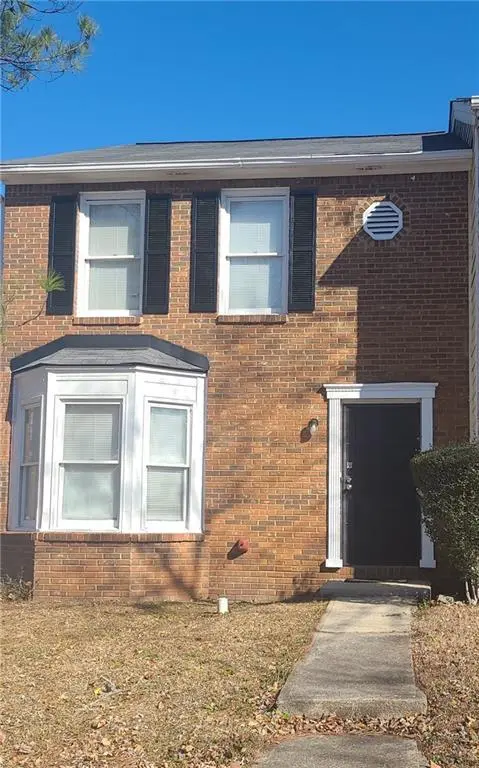
8010 Woodlake Dr · Riverdale, GA
Flood risk 1/10 · Minimal
- FEMA flood zone
- X (unshaded)
- Chance of flooding over 30 yrs
- 0.0%
- Est. flood insurance / yr
- $507 – $1,088
Fire risk 3/10 · Minor
- Est. fire insurance / yr
- $963 – $1,789
Heat risk 6/10 · Moderate
- Hot days now (above 105°F)
- 7 days/yr
- Hot days in 30 yrs
- 18 days/yr
Wind risk 6/10 · Moderate
- Chance of severe wind over 30 yrs
- 27.0%
Air-quality risk 4/10 · Minor
- Unhealthy air days now
- 4 days/yr
- Unhealthy air days in 30 yrs
- 6 days/yr
Risk factors via First Street. Map © Google.
Why this score? — see what drove the F grade
The composite is a weighted blend of 9 inputs, each scored 0–100. Each bar is that input's sub-score; the figure is the points it added to the 100-point composite (weight × sub-score).
- Cash flow +7.5/30.0
- Livability +3.5/5.0
- Rent growth +2.8/5.0
- Condition / age +2.5/5.0
- 1% rule +2.1/10.0
- DSCR +1.7/10.0
- Schools +1.3/10.0
- ARV discount +0.0/15.0
- Appreciation +0.0/10.0
$220,000
🖨 Deal sheet 📄 Offer letter ✓ Due diligence
Listing remarks MLS
convenient 2 bedroom, 2 and 1/2 bath townhome! features include, new flooring, paint. Kitchen includes all appliances, tile floors, a fireplace in the family room, split bedroom plan, and bay window.
Key facts
- 2 parking spots
- Built 1986
- Listed 52 days
Property features AI
Exterior
- Parking: Two parking spaces
- Utilities: Public water; Public sewer; Electricity available; Cable available
- Home design: Two-story property; Resale condition
- Construction: Brick, cedar and wood siding exterior; Composition roof
- Exterior features: Paved level driveway; Open parking available; Near shopping, public transportation, sidewalks and street lights
Interior
- Bedrooms: Two-level home
- Flooring: Carpet; Laminate
- Heating & cooling: Central heating (natural gas); Central air conditioning
- Interior features: Bay windows; Ceiling fans
Neighborhood map
What this means for you Summary
Snapshot
- This is a 2-bed/3.0-bath townhouse listed at $220k.
Deal economics
- At list price, monthly cash flow is $-271 ($-3k/yr) — negative.
- To cash-flow at today's rent, offer at most $172k (21.8% below list).
- To meet the 1% rule (rent ≥ 1% of price), the offer needs to be $156k (29.3% below list).
- Recommended offer: $156k (29.3% below list) — sets the bar for 1% rule.
Location & tenants
- Location reads 70/100 on livability (#100 in GA) — a middle-class / working-renter tenant base. Strengths: cost of living A+, housing A+; Watch: crime D, amenities F, commute F.
- Clayton County (suburban): math 11% / reading 20% proficiency, ranked #155 of 174 in GA (top 89%) — low school quality limits family demand, transient renter base, plan for 1-2y turnover; 78% free/reduced lunch — lower-income household profile, screen leases tightly.
- Zoned schools: Kendrick Middle School (math 17% / reading 27%, grade F, #333 of 470 statewide, top 72%, 696 students, 90% FRL); Riverdale High School (math 12% / reading 17%, grade F, #315 of 424 statewide, top 76%, 1,333 students, 90% FRL).
- Market conditions: Rents rising (+1.3%/yr); 182 active listings in the ZIP; 40 comparable units currently listed for rent nearby; rentals at typical pace (median 16d on market — plan ~3-4 weeks tenant-placement turnaround); 865 units permitted in Clayton County in 2024 (448 in 5+ unit buildings).
- This rent runs 36% of the median local income ($52k/yr) — at the standard rent-burdened threshold; future hikes will face affordability resistance.
Forward outlook
- Local home prices are declining (-3.0%/yr); year-one equity from $2k of loan paydown is wiped out by about $7k of value loss. Plan a longer hold.
- Clayton County population projected at +29% by 2050 — long-run rental-demand tailwind backs the buy-and-hold thesis.
Negotiation context
- It's been on market 52 days — a 3% lower offer ($213k) is reasonable based on typical stale-listing flexibility.
- 4 sale attempts since 13y ago with the ask held roughly flat each time — persistent listings suggest the price (not the market) is what's stuck; bring a comps-based counter.
- Current owner paid $49k; list at $220k implies a 349% gain — meaningful room to come down on a strong offer.
Risks & watch-outs
- Climate carrying-cost: major wind risk, 27% chance of damaging wind over 30y; extreme-heat days projected 7→18/yr by 2055 (HVAC capex compounding) — expect insurance premiums to compound above CPI over the hold.
Questions for the listing agent
- What do current leases actually rent for vs. the listed asking? Can we see a recent rent roll and the last 12 months of T-12 income?
- It's been on market 52 days. Have you received any prior offers? Is the seller open to a 29% concession, seller financing, or rate buy-down credit?
- Is there a deadline driving the sale (1031 exchange, divorce, estate, relocation)? That informs how much negotiation room exists.
- Schools are D-rated, which usually means shorter tenancies and higher turnover. Who's the typical renter profile here, and what's been the actual vacancy rate?
- Crime grade is D in this area — have there been break-ins, vandalism, or insurance claims at this property in the last 3 years? What carrier currently insures it and at what premium?
- The area grade is low — what's the realistic commute time and amenity access for the typical tenant pool here? Any planned neighborhood developments (good or bad) we should know about?
- What's the average days-on-market for RENTAL listings here right now (not sales)? A rising rental-DOM trend means longer vacancies and softer asking-rent achievability than the comps imply.
- What's the recent tenant-quality profile in this submarket — average credit score on applications, eviction rate, late-payment / NSF rate, and stable-employment percentage? A property-management company in the area should have these aggregated.
- How much new for-sale + rental construction is in the pipeline within 1–3 miles? Heavy new supply typically softens prices + rents 12–24 months out; constrained supply supports both.
Investment metrics
- 1% rule
- 0.71% ✗
- Cap rate
- 4.81%
- Cash-on-cash
- -5.28%
- DSCR
- 0.77
- GRM
- 11.8
CMA / ARV
- ARV (on-the-fly)
- $165,608
- Comps found
- 8
Show comp detail 8 sales within ~0.75 mi
| Address | Dist | Beds/Ba | Sqft | Sold | Price | $/sf | Match |
|---|---|---|---|---|---|---|---|
| 366 N Beach Ct | 0.12mi | 3/2.5 (+1) | 1,326 (+2%) | 2mo | $70,000 | $53 | 83 |
| 8023 Creekstone Way | 0.09mi | 2/3.5 | 1,300 (-0%) | 13mo | $107,000 | $82 | 82 |
| 8040 Creekstone Way | 0.11mi | 3/2.5 (+1) | 1,332 (+2%) | 4mo | $178,500 | $134 | 81 |
| 8114 Woodlake Dr | 0.17mi | 3/2.0 (+1) | 1,267 (-3%) | 6mo | $195,000 | $154 | 73 |
| 8080 Woodlake | 0.15mi | 2/2.5 | 1,280 (-2%) | 19mo | $140,000 | $109 | 72 |
| 390 Lakeridge Ct | 0.12mi | 3/2.0 (+1) | 1,256 (-4%) | 10mo | $149,900 | $119 | 71 |
| 8168 Canyon Forge Dr | 0.51mi | 3/2.0 (+1) | 1,260 (-3%) | 9mo | $175,000 | $139 | 54 |
| 8205 Canyon Forge Dr | 0.54mi | 2/1.5 | 1,224 (-6%) | 18mo | $155,250 | $127 | 43 |
Match score weights: distance 35% · size 25% · config 20% · recency 20%. Top-matched comps best support the ARV.
Projected returns pro-forma
-3.0% appreciation · 1.3% rent growth · sell at horizon
- IRR
- -27.2%
- Equity multiple
- 0.10×
- Total profit
- $-55,515
- Equity at exit
- $32,803
- IRR
- -32.2%
- Equity multiple
- -0.31×
- Total profit
- $-80,898
- Equity at exit
- $19,022
Cash invested: $61,600 (down + closing). Projections, not guarantees.
Landlord ↔ Tenant lean methodology
- Overall (STATE)
- 90 Strongly Landlord-Friendly
- State Georgia
- 90 Strongly Landlord-Friendly · R+3
- County
- — inherits STATE
- City
- — inherits STATE
ZIP-level market 30274
- Home prices YoY
- -19.6%
- Rents YoY
- 1.3%
- Active inventory
- 182
- Price-to-rent
- 11.8×
Monthly cashflow live
- Estimated rent
- $1,555 high interval (Pro) →
- Mortgage (P&I)
- −$1,154
- Tax from tax record
- −$254 /mo · $3,052/yr
- Insurance
- −$92
- HOA
- −$0
- Vacancy / Maint / Mgmt
- −$327
- Net cashflow
- $-271
Break-even live
UW: 25.0% down · 7.5% · 30yr · 1.5% tax · 5.0% vac · 8.0% maint · 8.0% mgmt
Financing live
Cash to close
- Down payment
- $55,000
- Closing costs
- $6,600
- Reserves months
- —
- Total cash needed
- —
Loan-product check · same deal, 3 products live
Conventional
25% down · 7.5% · 30yr
- Down + closing
- —
- Monthly P&I
- —
- Monthly cashflow
- —
- DSCR
- —
- Eligible?
- —
Personal DTI + credit; lowest rate.
DSCR
20% down · 8.5% · 30yr
- Down + closing
- —
- Monthly P&I
- —
- Monthly cashflow
- —
- DSCR
- —
- Eligible?
- —
No personal income docs; deal must DSCR.
Hard money
10% down · 12.0% · 12mo
- Down + closing
- —
- Monthly P&I
- —
- Monthly cashflow
- —
- DSCR
- —
- Eligible?
- —
Short-term bridge; refi at stabilization.
Rent comps 40 comps
| Address | Beds | Baths | Sqft | Rent | $/sqft | DOM | Units | Dist |
|---|---|---|---|---|---|---|---|---|
| 8062 Creekstone Way Riverdale, GA | 2.0 | 2.5 | 1232 | $1,286 | $1.04 | 43d | 1 | 0.11mi |
| 8066 Woodlake Dr Riverdale, GA | 2.0 | 2.5 | 1280 | $1,505 | $1.18 | 4d | 1 | 0.14mi |
| 8078 Woodlake Dr Riverdale, GA | 2.0 | 2.5 | 1280 | $1,445 | $1.13 | 2d | 1 | 0.15mi |
| 7943 Taylor Cir Riverdale, GA | 3.0 | 2.0 | 1344 | $1,665 | $1.24 | 43d | 1 | 0.21mi |
| 426 Park Ridge Cir Riverdale, GA | 3.0 | 2.0 | 1578 | $1,773 | $1.12 | 43d | 1 | 0.31mi |
| 8104 Webb Rd Riverdale, GA | 1.0–2.0 | 1.0–2.0 | 890 | $1,549 | $1.74 | 2d | 18 | 0.31mi |
| 8050 Taylor Rd Riverdale, GA | 1.0–3.0 | 1.0–2.0 | 944 | $1,152 | $1.22 | 1d | 12 | 0.31mi |
| 8183 Rhodes Way Riverdale, GA | 3.0 | 2.5 | 1650 | $1,945 | $1.18 | 19d | 1 | 0.45mi |
| 8195 Rhodes Way Riverdale, GA | 3.0 | 2.0 | 1546 | $2,090 | $1.35 | 24d | 1 | 0.48mi |
| 8194 Canyon Forge Dr Riverdale, GA | 3.0 | 2.5 | 1488 | $1,555 | $1.05 | 4d | 1 | 0.53mi |
| 8226 Canyon Forge Dr Riverdale, GA | 3.0 | 2.5 | 1512 | $1,631 | $1.08 | 13d | 1 | 0.60mi |
| 8238 Canyon Forge Dr Riverdale, GA | 2.0 | 2.5 | 1246 | $1,400 | $1.12 | 4d | 1 | 0.63mi |
| 8038 Flamingo Dr Jonesboro, GA | 3.0 | 1.5 | 1178 | $1,553 | $1.32 | 24d | 1 | 0.64mi |
| 8147 Mountain Pass Riverdale, GA | 3.0 | 2.0 | 1432 | $1,960 | $1.37 | 5d | 1 | 0.68mi |
| 269 Highway 138 SW Riverdale, GA | 1.0–2.0 | 1.0–2.0 | 995 | $1,375 | $1.38 | 2d | 36 | 0.70mi |
| 14 Cardinal Ln Jonesboro, GA | 3.0 | 2.0 | 1118 | $1,501 | $1.34 | 5d | 1 | 0.71mi |
| 102 Palisades Pointe Riverdale, GA | 2.0 | 2.5 | 1224 | $1,673 | $1.37 | 4d | 1 | 0.77mi |
| 53 Skylark Ln Jonesboro, GA | 3.0 | 1.5 | 1176 | $1,595 | $1.36 | 24d | 1 | 0.82mi |
| 7560 Taylor Rd #26 Riverdale, GA | 2.0 | 1.0 | 1158 | $1,250 | $1.08 | 43d | 1 | 0.84mi |
| 8443 Cedar Creek Rdg Riverdale, GA | 3.0 | 2.0 | 1476 | $1,735 | $1.18 | 19d | 1 | 0.85mi |
| 7 Old Roundtree Rd Riverdale, GA | 3.0 | 2.5 | 1620 | $1,840 | $1.14 | 10d | 1 | 0.88mi |
| 8150 Flamingo Dr Jonesboro, GA | 3.0 | 2.0 | 1092 | $1,630 | $1.49 | 4d | 1 | 0.91mi |
| 8225 Attleboro Dr Jonesboro, GA | 3.0 | 2.0 | 1040 | $1,295 | $1.25 | 19d | 1 | 0.96mi |
| 66 Darwin Dr Jonesboro, GA | 3.0 | 2.0 | 1118 | $1,425 | $1.27 | 4d | 1 | 1.00mi |
| 8600 Cedar Creek Rdg Riverdale, GA | 3.0 | 2.0 | 1555 | $1,745 | $1.12 | 5d | 1 | 1.04mi |
| 8614 Cedar Creek Rdg Riverdale, GA | 3.0 | 2.5 | 1728 | $1,500 | $0.87 | 43d | 1 | 1.07mi |
| 222 Peartree Ln Riverdale, GA | 3.0 | 1.5 | 1028 | $1,480 | $1.44 | 24d | 1 | 1.07mi |
| 8612 Thomas Rd Riverdale, GA | 3.0 | 2.5 | 1532 | $1,623 | $1.06 | 43d | 1 | 1.08mi |
| 8609 Thomas Ln Riverdale, GA | 3.0 | 2.5 | 1530 | $1,658 | $1.08 | 24d | 1 | 1.09mi |
| 8630 Thomas Rd Riverdale, GA | 3.0 | 2.5 | 1530 | $1,500 | $0.98 | 24d | 1 | 1.11mi |
| 950 Lake Ridge Pkwy Riverdale, GA | 1.0–2.0 | 1.0–2.0 | 966 | $1,462 | $1.51 | 2d | 30 | 1.11mi |
| 100 Chase Ridge Dr Riverdale, GA | 2.0 | 2.0 | 1175 | $1,545 | $1.31 | 43d | 1 | 1.13mi |
| 100 Chase Ridge Dr Riverdale, GA | 1.0–2.0 | 1.0–2.0 | 1002 | $1,545 | $1.54 | 5d | 6 | 1.13mi |
| 8631 Thomas Ln Riverdale, GA | 3.0 | 2.5 | 1530 | $1,673 | $1.09 | 22d | 1 | 1.13mi |
| 7432 Meadows Dr Riverdale, GA | 3.0 | 2.0 | 1640 | $1,716 | $1.05 | 5d | 1 | 1.13mi |
| 8640 Thomas Ln Riverdale, GA | 3.0 | 2.5 | 1530 | $1,673 | $1.09 | 24d | 1 | 1.14mi |
| 8584 Guthrie Dr Riverdale, GA | 3.0 | 2.0 | 1445 | $1,650 | $1.14 | 15d | 1 | 1.14mi |
| 233 Lucan Way Riverdale, GA | 3.0 | 2.0 | 1201 | $1,665 | $1.39 | 4d | 1 | 1.14mi |
| 8644 Thomas Ln Riverdale, GA | 3.0 | 2.5 | 1530 | $1,623 | $1.06 | 43d | 1 | 1.15mi |
| 164 Meadowlark Ln Jonesboro, GA | 3.0 | 1.5 | 1056 | $1,665 | $1.58 | 2d | 1 | 1.16mi |
Listing history 21 events
-
2026-06-18days on market $220,000 Active 52 DOM
-
2026-06-17days on market $220,000 Active 51 DOM
-
2026-06-16days on market $220,000 Active 50 DOM
-
2026-06-15days on market $220,000 Active 49 DOM
-
2026-06-13days on market $220,000 Active 47 DOM
-
2026-06-09days on market $220,000 Active 43 DOM
-
2026-06-08days on market $220,000 Active 42 DOM
-
2026-06-07days on market $220,000 Active 41 DOM
-
2026-06-04days on market $220,000 Active 38 DOM
-
2026-06-03days on market $220,000 Active 37 DOM
-
2026-06-02days on market $220,000 Active 36 DOM
-
2026-06-01days on market $220,000 Active 35 DOM
-
2026-05-31days on market $220,000 Active 34 DOM
-
2026-04-27$220,000 New 199-char remark
Show marketing remark (199 chars)
convenient 2 bedroom, 2 and 1/2 bath townhome! features include, new flooring, paint. Kitchen includes all appliances, tile floors, a fireplace in the family room, split bedroom plan, and bay window.
-
2026-04-27$220,000 Active 199-char remark
Show marketing remark (199 chars)
convenient 2 bedroom, 2 and 1/2 bath townhome! features include, new flooring, paint. Kitchen includes all appliances, tile floors, a fireplace in the family room, split bedroom plan, and bay window.
-
2016-11-23soldstatus $49,000
-
2013-08-01historical
-
2013-04-10historical
-
2013-04-03$35,000 New
-
2013-03-29$35,000 New
-
1999-11-12soldstatus $78,200
ⓘ Source: listings_history table (triggers on properties + properties_extension) + one-shot
backfill from property_details.listing_events for pre-trigger history.
Tax reassessment forecast GA · Resets to sale price
- Current annual tax
- $3,052 · $254/mo
- Projected year-2 tax
- $3,052 · $254/mo
- Expected delta
- $0/yr ($0/mo · 0.0%)
ⓘ Screening estimate from a state-policy table — verify with the county assessor before closing.
Climate risk First Street
- Flood 1/10 Low FEMA zone X (unshaded) · 0% chance over 30 yrs
- Wildfire 3/10 Moderate
- Heat 6/10 Major 7 d/yr ≥105°F today · 18 d/yr by 30 yrs out
- Wind 6/10 Major 27% chance of damaging wind over 30 yrs
- Air quality 4/10 Moderate 4 unhealthy d/yr today · 6 by 30 yrs out
Nearby sold comps map
Loading sold comps map…
Walkable amenities ~0.75 mi
Loading nearby amenities…
Taxation est. · year 1
- Rental income
- $18,663
- − Mortgage interest
- −$12,323
- − Property taxes
- −$3,052
- − Insurance
- −$1,100
- − Repairs & maintenance
- −$1,493
- − Management
- −$1,493
- − Depreciation
- −$6,400
- Taxable loss
- −$7,198
- Est. tax savings @ 24.0%
- +$1,727
- After-tax cash flow
- $-1,525/yr
For passive investors: Depreciation is non-cash, so a rental often shows a tax loss while cash-flowing — sheltering income. Rental losses are passive: they offset passive income freely, and up to $25,000/yr can offset ordinary (W-2) income if you actively participate and your MAGI is under $100k (phasing out to $0 by $150k); unused losses carry forward. On sale, claimed depreciation is recaptured at up to 25%, and gains may owe capital-gains tax (a 1031 exchange can defer both). Figures are a year-1 estimate at your 24.0% rate — not tax advice; consult a CPA.
Schools (NCES district)
- District
- Clayton County
- NCES district ID
- 1301230
- Math proficiency
- 11% ▼ -13.00%
- Reading proficiency
- 20% ▼ -9.00%
- Median HH income
- $42,266
- Composite
- 13.41/100
- National rank
- #9527
- State rank
- #155 of 174 in GA
Livability — Riverdale
- Score
- 70/100
- State rank
- #100
- US rank
- #7907
Category grades
Schools grade is shown separately in the Schools card above.
Census & demographics
- County
- Clayton County · 230,153 people
- City population
- 61,126
- Metro
- Atlanta-Sandy Springs-Alpharetta, GA
- Population (ZIP)
- 34,081
- Household income
- $52,209
- Rent vs Own
- Severe rent burden
- 2586.0
Population outlook (Clayton County) Hauer SSP2
- Today (2025)
- 310,777 people
- By 2030
- 329,762 · +6.1%
- By 2040
- 368,052 · +18.4%
- By 2050
- 401,196 · +29.1%
- By 2075
- 472,488 · +52.0%
- By 2100
- 500,446 · +61.0%
Race, ethnicity, and origin ACS 2023
- Neighborhood character
- Predominantly Black (76%)
- Race & ethnicity
- Black 76% Hispanic / Latino 14% Two or more races 5% Asian 5% White 5%
- Hispanic origin (detail)
- Mexican 9% Puerto Rican 1%
- Foreign-born
- 15% · Canada, Vietnam
- Languages at home
- 80% English-only · Spanish 12% Vietnamese 2% Other Asian/Pacific 2%
Political lean MEDSL · Clayton
- 2024 margin
- Solid D (+69.2) · D 84.3% · R 15.1%
- 2008→2024 swing
- +2.8pp toward D · 2008: 66.4pp · 2024: 69.2pp
- All cycles
- 2024: D+69.2 2020: D+70.9 2016: D+71.9 2012: D+70.1 2008: D+66.4
Not yet ingested
- Civics
- —
Market trends
- HPI YoY
- ▼ -57.82%
- Current HPI
- 236.3592
- Rent YoY
- ▲ 1.30%
- Metro
- Atlanta-Sandy Springs-Alpharetta, GA
- State GDP YoY
- ▲ 2.66%
- F500 in state
- 28
Industry mix (Fortune 500 HQ in GA)
| Industry | F500 HQs | Revenue |
|---|---|---|
| Paper / Packaging | 2 | $29B |
|
||
| Retail | 1 | $160B |
|
||
| Transportation / Logistics | 1 | $91B |
|
||
| Airlines | 1 | $62B |
|
||
| Consumer Goods | 1 | $47B |
|
||
| Utilities | 1 | $25B |
|
||
Price history
+181.3% since first listed8 events — show timeline
- 2026-04-27 Listed $220,000 FMLS
- 2026-04-27 Listed $220,000 GAMLS
- 2016-11-23 Sold (Public Records) $49,000 Public Records
- 2013-08-01 Listing Removed — GAMLS
- 2013-04-10 Listing Removed — GAMLS
- 2013-04-03 Listed $35,000 GAMLS
- 2013-03-29 Listed $35,000 GAMLS
- 1999-11-12 Sold (Public Records) $78,200 Public Records
Property tax history
+6.2%/yrLatest (2025): $3,052 · +9.1% YoY. Source: county tax records.
Cash-flow waterfall
monthlySold comps — $/sqft
last 12 mo · ≤1 miLoading sold comps…