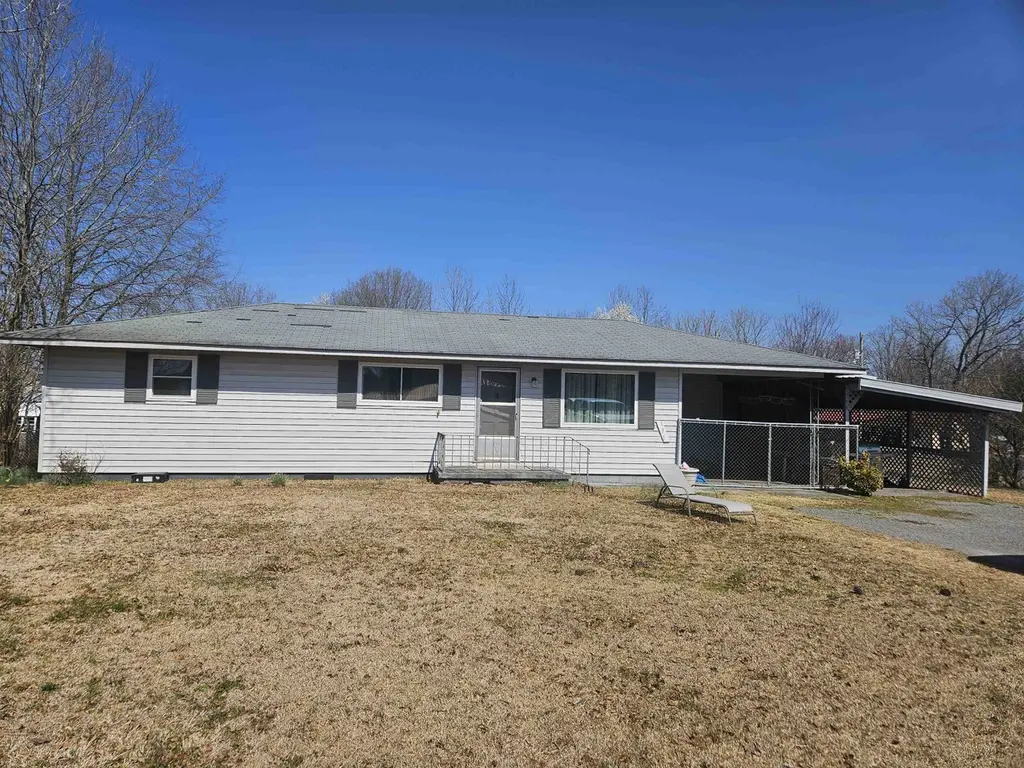
131 Lakeview Dr · Holly Pond, AL
Flood risk 1/10 · Minimal
- FEMA flood zone
- X (unshaded)
- Chance of flooding over 30 yrs
- 0.0%
- Est. flood insurance / yr
- $507 – $1,088
Fire risk 3/10 · Minor
- Est. fire insurance / yr
- $916 – $1,700
Heat risk 5/10 · Moderate
- Hot days now (above 105°F)
- 7 days/yr
- Hot days in 30 yrs
- 19 days/yr
Wind risk 4/10 · Minor
- Chance of severe wind over 30 yrs
- 20.0%
Air-quality risk 2/10 · Minimal
- Unhealthy air days now
- 0 days/yr
- Unhealthy air days in 30 yrs
- 3 days/yr
Risk factors via First Street. Map © Google.
Why this score? — see what drove the C grade
The composite is a weighted blend of 9 inputs, each scored 0–100. Each bar is that input's sub-score; the figure is the points it added to the 100-point composite (weight × sub-score).
- ARV discount +14.6/15.0
- Cash flow +14.5/30.0
- Appreciation +10.0/10.0
- DSCR +4.4/10.0
- 1% rule +4.0/10.0
- Livability +3.0/5.0
- Schools +2.8/10.0
- Rent growth +2.5/5.0
- Condition / age +2.5/5.0
$149,900
🖨 Deal sheet 📄 Offer letter ✓ Due diligence
Listing remarks MLS
Looking for a good buy. This 3 bedroom, 1 bath home is priced to sell. Bathroom has been updated; there are a few minor repairs need. Property is sold as is.
Key facts
- 0.45 acre lot
- Built 1974
- Listed 332 days
Neighborhood map
What this means for you Summary
Snapshot
- This is a 3-bed/1.0-bath single-family listed at $150k.
Deal economics
- At list price, monthly cash flow is $34 ($411/yr) — positive.
- The deal already cash-flows at list — no discount required.
- To meet the 1% rule (rent ≥ 1% of price), the offer needs to be $135k (9.6% below list).
- Recommended offer: $132k (12.0% below list) — sets the bar for market timing.
- Cap rate 6.6% vs local median 3.9% in Holly Pond — top-decile yield for the area; either an underpriced asset or a hidden risk that comps aren't pricing in. Stress-test before assuming the spread holds.
Location & tenants
- Location reads 59/100 on livability (#326 in AL) — a working-class tenant base; expect higher turnover. Strengths: cost of living A+, housing A; Watch: schools C-, crime D+, amenities F.
- Cullman County (rural): math 19% / reading 49% proficiency, ranked #49 of 129 in AL (top 38%) — families likely to look elsewhere, expect single-tenant / working-renter base with shorter leases.
- Market conditions: 35 active listings in the ZIP; 180 units permitted in Cullman County in 2024 (0 in 5+ unit buildings).
Forward outlook
- In year one you build about $16k of equity ($1k loan paydown + $15k appreciation (10.0% local appreciation)).
- At projected returns (10.0% appreciation + 3.0% rent growth), your $42k cash investment doubles in ~3 years — after that, you're playing with house money.
- By year 3, paydown + projected appreciation supports a ~$41k cash-out refi (75% LTV) — recoverable capital for the next deal without selling this one.
Negotiation context
- It's been on market 333 days — a 12% lower offer ($132k) is reasonable based on typical stale-listing flexibility.
- 4 sale attempts since 11y ago with the ask held roughly flat each time — persistent listings suggest the price (not the market) is what's stuck; bring a comps-based counter.
- Current owner paid $96k; list at $150k implies a 57% gain — meaningful room to come down on a strong offer.
Risks & watch-outs
- Climate carrying-cost: extreme-heat days projected 7→19/yr by 2055 (HVAC capex compounding) — expect insurance premiums to compound above CPI over the hold.
Questions for the listing agent
- It's been on market 333 days. Have you received any prior offers? Is the seller open to a 12% concession, seller financing, or rate buy-down credit?
- Built in 1974 — when were the roof, HVAC, electrical panel, plumbing, and water heater last replaced?
- Why hasn't it sold? Are there any deal-killer items the seller is aware of (foundation, flood, title, zoning, code violations)?
- Is there a deadline driving the sale (1031 exchange, divorce, estate, relocation)? That informs how much negotiation room exists.
- Crime grade is D in this area — have there been break-ins, vandalism, or insurance claims at this property in the last 3 years? What carrier currently insures it and at what premium?
- What's the average days-on-market for RENTAL listings here right now (not sales)? A rising rental-DOM trend means longer vacancies and softer asking-rent achievability than the comps imply.
- What's the recent tenant-quality profile in this submarket — average credit score on applications, eviction rate, late-payment / NSF rate, and stable-employment percentage? A property-management company in the area should have these aggregated.
- How much new for-sale + rental construction is in the pipeline within 1–3 miles? Heavy new supply typically softens prices + rents 12–24 months out; constrained supply supports both.
Investment metrics
- 1% rule
- 0.90% ✗
- Cap rate
- 6.57%
- Cash-on-cash
- 0.98%
- DSCR
- 1.04
- GRM
- 9.2
CMA / ARV
- ARV (median comp)
- $178,133
- List price
- $149,900
- Delta
- -15.85%
- Verdict
- UNDERPRICED
- Comps
- 5 within 1.0 mi
Projected returns pro-forma
10.0% appreciation · 3.0% rent growth · sell at horizon
- IRR
- 25.0%
- Equity multiple
- 3.00×
- Total profit
- $83,844
- Equity at exit
- $135,042
- IRR
- 22.1%
- Equity multiple
- 6.84×
- Total profit
- $245,229
- Equity at exit
- $291,223
Cash invested: $41,972 (down + closing). Projections, not guarantees.
Landlord ↔ Tenant lean methodology
- Overall (STATE)
- 90 Strongly Landlord-Friendly
- State Alabama
- 90 Strongly Landlord-Friendly · R+15
- County
- — inherits STATE
- City
- — inherits STATE
ZIP-level market 35083
- Home prices YoY
- 8.9%
- Active inventory
- 35
- Price-to-rent
- 9.2×
Monthly cashflow live
- Estimated rent
- $1,355 medium interval (Pro) →
- Mortgage (P&I)
- −$786
- Tax est. 1.5%
- −$187 /mo · $2,248/yr
- Insurance
- −$62
- HOA
- −$0
- Vacancy / Maint / Mgmt
- −$284
- Net cashflow
- $34
Break-even live
UW: 25.0% down · 7.5% · 30yr · 1.5% tax · 5.0% vac · 8.0% maint · 8.0% mgmt
Financing live
Cash to close
- Down payment
- $37,475
- Closing costs
- $4,497
- Reserves months
- —
- Total cash needed
- —
Loan-product check · same deal, 3 products live
Conventional
25% down · 7.5% · 30yr
- Down + closing
- —
- Monthly P&I
- —
- Monthly cashflow
- —
- DSCR
- —
- Eligible?
- —
Personal DTI + credit; lowest rate.
DSCR
20% down · 8.5% · 30yr
- Down + closing
- —
- Monthly P&I
- —
- Monthly cashflow
- —
- DSCR
- —
- Eligible?
- —
No personal income docs; deal must DSCR.
Hard money
10% down · 12.0% · 12mo
- Down + closing
- —
- Monthly P&I
- —
- Monthly cashflow
- —
- DSCR
- —
- Eligible?
- —
Short-term bridge; refi at stabilization.
Listing history 28 events
-
2026-06-19days on market $149,900 Active 333 DOM
-
2026-06-18days on market $149,900 Active 332 DOM
-
2026-06-17days on market $149,900 Active 331 DOM
-
2026-06-16days on market $149,900 Active 330 DOM
-
2026-06-15days on market $149,900 Active 329 DOM
-
2026-06-14days on market $149,900 Active 327 DOM
-
2026-06-12days on market $149,900 Active 326 DOM
-
2026-06-09days on market $149,900 Active 323 DOM
-
2026-06-08days on market $149,900 Active 322 DOM
-
2026-06-07days on market $149,900 Active 321 DOM
-
2026-06-05days on market $149,900 Active 318 DOM
-
2026-06-03days on market $149,900 Active 317 DOM
-
2026-06-02days on market $149,900 Active 316 DOM
-
2026-06-01days on market $149,900 Active 315 DOM
-
2026-05-31days on market $149,900 Active 314 DOM
-
2026-05-30days on market $149,900 Active 313 DOM
-
2025-07-21$149,900 Active 157-char remark
Show marketing remark (157 chars)
Looking for a good buy. This 3 bedroom, 1 bath home is priced to sell. Bathroom has been updated; there are a few minor repairs need. Property is sold as is.
-
2022-11-10soldstatus $95,500
-
2021-06-28soldstatus $124,000
-
2021-06-24soldstatus $124,000 197-char remark
Show marketing remark (197 chars)
BEAUTIFUL 3BR, 1BA HOME ON CORNER LOT, KITCHEN WITH TILE BACKSPLASH OPENS INTO DINING AREA, LAMINATE WOOD FLOORS THROUGHOUT LIVING SPACE, TWO CAR CARPORT, A FENCED BACK YARD AND LARGE STORAGE SHED.
-
2021-06-24soldstatus $124,000
Show marketing remark (197 chars)
BEAUTIFUL 3BR, 1BA HOME ON CORNER LOT, KITCHEN WITH TILE BACKSPLASH OPENS INTO DINING AREA, LAMINATE WOOD FLOORS THROUGHOUT LIVING SPACE, TWO CAR CARPORT, A FENCED BACK YARD AND LARGE STORAGE SHED.
-
2021-05-13$134,900
-
2021-05-12$134,900 197-char remark
Show marketing remark (197 chars)
BEAUTIFUL 3BR, 1BA HOME ON CORNER LOT, KITCHEN WITH TILE BACKSPLASH OPENS INTO DINING AREA, LAMINATE WOOD FLOORS THROUGHOUT LIVING SPACE, TWO CAR CARPORT, A FENCED BACK YARD AND LARGE STORAGE SHED.
-
2016-03-11soldstatus $73,000
-
2016-03-10soldstatus $73,000
-
2015-05-06$75,000
-
2015-01-07soldstatus $55,000
-
2014-12-10soldstatus $40,000
ⓘ Source: listings_history table (triggers on properties + properties_extension) + one-shot
backfill from property_details.listing_events for pre-trigger history.
Climate risk First Street
- Flood 1/10 Low FEMA zone X (unshaded) · 0% chance over 30 yrs
- Wildfire 3/10 Moderate
- Heat 5/10 Major 7 d/yr ≥105°F today · 19 d/yr by 30 yrs out
- Wind 4/10 Moderate 20% chance of damaging wind over 30 yrs
- Air quality 2/10 Low 0 unhealthy d/yr today · 3 by 30 yrs out
Nearby sold comps map
Loading sold comps map…
Walkable amenities ~0.75 mi
Loading nearby amenities…
Taxation est. · year 1
- Rental income
- $16,256
- − Mortgage interest
- −$8,397
- − Property taxes
- −$2,248
- − Insurance
- −$750
- − Repairs & maintenance
- −$1,301
- − Management
- −$1,301
- − Depreciation
- −$4,361
- Taxable loss
- −$2,100
- Est. tax savings @ 24.0%
- +$504
- After-tax cash flow
- $915/yr
For passive investors: Depreciation is non-cash, so a rental often shows a tax loss while cash-flowing — sheltering income. Rental losses are passive: they offset passive income freely, and up to $25,000/yr can offset ordinary (W-2) income if you actively participate and your MAGI is under $100k (phasing out to $0 by $150k); unused losses carry forward. On sale, claimed depreciation is recaptured at up to 25%, and gains may owe capital-gains tax (a 1031 exchange can defer both). Figures are a year-1 estimate at your 24.0% rate — not tax advice; consult a CPA.
Schools (NCES district)
- District
- Cullman County
- NCES district ID
- 0101020
- Math proficiency
- 19% ▼ -35.00%
- Reading proficiency
- 49% ▲ 1.00%
- Median HH income
- $39,449
- Composite
- 28.39/100
- National rank
- #6767
- State rank
- #49 of 129 in AL
Livability — Holly Pond
- Score
- 59/100
- State rank
- #326
- US rank
- #19930
Category grades
Schools grade is shown separately in the Schools card above.
Census & demographics
- Census place
- Holly Pond, AL
- Population (ZIP)
- 4,276
Population outlook (Cullman County) Hauer SSP2
- Today (2025)
- 84,522 people
- By 2030
- 85,402 · +1.0%
- By 2040
- 86,152 · +1.9%
- By 2050
- 85,202 · +0.8%
- By 2075
- 79,679 · -5.7%
- By 2100
- 66,943 · -20.8%
Race, ethnicity, and origin ACS 2023
- Neighborhood character
- Predominantly White (93%)
- Race & ethnicity
- White 93% Hispanic / Latino 6% Two or more races 4%
- Hispanic origin (detail)
- Mexican 6%
- Common ancestry
- Slovak 2% Italian 2% Romanian 1%
- Foreign-born
- 2% · Canada
- Languages at home
- 96% English-only · Spanish 4%
Political lean MEDSL · Cullman
- 2024 margin
- Solid R (+80.5) · D 9.4% · R 89.9%
- 2008→2024 swing
- -15.3pp toward R · 2008: -65.2pp · 2024: -80.5pp
- All cycles
- 2024: R+80.5 2020: R+77.4 2016: R+77.8 2012: R+69.5 2008: R+65.2
Not yet ingested
- Civics
- —
Market trends
- HPI YoY
- ▲ 21.05%
- Current HPI
- 258.1263
- Rent YoY
- —
- Metro
- —
- State GDP YoY
- ▲ 2.94%
- F500 in state
- 4
Industry mix (Fortune 500 HQ in AL)
| Industry | F500 HQs | Revenue |
|---|---|---|
| Financial Services | 1 | $8B |
|
||
| Healthcare | 1 | $5B |
|
||
Price history
+274.8% since first listed12 events — show timeline
- 2025-07-21 Listed $149,900 SAARMLS
- 2022-11-10 Sold (Public Records) $95,500 Public Records
- 2021-06-28 Sold (Public Records) $124,000 Public Records
- 2021-06-24 Sold (MLS) $124,000 Walker County Area MLS
- 2021-06-24 Sold (MLS) $124,000 SAARMLS
- 2021-05-13 Listed $134,900 Walker County Area MLS
- 2021-05-12 Listed $134,900 SAARMLS
- 2016-03-11 Sold (Public Records) $73,000 Public Records
- 2016-03-10 Sold (MLS) $73,000 SAARMLS
- 2015-05-06 Listed $75,000 SAARMLS
- 2015-01-07 Sold (Public Records) $55,000 Public Records
- 2014-12-10 Sold (Public Records) $40,000 Public Records
Property tax history
+7.2%/yrLatest (2022): $272 · +71.9% YoY. Source: county tax records.
Cash-flow waterfall
monthlySold comps — $/sqft
last 12 mo · ≤1 miLoading sold comps…