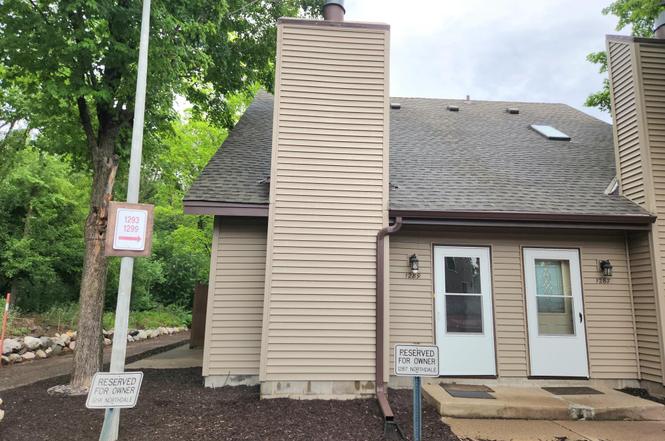
1289 Northdale Blvd NW · Coon Rapids, MN
Flood risk 1/10 · Minimal
- FEMA flood zone
- X (unshaded)
- Chance of flooding over 30 yrs
- 0.0%
- Est. flood insurance / yr
- $507 – $1,088
Fire risk 2/10 · Minimal
- Est. fire insurance / yr
- $888 – $1,650
Heat risk 2/10 · Minimal
- Hot days now (above 99°F)
- 7 days/yr
- Hot days in 30 yrs
- 14 days/yr
Wind risk 2/10 · Minimal
- Chance of severe wind over 30 yrs
- —
Air-quality risk 2/10 · Minimal
- Unhealthy air days now
- 2 days/yr
- Unhealthy air days in 30 yrs
- 2 days/yr
Risk factors via First Street. Map © Google.
Why this score? — see what drove the C- grade
The composite is a weighted blend of 9 inputs, each scored 0–100. Each bar is that input's sub-score; the figure is the points it added to the 100-point composite (weight × sub-score).
- Cash flow +17.3/30.0
- ARV discount +7.5/15.0
- 1% rule +5.9/10.0
- DSCR +5.4/10.0
- Schools +4.7/10.0
- Livability +4.3/5.0
- Rent growth +2.5/5.0
- Condition / age +2.5/5.0
- Appreciation +0.0/10.0
$125,000
🖨 Deal sheet (PDF) 📄 Offer letter ✓ Due diligence
Listing remarks MLS
Low cost condo living in the heart of Coon Rapids. Oversized lofted bedroom looks into living area below with a cozy fireplace. Low association dues. Take this opportunity to own for much less than rent. Private patio backs up to the woods.
Key facts
- Complete remodel
- Updated bath
- Stainless appliances
Tags
Property features AI
Finance
- HOA & community: HOA managed by Verde Real Estate Group; Monthly association fee of $195; HOA covers hazard insurance, lawn care, grounds maintenance, professional management, sewer, snow removal, and water
Exterior
- Parking: Assigned parking; Guest parking; Parking lot
- Utilities: City water (connected); City sewer (connected); Electric service with circuit breakers, 100 amp; Electric fuel
- Home design: Attached residential unit; Two levels; Entry on main level
- Construction: Asphalt, pitched roof; Slab foundation (foundation area approx. 352; foundation dimensions 22 x 16)
- Exterior features: Vinyl exterior; Patio (13 x 8); Located on a private, privately maintained road; Common lot area
Interior
- Kitchen: Range; Microwave; Dishwasher; Refrigerator; Disposal
- Bedrooms: One bedroom (upper level) — approx. 12 x 11.3
- Flooring: Tile floors
- Bathrooms: One full bathroom (main floor)
- Heating & cooling: Baseboard heating; Wall-mounted cooling unit(s)
- Interior features: Ceiling fan(s); Vaulted ceiling(s); Kitchen window; Water softener (owned); Eat-in kitchen and combined living/dining area; Electric fireplace insert
- Laundry & utility: Washer and dryer (included); Washer/dryer hookup; Electric water heater
Neighborhood map
What this means for you Summary
Snapshot
- This is a 1-bed/1.0-bath townhouse listed at $125k.
Deal economics
- At list price, monthly cash flow is $92 ($1k/yr) — positive.
- The deal already cash-flows at list — no discount required.
- Meets the 1% rule at list price ($1k rent vs $125k).
- Cap rate 7.2% vs local median 3.8% in Coon Rapids — top-decile yield for the area; either an underpriced asset or a hidden risk that comps aren't pricing in. Stress-test before assuming the spread holds.
Location & tenants
- Location reads 86/100 on livability (#12 in MN, #390 nationally) — a professional / high-income tenant draw. Strengths: commute A+, employment A+, housing A+; Watch: amenities D.
- Anoka-Hennepin Public School District (suburban): math 49% / reading 55% proficiency, ranked #71 of 301 in MN (top 24%) — acceptable for families but not a draw, mixed tenant base, ~2y average lease.
- Zoned schools: Eisenhower Elementary (math 64% / reading 61%, grade B, #173 of 857 statewide, top 21%, 473 students, 60% FRL); Northdale Middle (math 40% / reading 55%, grade C-, #93 of 258 statewide, top 37%, 1,274 students, 46% FRL); Coon Rapids High School (math 37% / reading 64%, grade D+, #131 of 471 statewide, top 28%, 2,167 students, 56% FRL) — zoned schools average 54% FRL vs 24% district-wide (30 pts higher); higher-poverty schools than district average — tighter screening recommended.
- Market conditions: 127 active listings in the ZIP; 2 comparable units currently listed for rent nearby; solid renter incomes; 1,083 units permitted in Anoka County in 2024 (134 in 5+ unit buildings).
- This rent is only 16% of the median local income ($103k/yr) — well below the 30% rent-burden line; pricing power to push rent on renewal without tenant pushback.
Forward outlook
- Local home prices are declining (-3.0%/yr); year-one equity from $864 of loan paydown is wiped out by about $4k of value loss. Plan a longer hold.
- Anoka County population projected at +11% by 2050 — modest demand growth; plan on rents tracking national, not racing it.
Negotiation context
- Only 6 days on market — expect competitive offers; lowballing is unlikely to land.
- 2 sale attempts since 27y ago; this cycle's ask is 318% above the opening price — seller raised mid-cycle; expect resistance to lowballs.
- Current owner paid $22k; list at $125k implies a 474% gain — meaningful room to come down on a strong offer.
Questions for the listing agent
- What does the HOA fee cover, when was the last increase, and are there any pending special assessments or reserve-fund shortfalls?
- Is there a deadline driving the sale (1031 exchange, divorce, estate, relocation)? That informs how much negotiation room exists.
- Schools are B-rated — typically a magnet for longer-tenancy family renters. What's the average tenant stay here, and is there a school-zone premium baked into asking?
- What's the average days-on-market for RENTAL listings here right now (not sales)? A rising rental-DOM trend means longer vacancies and softer asking-rent achievability than the comps imply.
- What's the recent tenant-quality profile in this submarket — average credit score on applications, eviction rate, late-payment / NSF rate, and stable-employment percentage? A property-management company in the area should have these aggregated.
- How much new for-sale + rental construction is in the pipeline within 1–3 miles? Heavy new supply typically softens prices + rents 12–24 months out; constrained supply supports both.
Investment metrics
- 1% rule
- 1.09% ✓
- Cap rate
- 7.18%
- Cash-on-cash
- 3.17%
- DSCR
- 1.14
- GRM
- 7.6
CMA / ARV
No comps found within radius.
Projected returns pro-forma
-3.0% appreciation · 3.0% rent growth · sell at horizon
- IRR
- -11.2%
- Equity multiple
- 0.59×
- Total profit
- $-14,280
- Equity at exit
- $18,638
- IRR
- -1.9%
- Equity multiple
- 0.87×
- Total profit
- $-4,480
- Equity at exit
- $10,808
Cash invested: $35,000 (down + closing). Projections, not guarantees.
Landlord ↔ Tenant lean methodology
- Overall (STATE)
- 46 Balanced
- State Minnesota
- 46 Balanced · D+2
- County
- — inherits STATE
- City
- — inherits STATE
ZIP-level market 55448
- Home prices YoY
- -27.6%
- Active inventory
- 127
- Price-to-rent
- 7.6×
Monthly cashflow live
- Estimated rent
- $1,362 medium interval (Pro) →
- Mortgage (P&I)
- −$656
- Tax from tax record
- −$81 /mo · $971/yr
- Insurance
- −$52
- HOA
- −$195
- Lot rent
- −$0
- Vacancy / Maint / Mgmt
- −$286
- Net cashflow
- $92
Break-even live
Sensitivity live
| Price | -10% $163 | -5% $128 | +0% $92 | +5% $57 | +10% $22 |
|---|---|---|---|---|---|
| Rent | -10% $-15 | -5% $39 | +0% $92 | +5% $146 | +10% $200 |
| Rate | -1.0pp $155 | -0.5pp $124 | base $92 | +0.5pp $60 | +1.0pp $27 |
UW: 25.0% down · 7.5% · 30yr · 1.5% tax · 5.0% vac · 8.0% maint · 8.0% mgmt
Financing live
Cash to close
- Down payment
- $31,250
- Closing costs
- $3,750
- Reserves months
- —
- Total cash needed
- —
Loan-product check · same deal, 3 products live
Conventional
25% down · 7.5% · 30yr
- Down + closing
- —
- Monthly P&I
- —
- Monthly cashflow
- —
- DSCR
- —
- Eligible?
- —
Personal DTI + credit; lowest rate.
DSCR
20% down · 8.5% · 30yr
- Down + closing
- —
- Monthly P&I
- —
- Monthly cashflow
- —
- DSCR
- —
- Eligible?
- —
No personal income docs; deal must DSCR.
Hard money
10% down · 12.0% · 12mo
- Down + closing
- —
- Monthly P&I
- —
- Monthly cashflow
- —
- DSCR
- —
- Eligible?
- —
Short-term bridge; refi at stabilization.
Rent comps 2 comps
| Address | Beds | Baths | Sqft | Rent | $/sqft | DOM | Units | Dist |
|---|---|---|---|---|---|---|---|---|
| 11360 Robinson Dr Coon Rapids, MN | 1.0–3.0 | 1.0–2.0 | 1029 | $1,364 | $1.32 | 27d | 1 | 0.60mi |
| 11087 Robinson Dr Unit 11087229 Coon Rapids, MN | 1.0 | 1.0 | 702 | $1,200 | $1.71 | 15d | 1 | 0.81mi |
HOA detail
- Monthly dues
- $195 · $2,340/yr
Listing history 7 events
-
2026-06-22days on market $125,000 Active 6 DOM
-
2026-06-21days on market $125,000 Active 5 DOM
-
2026-06-18days on market $125,000 Active 2 DOM
-
2026-06-17statusdays on market $125,000 Active 1 DOM
-
2026-06-16days on market $125,000 Coming Soon 2 DOM
-
2026-06-15remarks 695-char remark
-
2026-06-15$125,000 Coming Soon 1 DOM
ⓘ Source: listings_history table (triggers on properties + properties_extension) + one-shot
backfill from property_details.listing_events for pre-trigger history.
Tax reassessment forecast MN · Partial reset (capped growth)
- Current annual tax
- $971 · $81/mo
- Projected year-2 tax
- $1,186 · $99/mo
- Expected delta
- +$214/yr (+$18/mo · 22.1%)
ⓘ Screening estimate from a state-policy table — verify with the county assessor before closing.
Climate risk First Street
- Flood 1/10 Low FEMA zone X (unshaded) · 0% chance over 30 yrs
- Wildfire 2/10 Low
- Heat 2/10 Low 7 d/yr ≥99°F today · 14 d/yr by 30 yrs out
- Wind 2/10 Low
- Air quality 2/10 Low 2 unhealthy d/yr today · 2 by 30 yrs out
Nearby sold comps map
Loading sold comps map…
Walkable amenities ~0.75 mi
Loading nearby amenities…
Taxation est. · year 1
- Rental income
- $16,342
- − Mortgage interest
- −$7,002
- − Property taxes
- −$971
- − Insurance
- −$625
- − Repairs & maintenance
- −$1,307
- − Management
- −$1,307
- − HOA
- −$2,340
- − Depreciation
- −$3,636
- Taxable loss
- −$847
- Est. tax savings @ 24.0%
- +$203
- After-tax cash flow
- $1,311/yr
For passive investors: Depreciation is non-cash, so a rental often shows a tax loss while cash-flowing — sheltering income. Rental losses are passive: they offset passive income freely, and up to $25,000/yr can offset ordinary (W-2) income if you actively participate and your MAGI is under $100k (phasing out to $0 by $150k); unused losses carry forward. On sale, claimed depreciation is recaptured at up to 25%, and gains may owe capital-gains tax (a 1031 exchange can defer both). Figures are a year-1 estimate at your 24.0% rate — not tax advice; consult a CPA.
Schools (NCES district)
- District
- Anoka-Hennepin Public School District
- NCES district ID
- 2703180
- Math proficiency
- 49% ▼ -14.00%
- Reading proficiency
- 55% ▼ -10.00%
- Median HH income
- $73,837
- Composite
- 46.7/100
- National rank
- #2400
- State rank
- #71 of 301 in MN
Livability — Coon Rapids
- Score
- 86/100
- State rank
- #12
- US rank
- #390
Category grades
Schools grade is shown separately in the Schools card above.
Census & demographics
- Census place
- Coon Rapids, MN
- County
- Anoka County · 277,116 people
- City population
- 63,468
- Metro
- Minneapolis-St. Paul-Bloomington, MN-WI
- Population (ZIP)
- 29,005
- Household income
- $103,461
- Rent vs Own
- Severe rent burden
- 221.0
Population outlook (Anoka County) Hauer SSP2
- Today (2025)
- 375,223 people
- By 2030
- 387,850 · +3.4%
- By 2040
- 407,239 · +8.5%
- By 2050
- 417,541 · +11.3%
- By 2075
- 448,447 · +19.5%
- By 2100
- 464,954 · +23.9%
Race, ethnicity, and origin ACS 2023
- Neighborhood character
- Predominantly White (75%)
- Race & ethnicity
- White 75% Black 8% Asian 7% Hispanic / Latino 7% Two or more races 6%
- Hispanic origin (detail)
- Mexican 6%
- Common ancestry
- Portuguese 13% Romanian 5% Lithuanian 3%
- Foreign-born
- 11% · Canada, Vietnam, South Korea
- Languages at home
- 85% English-only · Spanish 4% Other Asian/Pacific 4% Russian/Polish/Slavic 1%
Political lean MEDSL · Anoka
- 2024 margin
- Toss-up / Even · D 46.6% · R 51.0% · Other 2.4%
- 2008→2024 swing
- -2.0pp toward R · 2008: -2.4pp · 2024: -4.4pp
- All cycles
- 2024: R+4.4 2020: R+1.9 2016: R+9.7 2012: R+2.6 2008: R+2.4
Not yet ingested
- Civics
- —
Market trends
- HPI YoY
- ▼ -97.29%
- Current HPI
- 254.7687
- Rent YoY
- —
- Metro
- Minneapolis-St. Paul-Bloomington, MN-WI
- State GDP YoY
- ▲ 2.41%
- F500 in state
- 34
Industry mix (Fortune 500 HQ in MN)
| Industry | F500 HQs | Revenue |
|---|---|---|
| Healthcare | 2 | $407B |
|
||
| Retail | 2 | $150B |
|
||
| Consumer Goods | 2 | $32B |
|
||
| Industrial Machinery | 2 | $6B |
|
||
| Agriculture | 1 | $40B |
|
||
| Healthcare / Medical Devices | 1 | $32B |
|
||
Price history
+161.0% since first listed8 events — show timeline
- 2026-06-14 Coming Soon $125,000 NORTHSTARMLS as Distributed by MLS Grid
- 2012-02-21 Sold (MLS) $21,780 NORTHSTARMLS as Distributed by MLS Grid
- 2011-11-02 Listing Removed — NORTHSTARMLS as Distributed by MLS Grid
- 2011-08-02 Listed $29,900 NORTHSTARMLS as Distributed by MLS Grid
- 2003-04-18 Sold (Public Records) $82,651 Public Records
- 1999-07-23 Sold (MLS) $47,900 NORTHSTARMLS as Distributed by MLS Grid
- 1999-06-18 Listing Removed — NORTHSTARMLS as Distributed by MLS Grid
- 1999-06-15 Listed $47,900 NORTHSTARMLS as Distributed by MLS Grid
Property tax history
+1.8%/yrLatest (2026): $971 · +1.6% YoY. Source: county tax records.
Cash-flow waterfall
monthlySold comps — $/sqft
last 12 mo · ≤1 miLoading sold comps…